
|
|||||
|
 | |
| |
| |
| |
| |
| |
|
Gene: PLD2 |
Gene summary for PLD2 |
| Gene information | Species | Human | Gene symbol | PLD2 | Gene ID | 5338 |
| Gene name | phospholipase D2 | |
| Gene Alias | PLD1C | |
| Cytomap | 17p13.2 | |
| Gene Type | protein-coding | GO ID | GO:0002252 | UniProtAcc | O14939 |
Top |
Malignant transformation analysis |
| Identification of the aberrant gene expression in precancerous and cancerous lesions by comparing the gene expression of stem-like cells in diseased tissues with normal stem cells |
| Entrez ID | Symbol | Replicates | Species | Organ | Tissue | Adj P-value | Log2FC | Malignancy |
| 5338 | PLD2 | LZE8T | Human | Esophagus | ESCC | 4.52e-04 | 1.06e-01 | 0.067 |
| 5338 | PLD2 | LZE24T | Human | Esophagus | ESCC | 2.45e-08 | 2.17e-01 | 0.0596 |
| 5338 | PLD2 | P1T-E | Human | Esophagus | ESCC | 6.55e-06 | 2.86e-01 | 0.0875 |
| 5338 | PLD2 | P2T-E | Human | Esophagus | ESCC | 1.29e-04 | 1.16e-01 | 0.1177 |
| 5338 | PLD2 | P4T-E | Human | Esophagus | ESCC | 7.78e-09 | 1.28e-01 | 0.1323 |
| 5338 | PLD2 | P5T-E | Human | Esophagus | ESCC | 6.93e-06 | 3.53e-02 | 0.1327 |
| 5338 | PLD2 | P9T-E | Human | Esophagus | ESCC | 1.24e-02 | 7.39e-02 | 0.1131 |
| 5338 | PLD2 | P11T-E | Human | Esophagus | ESCC | 9.62e-04 | 2.33e-01 | 0.1426 |
| 5338 | PLD2 | P12T-E | Human | Esophagus | ESCC | 3.73e-09 | 1.51e-01 | 0.1122 |
| 5338 | PLD2 | P15T-E | Human | Esophagus | ESCC | 5.45e-03 | 4.95e-02 | 0.1149 |
| 5338 | PLD2 | P16T-E | Human | Esophagus | ESCC | 1.01e-04 | 1.64e-01 | 0.1153 |
| 5338 | PLD2 | P17T-E | Human | Esophagus | ESCC | 8.89e-03 | 1.12e-01 | 0.1278 |
| 5338 | PLD2 | P19T-E | Human | Esophagus | ESCC | 2.73e-02 | 1.88e-01 | 0.1662 |
| 5338 | PLD2 | P20T-E | Human | Esophagus | ESCC | 1.13e-07 | 1.10e-01 | 0.1124 |
| 5338 | PLD2 | P21T-E | Human | Esophagus | ESCC | 3.55e-14 | 2.71e-01 | 0.1617 |
| 5338 | PLD2 | P22T-E | Human | Esophagus | ESCC | 5.56e-05 | 5.36e-02 | 0.1236 |
| 5338 | PLD2 | P23T-E | Human | Esophagus | ESCC | 1.12e-10 | 2.29e-01 | 0.108 |
| 5338 | PLD2 | P24T-E | Human | Esophagus | ESCC | 2.04e-05 | 1.30e-01 | 0.1287 |
| 5338 | PLD2 | P26T-E | Human | Esophagus | ESCC | 6.41e-03 | 3.67e-02 | 0.1276 |
| 5338 | PLD2 | P27T-E | Human | Esophagus | ESCC | 8.66e-06 | 1.07e-01 | 0.1055 |
| Page: 1 2 3 4 |
| Tissue | Expression Dynamics | Abbreviation |
| Esophagus | 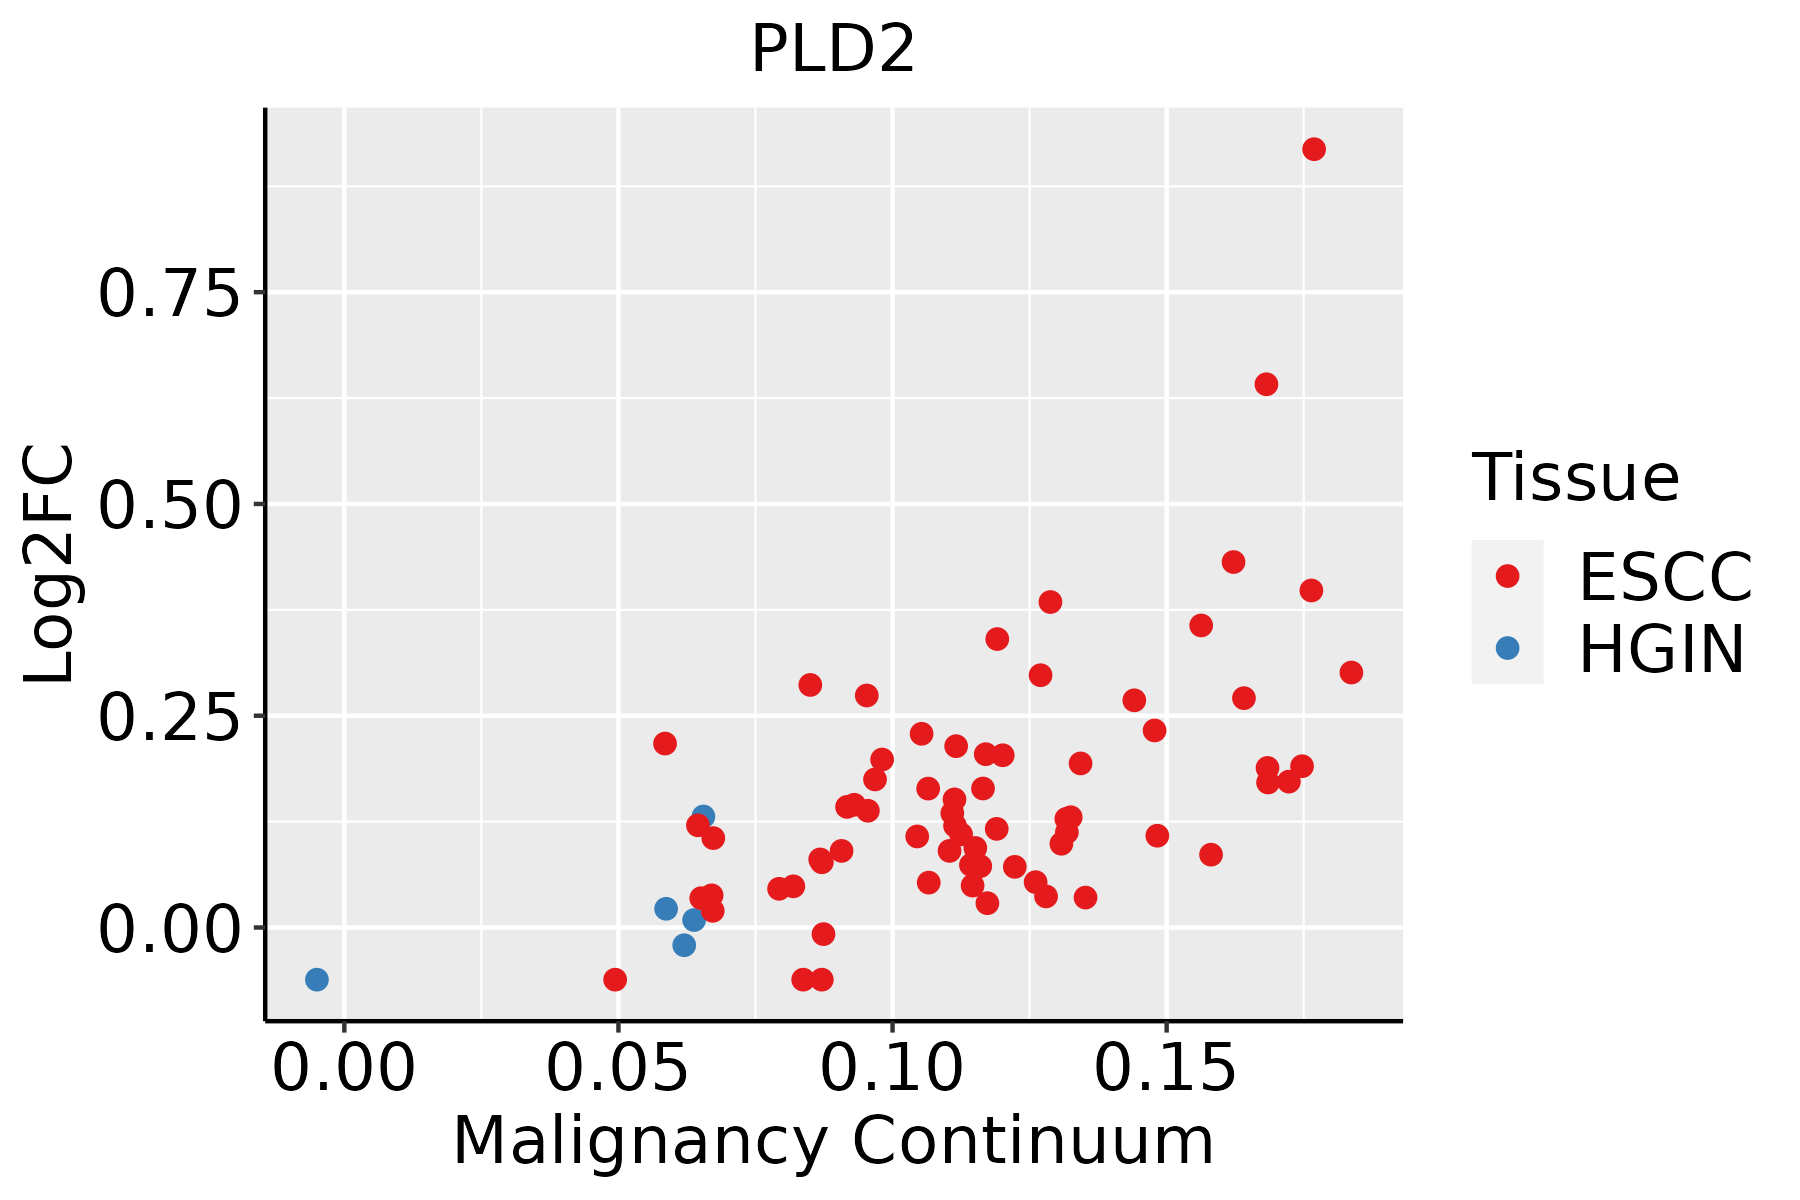 | ESCC: Esophageal squamous cell carcinoma |
| HGIN: High-grade intraepithelial neoplasias | ||
| LGIN: Low-grade intraepithelial neoplasias | ||
| Oral Cavity | 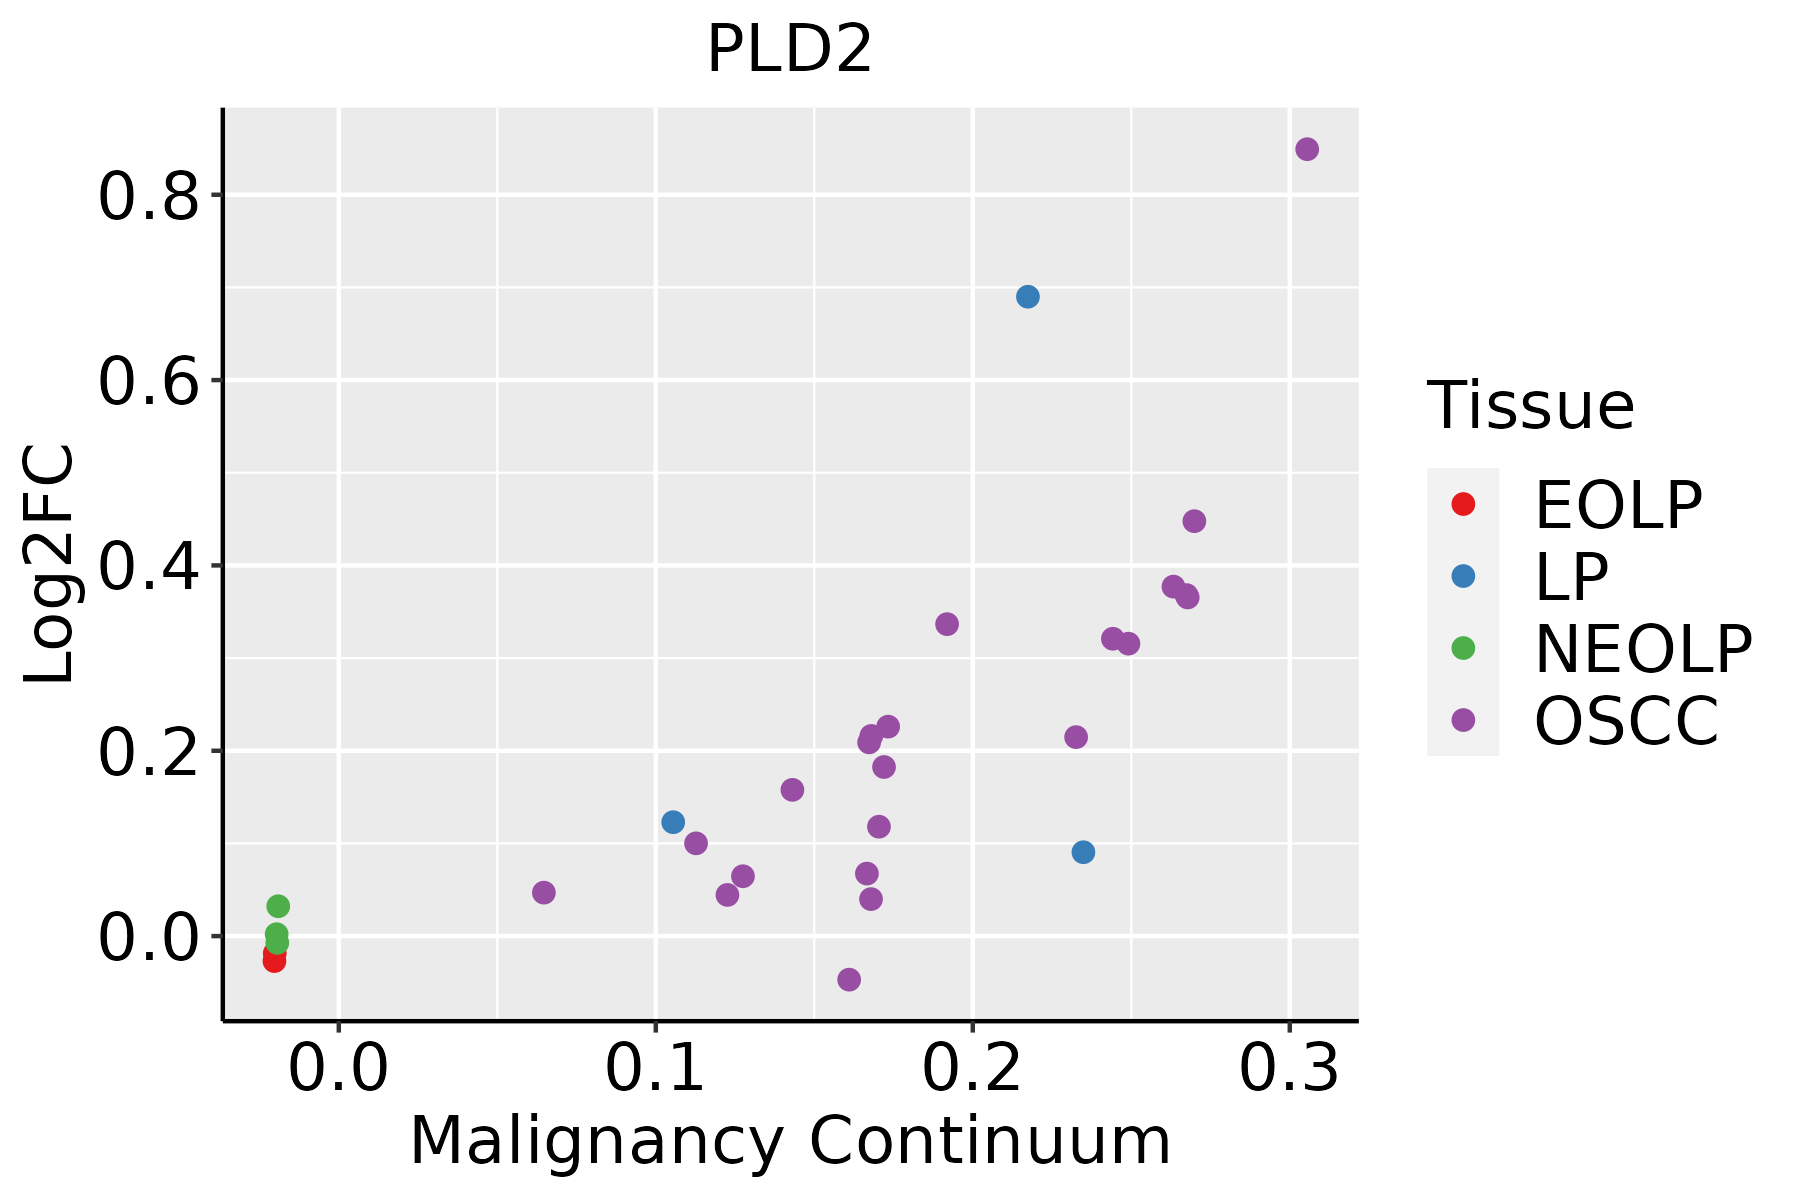 | EOLP: Erosive Oral lichen planus |
| LP: leukoplakia | ||
| NEOLP: Non-erosive oral lichen planus | ||
| OSCC: Oral squamous cell carcinoma |
| ∗log2FC in expression of this searched gene in stem-like cells from each diseased tissue sample relative to stem-like cells in normal samples in each tissue plotted against the malignancy continuum. Samples are colored based on if they are from different disease stage. |
Top |
Malignant transformation related pathway analysis |
| Find out the enriched GO biological processes and KEGG pathways involved in transition from healthy to precancer to cancer |
| Tissue | Disease Stage | Enriched GO biological Processes |
| Colorectum | AD |  |
| Colorectum | SER |  |
| Colorectum | MSS |  |
| Colorectum | MSI-H |  |
| Colorectum | FAP |  |
| ∗Top 15 enriched GO BP terms are showed in the bar plot of each disease state in each tissue. Each row represents a significant GO biological process which is colored according to the -log10(p.adjust). |
| Page: 1 2 3 4 5 6 7 8 9 |
| GO ID | Tissue | Disease Stage | Description | Gene Ratio | Bg Ratio | pvalue | p.adjust | Count |
| GO:00086544 | Esophagus | ESCC | phospholipid biosynthetic process | 162/8552 | 253/18723 | 2.59e-09 | 5.73e-08 | 162 |
| GO:00464744 | Esophagus | ESCC | glycerophospholipid biosynthetic process | 135/8552 | 211/18723 | 5.75e-08 | 1.02e-06 | 135 |
| GO:00450175 | Esophagus | ESCC | glycerolipid biosynthetic process | 154/8552 | 252/18723 | 5.20e-07 | 6.96e-06 | 154 |
| GO:00066446 | Esophagus | ESCC | phospholipid metabolic process | 218/8552 | 383/18723 | 5.37e-06 | 5.59e-05 | 218 |
| GO:00066505 | Esophagus | ESCC | glycerophospholipid metabolic process | 174/8552 | 306/18723 | 4.92e-05 | 3.85e-04 | 174 |
| GO:00066541 | Esophagus | ESCC | phosphatidic acid biosynthetic process | 26/8552 | 33/18723 | 1.06e-04 | 7.43e-04 | 26 |
| GO:00464733 | Esophagus | ESCC | phosphatidic acid metabolic process | 28/8552 | 37/18723 | 2.00e-04 | 1.26e-03 | 28 |
| GO:00464864 | Esophagus | ESCC | glycerolipid metabolic process | 211/8552 | 392/18723 | 6.51e-04 | 3.46e-03 | 211 |
| GO:00160427 | Esophagus | ESCC | lipid catabolic process | 168/8552 | 320/18723 | 7.97e-03 | 2.84e-02 | 168 |
| GO:00086543 | Oral cavity | OSCC | phospholipid biosynthetic process | 130/7305 | 253/18723 | 3.96e-05 | 3.46e-04 | 130 |
| GO:00303238 | Oral cavity | OSCC | respiratory tube development | 95/7305 | 181/18723 | 1.53e-04 | 1.07e-03 | 95 |
| GO:00301983 | Oral cavity | OSCC | extracellular matrix organization | 146/7305 | 301/18723 | 4.67e-04 | 2.77e-03 | 146 |
| GO:00303248 | Oral cavity | OSCC | lung development | 91/7305 | 177/18723 | 5.18e-04 | 3.01e-03 | 91 |
| GO:00452293 | Oral cavity | OSCC | external encapsulating structure organization | 147/7305 | 304/18723 | 5.30e-04 | 3.08e-03 | 147 |
| GO:00430623 | Oral cavity | OSCC | extracellular structure organization | 146/7305 | 302/18723 | 5.59e-04 | 3.23e-03 | 146 |
| GO:0060324 | Oral cavity | OSCC | face development | 28/7305 | 44/18723 | 8.15e-04 | 4.35e-03 | 28 |
| GO:00605416 | Oral cavity | OSCC | respiratory system development | 100/7305 | 203/18723 | 1.83e-03 | 8.60e-03 | 100 |
| GO:00380942 | Oral cavity | OSCC | Fc-gamma receptor signaling pathway | 19/7305 | 28/18723 | 1.88e-03 | 8.84e-03 | 19 |
| GO:00027646 | Oral cavity | OSCC | immune response-regulating signaling pathway | 212/7305 | 468/18723 | 2.93e-03 | 1.27e-02 | 212 |
| GO:00024333 | Oral cavity | OSCC | immune response-regulating cell surface receptor signaling pathway involved in phagocytosis | 18/7305 | 27/18723 | 3.34e-03 | 1.42e-02 | 18 |
| Page: 1 2 3 |
| Pathway ID | Tissue | Disease Stage | Description | Gene Ratio | Bg Ratio | pvalue | p.adjust | qvalue | Count |
| hsa04144210 | Esophagus | ESCC | Endocytosis | 186/4205 | 251/8465 | 9.74e-16 | 4.66e-14 | 2.39e-14 | 186 |
| hsa05208211 | Esophagus | ESCC | Chemical carcinogenesis - reactive oxygen species | 168/4205 | 223/8465 | 1.83e-15 | 6.81e-14 | 3.49e-14 | 168 |
| hsa0521216 | Esophagus | ESCC | Pancreatic cancer | 62/4205 | 76/8465 | 7.37e-09 | 6.85e-08 | 3.51e-08 | 62 |
| hsa0407116 | Esophagus | ESCC | Sphingolipid signaling pathway | 85/4205 | 121/8465 | 3.04e-06 | 1.73e-05 | 8.84e-06 | 85 |
| hsa0466620 | Esophagus | ESCC | Fc gamma R-mediated phagocytosis | 63/4205 | 97/8465 | 1.63e-03 | 4.89e-03 | 2.50e-03 | 63 |
| hsa0492816 | Esophagus | ESCC | Parathyroid hormone synthesis, secretion and action | 66/4205 | 106/8465 | 5.86e-03 | 1.47e-02 | 7.51e-03 | 66 |
| hsa052319 | Esophagus | ESCC | Choline metabolism in cancer | 61/4205 | 98/8465 | 7.97e-03 | 1.92e-02 | 9.84e-03 | 61 |
| hsa0414437 | Esophagus | ESCC | Endocytosis | 186/4205 | 251/8465 | 9.74e-16 | 4.66e-14 | 2.39e-14 | 186 |
| hsa05208310 | Esophagus | ESCC | Chemical carcinogenesis - reactive oxygen species | 168/4205 | 223/8465 | 1.83e-15 | 6.81e-14 | 3.49e-14 | 168 |
| hsa0521217 | Esophagus | ESCC | Pancreatic cancer | 62/4205 | 76/8465 | 7.37e-09 | 6.85e-08 | 3.51e-08 | 62 |
| hsa0407117 | Esophagus | ESCC | Sphingolipid signaling pathway | 85/4205 | 121/8465 | 3.04e-06 | 1.73e-05 | 8.84e-06 | 85 |
| hsa04666110 | Esophagus | ESCC | Fc gamma R-mediated phagocytosis | 63/4205 | 97/8465 | 1.63e-03 | 4.89e-03 | 2.50e-03 | 63 |
| hsa0492817 | Esophagus | ESCC | Parathyroid hormone synthesis, secretion and action | 66/4205 | 106/8465 | 5.86e-03 | 1.47e-02 | 7.51e-03 | 66 |
| hsa0523114 | Esophagus | ESCC | Choline metabolism in cancer | 61/4205 | 98/8465 | 7.97e-03 | 1.92e-02 | 9.84e-03 | 61 |
| hsa0414427 | Oral cavity | OSCC | Endocytosis | 174/3704 | 251/8465 | 9.42e-17 | 4.51e-15 | 2.29e-15 | 174 |
| hsa0520830 | Oral cavity | OSCC | Chemical carcinogenesis - reactive oxygen species | 150/3704 | 223/8465 | 6.45e-13 | 1.20e-11 | 6.11e-12 | 150 |
| hsa0521210 | Oral cavity | OSCC | Pancreatic cancer | 60/3704 | 76/8465 | 3.32e-10 | 4.45e-09 | 2.26e-09 | 60 |
| hsa0407114 | Oral cavity | OSCC | Sphingolipid signaling pathway | 82/3704 | 121/8465 | 6.97e-08 | 5.08e-07 | 2.58e-07 | 82 |
| hsa0466618 | Oral cavity | OSCC | Fc gamma R-mediated phagocytosis | 60/3704 | 97/8465 | 2.35e-04 | 7.72e-04 | 3.93e-04 | 60 |
| hsa04144112 | Oral cavity | OSCC | Endocytosis | 174/3704 | 251/8465 | 9.42e-17 | 4.51e-15 | 2.29e-15 | 174 |
| Page: 1 2 |
Top |
Cell-cell communication analysis |
| Identification of potential cell-cell interactions between two cell types and their ligand-receptor pairs for different disease states |
| Ligand | Receptor | LRpair | Pathway | Tissue | Disease Stage |
| Page: 1 |
Top |
Single-cell gene regulatory network inference analysis |
| Find out the significant the regulons (TFs) and the target genes of each regulon across cell types for different disease states |
| TF | Cell Type | Tissue | Disease Stage | Target Gene | RSS | Regulon Activity |
| ∗The dot plots of a searched regulon are shown for all cell subpopulations in each disease state of each tissue based on the regulon specific score inferred using pySCENIC and by calculating the average expression. |
| Page: 1 |
Top |
Somatic mutation of malignant transformation related genes |
| Annotation of somatic variants for genes involved in malignant transformation |
| Hugo Symbol | Variant Class | Variant Classification | dbSNP RS | HGVSc | HGVSp | HGVSp Short | SWISSPROT | BIOTYPE | SIFT | PolyPhen | Tumor Sample Barcode | Tissue | Histology | Sex | Age | Stage | Therapy Types | Drugs | Outcome |
| PLD2 | SNV | Missense_Mutation | rs747873909 | c.2134C>T | p.Arg712Cys | p.R712C | O14939 | protein_coding | deleterious(0) | probably_damaging(0.999) | TCGA-A2-A0YT-01 | Breast | breast invasive carcinoma | Female | <65 | III/IV | Hormone Therapy | arimidex | SD |
| PLD2 | SNV | Missense_Mutation | novel | c.2577N>T | p.Gln859His | p.Q859H | O14939 | protein_coding | deleterious(0) | benign(0.109) | TCGA-VS-A94Z-01 | Cervix | cervical & endocervical cancer | Female | <65 | I/II | Chemotherapy | cisplatin | CR |
| PLD2 | SNV | Missense_Mutation | rs386352350 | c.1657C>T | p.Arg553Trp | p.R553W | O14939 | protein_coding | deleterious(0) | probably_damaging(0.995) | TCGA-VS-A9U6-01 | Cervix | cervical & endocervical cancer | Female | <65 | I/II | Chemotherapy | cisplatin | PD |
| PLD2 | SNV | Missense_Mutation | c.1405N>T | p.His469Tyr | p.H469Y | O14939 | protein_coding | deleterious(0.01) | benign(0) | TCGA-A6-3809-01 | Colorectum | colon adenocarcinoma | Female | >=65 | I/II | Unknown | Unknown | SD | |
| PLD2 | SNV | Missense_Mutation | rs200449808 | c.1120N>T | p.Arg374Cys | p.R374C | O14939 | protein_coding | deleterious(0) | probably_damaging(1) | TCGA-A6-A56B-01 | Colorectum | colon adenocarcinoma | Male | <65 | III/IV | Chemotherapy | fluorouracil | PD |
| PLD2 | SNV | Missense_Mutation | c.701N>T | p.Ser234Phe | p.S234F | O14939 | protein_coding | deleterious(0) | probably_damaging(0.944) | TCGA-AA-3492-01 | Colorectum | colon adenocarcinoma | Female | >=65 | I/II | Unknown | Unknown | SD | |
| PLD2 | SNV | Missense_Mutation | rs763007494 | c.1154N>C | p.Ile385Thr | p.I385T | O14939 | protein_coding | tolerated(0.4) | benign(0.003) | TCGA-AA-3492-01 | Colorectum | colon adenocarcinoma | Female | >=65 | I/II | Unknown | Unknown | SD |
| PLD2 | SNV | Missense_Mutation | c.1754N>A | p.Ser585Tyr | p.S585Y | O14939 | protein_coding | deleterious(0) | probably_damaging(0.929) | TCGA-AA-3812-01 | Colorectum | colon adenocarcinoma | Female | >=65 | I/II | Unknown | Unknown | PD | |
| PLD2 | SNV | Missense_Mutation | rs201356383 | c.2609G>A | p.Arg870His | p.R870H | O14939 | protein_coding | tolerated(0.38) | benign(0.015) | TCGA-AU-6004-01 | Colorectum | colon adenocarcinoma | Female | >=65 | I/II | Unknown | Unknown | SD |
| PLD2 | SNV | Missense_Mutation | novel | c.26N>C | p.Phe9Ser | p.F9S | O14939 | protein_coding | deleterious_low_confidence(0.01) | possibly_damaging(0.795) | TCGA-AY-A71X-01 | Colorectum | colon adenocarcinoma | Female | <65 | I/II | Unknown | Unknown | SD |
| Page: 1 2 3 4 5 6 7 8 |
Top |
Related drugs of malignant transformation related genes |
| Identification of chemicals and drugs interact with genes involved in malignant transfromation |
| (DGIdb 4.0) |
| Entrez ID | Symbol | Category | Interaction Types | Drug Claim Name | Drug Name | PMIDs |
| 5338 | PLD2 | ENZYME, DRUGGABLE GENOME | TAMOXIFEN | TAMOXIFEN | 19136975 | |
| 5338 | PLD2 | ENZYME, DRUGGABLE GENOME | VU0364739 | |||
| 5338 | PLD2 | ENZYME, DRUGGABLE GENOME | activator | 135651531 | ||
| 5338 | PLD2 | ENZYME, DRUGGABLE GENOME | inhibitor | 178101970 | ||
| 5338 | PLD2 | ENZYME, DRUGGABLE GENOME | inhibitor | 252827440 | ||
| 5338 | PLD2 | ENZYME, DRUGGABLE GENOME | inhibitor | 252827439 | ||
| 5338 | PLD2 | ENZYME, DRUGGABLE GENOME | activator | 135651544 | ||
| 5338 | PLD2 | ENZYME, DRUGGABLE GENOME | activator | 178101987 | ||
| 5338 | PLD2 | ENZYME, DRUGGABLE GENOME | HALOPEMIDE | HALOPEMIDE |
| Page: 1 |

Copyright 2023-Present -The University of Texas Health Science Center at Houston |