
|
|||||
|
 | |
| |
| |
| |
| |
| |
|
Gene: PLCXD2 |
Gene summary for PLCXD2 |
| Gene information | Species | Human | Gene symbol | PLCXD2 | Gene ID | 257068 |
| Gene name | phosphatidylinositol specific phospholipase C X domain containing 2 | |
| Gene Alias | PLCXD2 | |
| Cytomap | 3q13.2 | |
| Gene Type | protein-coding | GO ID | GO:0006629 | UniProtAcc | Q0VAA5 |
Top |
Malignant transformation analysis |
| Identification of the aberrant gene expression in precancerous and cancerous lesions by comparing the gene expression of stem-like cells in diseased tissues with normal stem cells |
| Entrez ID | Symbol | Replicates | Species | Organ | Tissue | Adj P-value | Log2FC | Malignancy |
| 257068 | PLCXD2 | LZE4T | Human | Esophagus | ESCC | 6.76e-43 | 1.48e+00 | 0.0811 |
| 257068 | PLCXD2 | LZE20T | Human | Esophagus | ESCC | 1.10e-04 | 1.86e-01 | 0.0662 |
| 257068 | PLCXD2 | P1T-E | Human | Esophagus | ESCC | 5.63e-07 | 5.10e-01 | 0.0875 |
| 257068 | PLCXD2 | P8T-E | Human | Esophagus | ESCC | 1.16e-02 | 1.36e-01 | 0.0889 |
| 257068 | PLCXD2 | P11T-E | Human | Esophagus | ESCC | 1.50e-14 | 3.78e-01 | 0.1426 |
| 257068 | PLCXD2 | P20T-E | Human | Esophagus | ESCC | 5.32e-10 | 2.38e-01 | 0.1124 |
| 257068 | PLCXD2 | P22T-E | Human | Esophagus | ESCC | 3.20e-07 | 2.42e-01 | 0.1236 |
| 257068 | PLCXD2 | P26T-E | Human | Esophagus | ESCC | 4.96e-23 | 4.96e-01 | 0.1276 |
| 257068 | PLCXD2 | P28T-E | Human | Esophagus | ESCC | 7.04e-23 | 7.33e-01 | 0.1149 |
| 257068 | PLCXD2 | P30T-E | Human | Esophagus | ESCC | 1.33e-25 | 8.85e-01 | 0.137 |
| 257068 | PLCXD2 | P32T-E | Human | Esophagus | ESCC | 9.73e-08 | 4.41e-01 | 0.1666 |
| 257068 | PLCXD2 | P39T-E | Human | Esophagus | ESCC | 2.11e-02 | 2.22e-02 | 0.0894 |
| 257068 | PLCXD2 | P42T-E | Human | Esophagus | ESCC | 3.29e-04 | 4.23e-02 | 0.1175 |
| 257068 | PLCXD2 | P47T-E | Human | Esophagus | ESCC | 3.54e-12 | 2.54e-01 | 0.1067 |
| 257068 | PLCXD2 | P48T-E | Human | Esophagus | ESCC | 2.43e-03 | 6.64e-03 | 0.0959 |
| 257068 | PLCXD2 | P52T-E | Human | Esophagus | ESCC | 6.11e-07 | 3.92e-01 | 0.1555 |
| 257068 | PLCXD2 | P54T-E | Human | Esophagus | ESCC | 3.68e-08 | 2.60e-01 | 0.0975 |
| 257068 | PLCXD2 | P61T-E | Human | Esophagus | ESCC | 1.88e-03 | 1.14e-01 | 0.099 |
| 257068 | PLCXD2 | P62T-E | Human | Esophagus | ESCC | 5.77e-09 | 2.37e-01 | 0.1302 |
| 257068 | PLCXD2 | P65T-E | Human | Esophagus | ESCC | 1.26e-07 | 8.49e-02 | 0.0978 |
| Page: 1 2 3 |
| Tissue | Expression Dynamics | Abbreviation |
| Esophagus |  | ESCC: Esophageal squamous cell carcinoma |
| HGIN: High-grade intraepithelial neoplasias | ||
| LGIN: Low-grade intraepithelial neoplasias | ||
| Liver |  | HCC: Hepatocellular carcinoma |
| NAFLD: Non-alcoholic fatty liver disease | ||
| Oral Cavity | 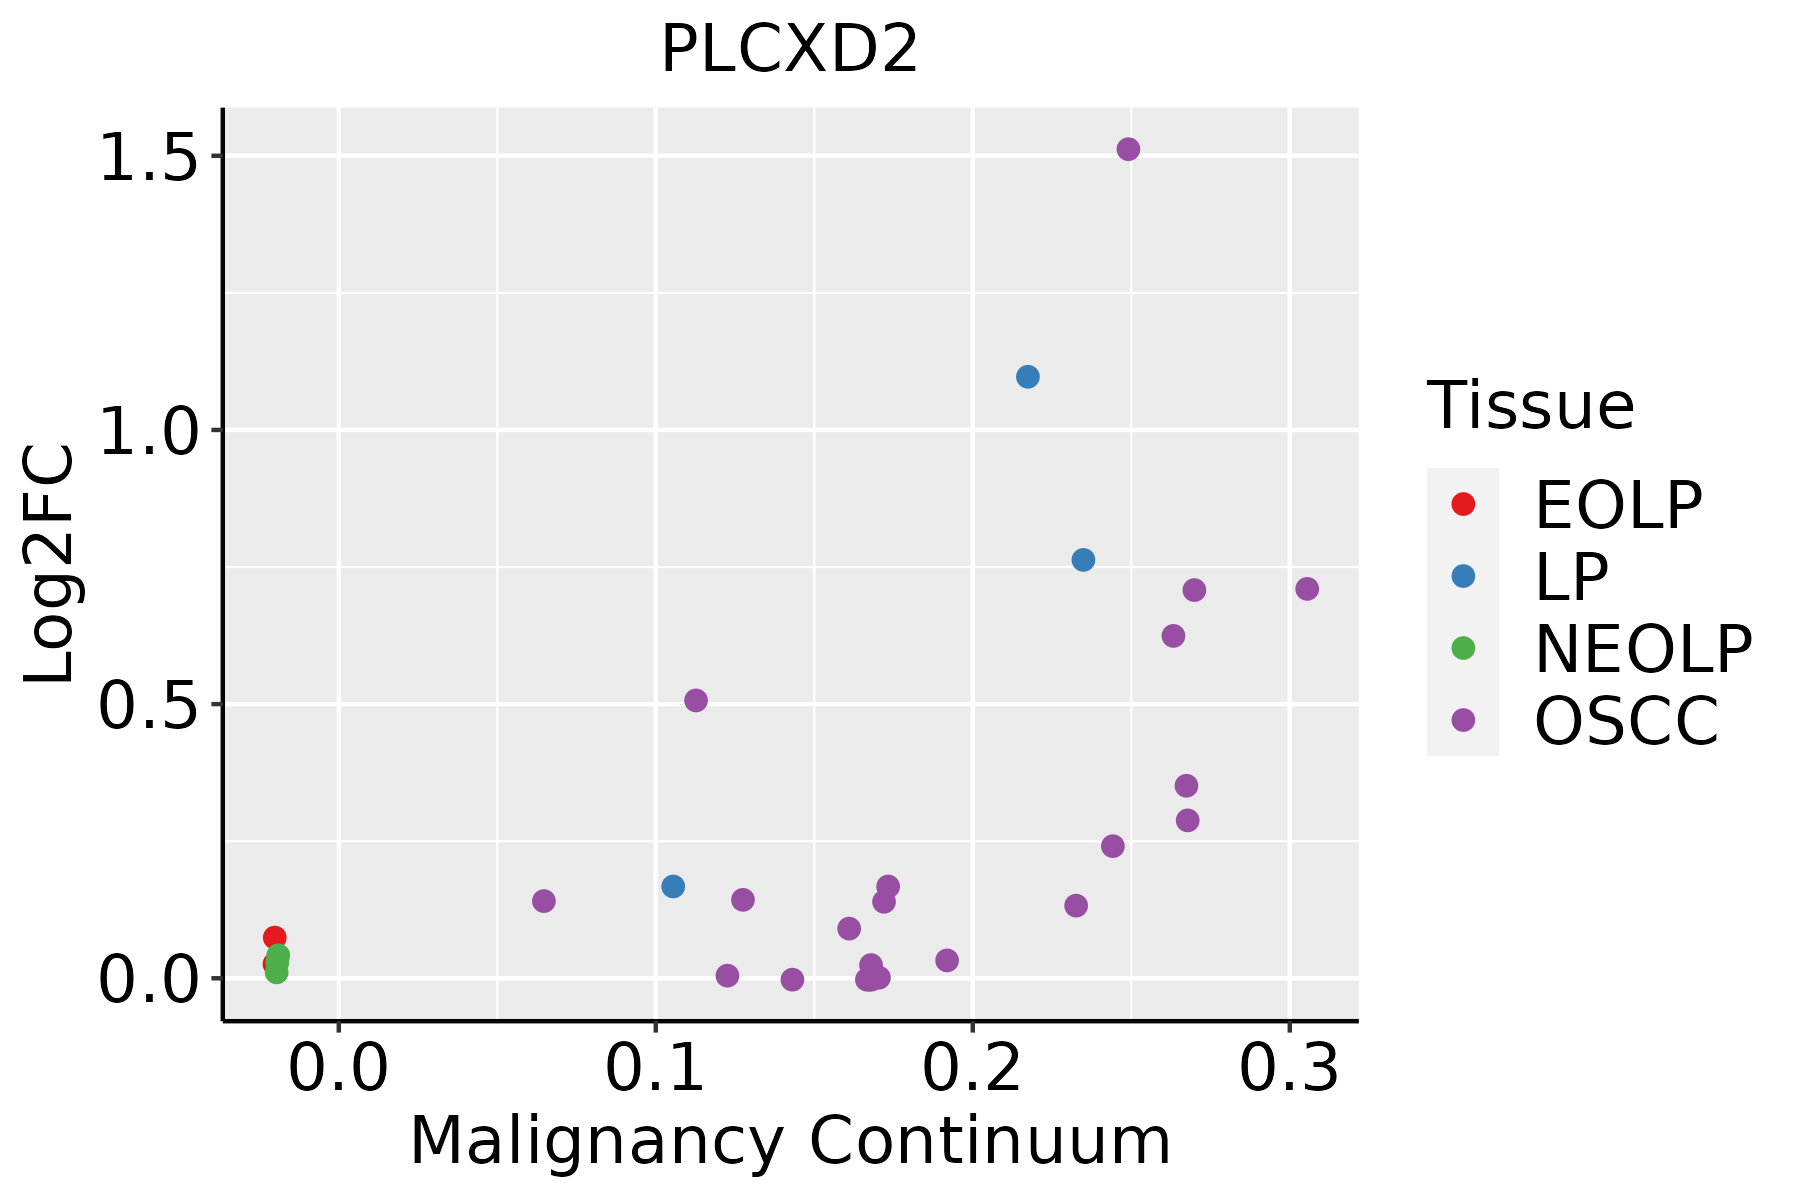 | EOLP: Erosive Oral lichen planus |
| LP: leukoplakia | ||
| NEOLP: Non-erosive oral lichen planus | ||
| OSCC: Oral squamous cell carcinoma |
| ∗log2FC in expression of this searched gene in stem-like cells from each diseased tissue sample relative to stem-like cells in normal samples in each tissue plotted against the malignancy continuum. Samples are colored based on if they are from different disease stage. |
Top |
Malignant transformation related pathway analysis |
| Find out the enriched GO biological processes and KEGG pathways involved in transition from healthy to precancer to cancer |
| Tissue | Disease Stage | Enriched GO biological Processes |
| Colorectum | AD |  |
| Colorectum | SER |  |
| Colorectum | MSS |  |
| Colorectum | MSI-H |  |
| Colorectum | FAP |  |
| ∗Top 15 enriched GO BP terms are showed in the bar plot of each disease state in each tissue. Each row represents a significant GO biological process which is colored according to the -log10(p.adjust). |
| Page: 1 2 3 4 5 6 7 8 9 |
| GO ID | Tissue | Disease Stage | Description | Gene Ratio | Bg Ratio | pvalue | p.adjust | Count |
| GO:00160427 | Esophagus | ESCC | lipid catabolic process | 168/8552 | 320/18723 | 7.97e-03 | 2.84e-02 | 168 |
| GO:001604212 | Liver | Cirrhotic | lipid catabolic process | 112/4634 | 320/18723 | 2.31e-05 | 3.03e-04 | 112 |
| GO:001604221 | Liver | HCC | lipid catabolic process | 175/7958 | 320/18723 | 6.50e-06 | 7.88e-05 | 175 |
| Page: 1 |
| Pathway ID | Tissue | Disease Stage | Description | Gene Ratio | Bg Ratio | pvalue | p.adjust | qvalue | Count |
| Page: 1 |
Top |
Cell-cell communication analysis |
| Identification of potential cell-cell interactions between two cell types and their ligand-receptor pairs for different disease states |
| Ligand | Receptor | LRpair | Pathway | Tissue | Disease Stage |
| Page: 1 |
Top |
Single-cell gene regulatory network inference analysis |
| Find out the significant the regulons (TFs) and the target genes of each regulon across cell types for different disease states |
| TF | Cell Type | Tissue | Disease Stage | Target Gene | RSS | Regulon Activity |
| ∗The dot plots of a searched regulon are shown for all cell subpopulations in each disease state of each tissue based on the regulon specific score inferred using pySCENIC and by calculating the average expression. |
| Page: 1 |
Top |
Somatic mutation of malignant transformation related genes |
| Annotation of somatic variants for genes involved in malignant transformation |
| Hugo Symbol | Variant Class | Variant Classification | dbSNP RS | HGVSc | HGVSp | HGVSp Short | SWISSPROT | BIOTYPE | SIFT | PolyPhen | Tumor Sample Barcode | Tissue | Histology | Sex | Age | Stage | Therapy Types | Drugs | Outcome |
| PLCXD2 | SNV | Missense_Mutation | novel | c.830N>T | p.Gly277Val | p.G277V | Q0VAA5 | protein_coding | deleterious(0.01) | probably_damaging(0.999) | TCGA-A2-A0T2-01 | Breast | breast invasive carcinoma | Female | >=65 | III/IV | Chemotherapy | xeloda | PD |
| PLCXD2 | SNV | Missense_Mutation | rs142045095 | c.761N>A | p.Arg254Gln | p.R254Q | Q0VAA5 | protein_coding | deleterious(0.01) | probably_damaging(0.992) | TCGA-A7-A56D-01 | Breast | breast invasive carcinoma | Female | >=65 | I/II | Hormone Therapy | arimidex | SD |
| PLCXD2 | SNV | Missense_Mutation | rs527314934 | c.769N>T | p.Arg257Trp | p.R257W | Q0VAA5 | protein_coding | deleterious(0.04) | benign(0.153) | TCGA-A8-A09T-01 | Breast | breast invasive carcinoma | Female | >=65 | I/II | Hormone Therapy | anastrozole | SD |
| PLCXD2 | SNV | Missense_Mutation | c.24N>T | p.Arg8Ser | p.R8S | Q0VAA5 | protein_coding | tolerated_low_confidence(0.06) | benign(0.04) | TCGA-AR-A1AO-01 | Breast | breast invasive carcinoma | Female | <65 | I/II | Chemotherapy | doxorubicin | SD | |
| PLCXD2 | SNV | Missense_Mutation | c.797N>C | p.Ile266Thr | p.I266T | Q0VAA5 | protein_coding | deleterious(0) | probably_damaging(0.991) | TCGA-D8-A1XK-01 | Breast | breast invasive carcinoma | Female | <65 | I/II | Chemotherapy | doxorubicine+cyclophosphamide | SD | |
| PLCXD2 | SNV | Missense_Mutation | novel | c.405N>G | p.Phe135Leu | p.F135L | Q0VAA5 | protein_coding | deleterious(0.01) | possibly_damaging(0.622) | TCGA-D8-A27R-01 | Breast | breast invasive carcinoma | Female | <65 | III/IV | Chemotherapy | adriamycin+cyclophosphamide | SD |
| PLCXD2 | SNV | Missense_Mutation | rs776985841 | c.722N>A | p.Arg241His | p.R241H | Q0VAA5 | protein_coding | tolerated(0.29) | benign(0) | TCGA-E2-A1II-01 | Breast | breast invasive carcinoma | Female | <65 | I/II | Chemotherapy | doxorubicin | SD |
| PLCXD2 | SNV | Missense_Mutation | c.721C>T | p.Arg241Cys | p.R241C | Q0VAA5 | protein_coding | deleterious(0.04) | benign(0) | TCGA-OL-A66K-01 | Breast | breast invasive carcinoma | Female | >=65 | I/II | Unknown | Unknown | SD | |
| PLCXD2 | deletion | Frame_Shift_Del | novel | c.588_589delNN | p.Leu197AspfsTer56 | p.L197Dfs*56 | Q0VAA5 | protein_coding | TCGA-AR-A0U0-01 | Breast | breast invasive carcinoma | Female | >=65 | I/II | Unknown | Unknown | SD | ||
| PLCXD2 | insertion | Frame_Shift_Ins | novel | c.589_590insCAGA | p.Leu197SerfsTer58 | p.L197Sfs*58 | Q0VAA5 | protein_coding | TCGA-AR-A0U0-01 | Breast | breast invasive carcinoma | Female | >=65 | I/II | Unknown | Unknown | SD |
| Page: 1 2 3 4 5 |
Top |
Related drugs of malignant transformation related genes |
| Identification of chemicals and drugs interact with genes involved in malignant transfromation |
| (DGIdb 4.0) |
| Entrez ID | Symbol | Category | Interaction Types | Drug Claim Name | Drug Name | PMIDs |
| Page: 1 |

Copyright 2023-Present -The University of Texas Health Science Center at Houston |