
|
|||||
|
 | |
| |
| |
| |
| |
| |
|
Gene: PLCH2 |
Gene summary for PLCH2 |
| Gene information | Species | Human | Gene symbol | PLCH2 | Gene ID | 9651 |
| Gene name | phospholipase C eta 2 | |
| Gene Alias | PLC-L4 | |
| Cytomap | 1p36.32 | |
| Gene Type | protein-coding | GO ID | GO:0006629 | UniProtAcc | O75038 |
Top |
Malignant transformation analysis |
| Identification of the aberrant gene expression in precancerous and cancerous lesions by comparing the gene expression of stem-like cells in diseased tissues with normal stem cells |
| Entrez ID | Symbol | Replicates | Species | Organ | Tissue | Adj P-value | Log2FC | Malignancy |
| 9651 | PLCH2 | C04 | Human | Oral cavity | OSCC | 1.67e-07 | 3.36e-01 | 0.2633 |
| 9651 | PLCH2 | C21 | Human | Oral cavity | OSCC | 4.86e-12 | 3.46e-01 | 0.2678 |
| 9651 | PLCH2 | C30 | Human | Oral cavity | OSCC | 1.12e-28 | 1.04e+00 | 0.3055 |
| 9651 | PLCH2 | C38 | Human | Oral cavity | OSCC | 8.63e-05 | 4.45e-01 | 0.172 |
| 9651 | PLCH2 | C43 | Human | Oral cavity | OSCC | 7.46e-20 | 4.21e-01 | 0.1704 |
| 9651 | PLCH2 | C46 | Human | Oral cavity | OSCC | 1.48e-09 | 2.37e-01 | 0.1673 |
| 9651 | PLCH2 | C51 | Human | Oral cavity | OSCC | 1.61e-03 | 2.71e-01 | 0.2674 |
| 9651 | PLCH2 | C09 | Human | Oral cavity | OSCC | 2.91e-12 | 3.40e-01 | 0.1431 |
| 9651 | PLCH2 | LN22 | Human | Oral cavity | OSCC | 3.01e-02 | 3.03e-01 | 0.1733 |
| 9651 | PLCH2 | LN46 | Human | Oral cavity | OSCC | 2.64e-05 | 2.57e-01 | 0.1666 |
| 9651 | PLCH2 | LP15 | Human | Oral cavity | LP | 1.44e-03 | 6.76e-01 | 0.2174 |
| 9651 | PLCH2 | SYSMH2 | Human | Oral cavity | OSCC | 7.25e-05 | 1.53e-01 | 0.2326 |
| 9651 | PLCH2 | SYSMH3 | Human | Oral cavity | OSCC | 2.19e-27 | 5.45e-01 | 0.2442 |
| 9651 | PLCH2 | SYSMH4 | Human | Oral cavity | OSCC | 3.27e-02 | 1.32e-01 | 0.1226 |
| 9651 | PLCH2 | SYSMH5 | Human | Oral cavity | OSCC | 1.56e-05 | 1.81e-01 | 0.0647 |
| Page: 1 |
| Tissue | Expression Dynamics | Abbreviation |
| Oral Cavity | 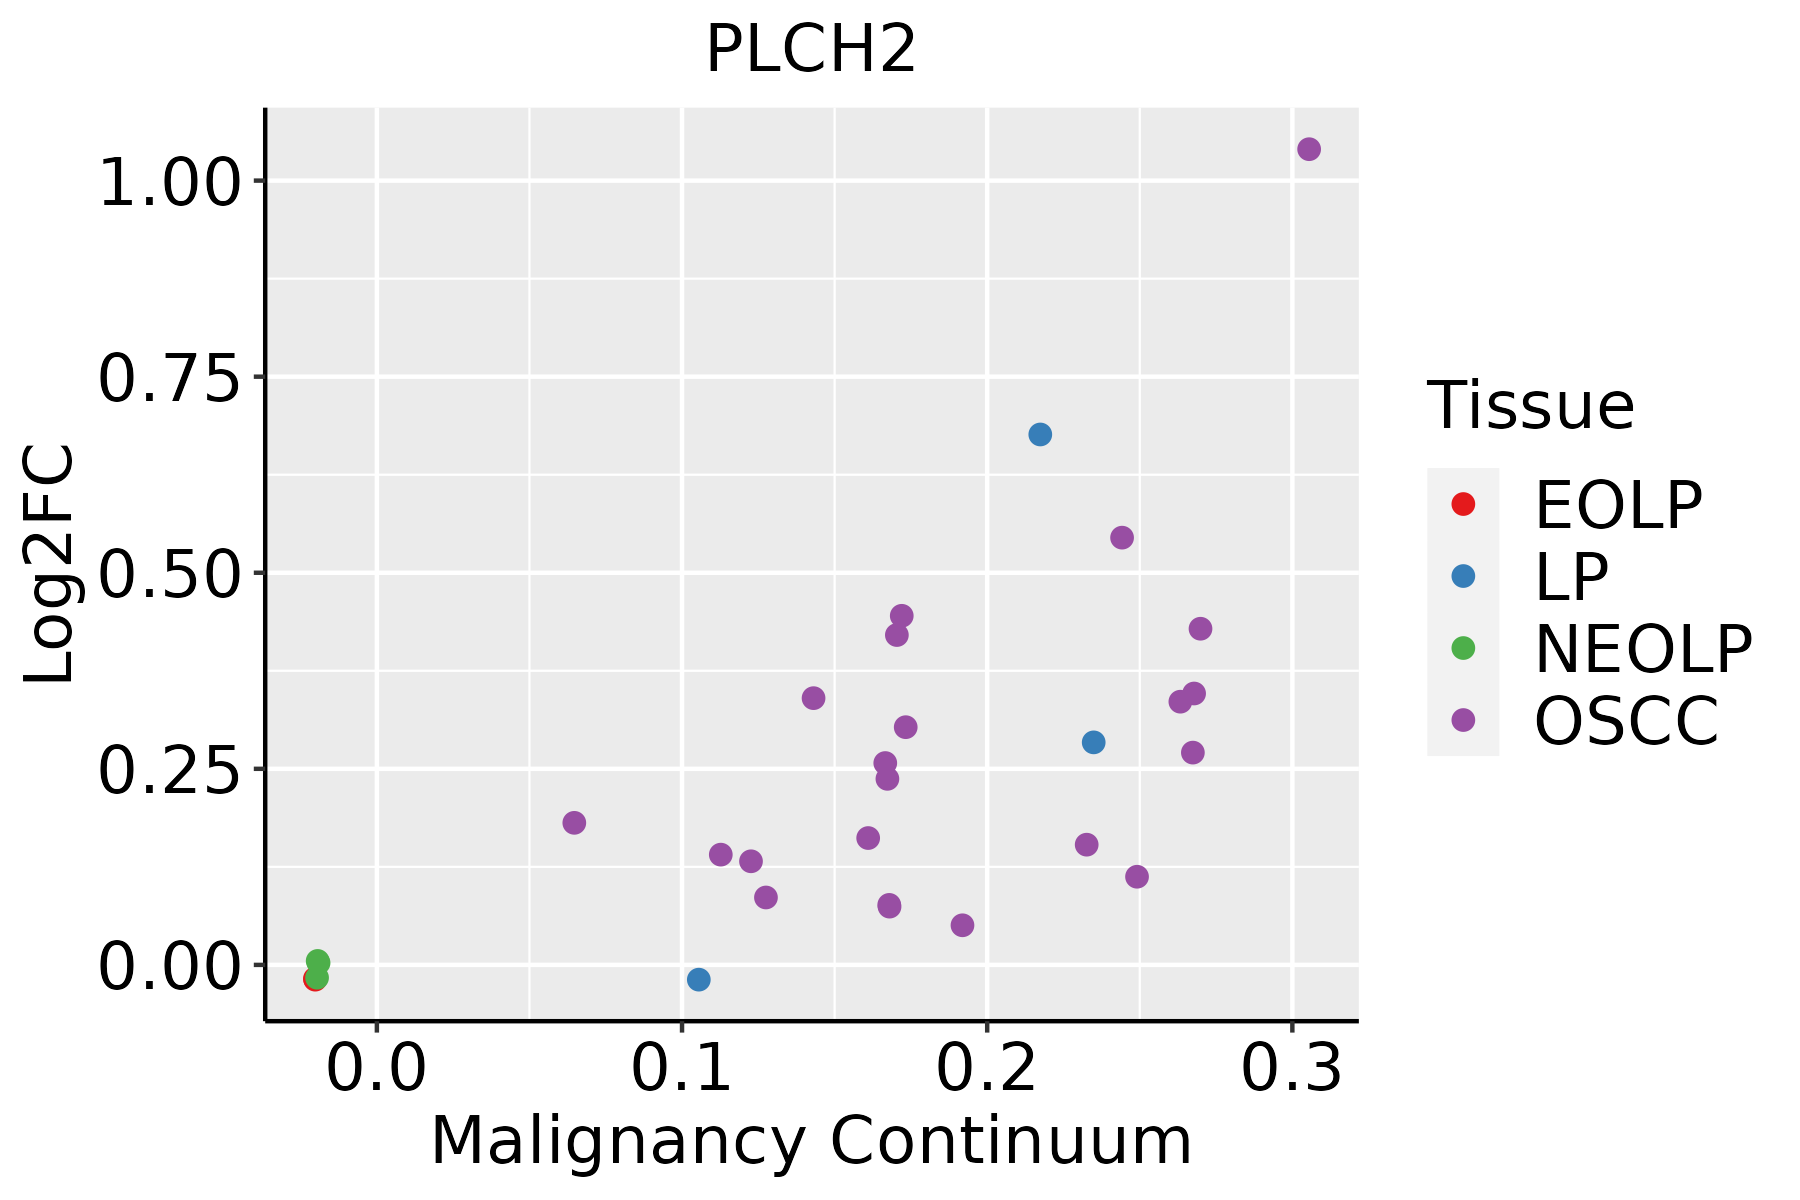 | EOLP: Erosive Oral lichen planus |
| LP: leukoplakia | ||
| NEOLP: Non-erosive oral lichen planus | ||
| OSCC: Oral squamous cell carcinoma |
| ∗log2FC in expression of this searched gene in stem-like cells from each diseased tissue sample relative to stem-like cells in normal samples in each tissue plotted against the malignancy continuum. Samples are colored based on if they are from different disease stage. |
Top |
Malignant transformation related pathway analysis |
| Find out the enriched GO biological processes and KEGG pathways involved in transition from healthy to precancer to cancer |
| Tissue | Disease Stage | Enriched GO biological Processes |
| Colorectum | AD |  |
| Colorectum | SER |  |
| Colorectum | MSS |  |
| Colorectum | MSI-H |  |
| Colorectum | FAP |  |
| ∗Top 15 enriched GO BP terms are showed in the bar plot of each disease state in each tissue. Each row represents a significant GO biological process which is colored according to the -log10(p.adjust). |
| Page: 1 2 3 4 5 6 7 8 9 |
| GO ID | Tissue | Disease Stage | Description | Gene Ratio | Bg Ratio | pvalue | p.adjust | Count |
| GO:00066445 | Oral cavity | OSCC | phospholipid metabolic process | 175/7305 | 383/18723 | 4.21e-03 | 1.71e-02 | 175 |
| Page: 1 |
| Pathway ID | Tissue | Disease Stage | Description | Gene Ratio | Bg Ratio | pvalue | p.adjust | qvalue | Count |
| Page: 1 |
Top |
Cell-cell communication analysis |
| Identification of potential cell-cell interactions between two cell types and their ligand-receptor pairs for different disease states |
| Ligand | Receptor | LRpair | Pathway | Tissue | Disease Stage |
| Page: 1 |
Top |
Single-cell gene regulatory network inference analysis |
| Find out the significant the regulons (TFs) and the target genes of each regulon across cell types for different disease states |
| TF | Cell Type | Tissue | Disease Stage | Target Gene | RSS | Regulon Activity |
| ∗The dot plots of a searched regulon are shown for all cell subpopulations in each disease state of each tissue based on the regulon specific score inferred using pySCENIC and by calculating the average expression. |
| Page: 1 |
Top |
Somatic mutation of malignant transformation related genes |
| Annotation of somatic variants for genes involved in malignant transformation |
| Hugo Symbol | Variant Class | Variant Classification | dbSNP RS | HGVSc | HGVSp | HGVSp Short | SWISSPROT | BIOTYPE | SIFT | PolyPhen | Tumor Sample Barcode | Tissue | Histology | Sex | Age | Stage | Therapy Types | Drugs | Outcome |
| PLCH2 | SNV | Missense_Mutation | novel | c.808N>C | p.Glu270Gln | p.E270Q | O75038 | protein_coding | deleterious(0) | probably_damaging(0.98) | TCGA-A2-A0YK-01 | Breast | breast invasive carcinoma | Female | <65 | I/II | Chemotherapy | cytoxan | SD |
| PLCH2 | SNV | Missense_Mutation | novel | c.298N>C | p.Ser100Arg | p.S100R | O75038 | protein_coding | tolerated(0.32) | benign(0.007) | TCGA-AC-A8OP-01 | Breast | breast invasive carcinoma | Female | >=65 | I/II | Unknown | Unknown | SD |
| PLCH2 | SNV | Missense_Mutation | novel | c.914N>C | p.Phe305Ser | p.F305S | O75038 | protein_coding | deleterious(0) | probably_damaging(0.997) | TCGA-B6-A400-01 | Breast | breast invasive carcinoma | Female | <65 | III/IV | Unknown | Unknown | SD |
| PLCH2 | deletion | Frame_Shift_Del | novel | c.1254delC | p.Ile419SerfsTer17 | p.I419Sfs*17 | O75038 | protein_coding | TCGA-D8-A27V-01 | Breast | breast invasive carcinoma | Female | <65 | I/II | Hormone Therapy | tamoxiphen | SD | ||
| PLCH2 | SNV | Missense_Mutation | rs773994175 | c.1778C>T | p.Ala593Val | p.A593V | O75038 | protein_coding | tolerated(0.56) | benign(0.001) | TCGA-2W-A8YY-01 | Cervix | cervical & endocervical cancer | Female | <65 | I/II | Chemotherapy | cisplatin | CR |
| PLCH2 | SNV | Missense_Mutation | novel | c.2098A>G | p.Asn700Asp | p.N700D | O75038 | protein_coding | deleterious(0) | probably_damaging(0.988) | TCGA-2W-A8YY-01 | Cervix | cervical & endocervical cancer | Female | <65 | I/II | Chemotherapy | cisplatin | CR |
| PLCH2 | SNV | Missense_Mutation | novel | c.3964G>A | p.Gly1322Ser | p.G1322S | O75038 | protein_coding | tolerated_low_confidence(0.66) | benign(0.001) | TCGA-2W-A8YY-01 | Cervix | cervical & endocervical cancer | Female | <65 | I/II | Chemotherapy | cisplatin | CR |
| PLCH2 | SNV | Missense_Mutation | novel | c.1477N>A | p.Asp493Asn | p.D493N | O75038 | protein_coding | deleterious(0.03) | possibly_damaging(0.688) | TCGA-MA-AA3Z-01 | Cervix | cervical & endocervical cancer | Female | <65 | I/II | Unknown | Unknown | SD |
| PLCH2 | SNV | Missense_Mutation | novel | c.3289G>A | p.Glu1097Lys | p.E1097K | O75038 | protein_coding | deleterious_low_confidence(0.03) | possibly_damaging(0.719) | TCGA-MU-A51Y-01 | Cervix | cervical & endocervical cancer | Female | <65 | I/II | Unknown | Unknown | SD |
| PLCH2 | SNV | Missense_Mutation | novel | c.3508N>A | p.Glu1170Lys | p.E1170K | O75038 | protein_coding | tolerated_low_confidence(0.12) | benign(0.018) | TCGA-ZJ-AAXD-01 | Cervix | cervical & endocervical cancer | Female | <65 | III/IV | Unknown | Unknown | SD |
| Page: 1 2 3 4 5 6 7 8 9 10 |
Top |
Related drugs of malignant transformation related genes |
| Identification of chemicals and drugs interact with genes involved in malignant transfromation |
| (DGIdb 4.0) |
| Entrez ID | Symbol | Category | Interaction Types | Drug Claim Name | Drug Name | PMIDs |
| Page: 1 |

Copyright 2023-Present -The University of Texas Health Science Center at Houston |