
|
|||||
|
 | |
| |
| |
| |
| |
| |
|
Gene: PLCH1 |
Gene summary for PLCH1 |
| Gene information | Species | Human | Gene symbol | PLCH1 | Gene ID | 23007 |
| Gene name | phospholipase C eta 1 | |
| Gene Alias | PLC eta 1 | |
| Cytomap | 3q25.31 | |
| Gene Type | protein-coding | GO ID | GO:0006629 | UniProtAcc | Q4KWH8 |
Top |
Malignant transformation analysis |
| Identification of the aberrant gene expression in precancerous and cancerous lesions by comparing the gene expression of stem-like cells in diseased tissues with normal stem cells |
| Entrez ID | Symbol | Replicates | Species | Organ | Tissue | Adj P-value | Log2FC | Malignancy |
| 23007 | PLCH1 | HTA11_3410_2000001011 | Human | Colorectum | AD | 3.32e-12 | -5.10e-01 | 0.0155 |
| 23007 | PLCH1 | HTA11_3361_2000001011 | Human | Colorectum | AD | 5.86e-08 | -6.23e-01 | -0.1207 |
| 23007 | PLCH1 | HTA11_866_3004761011 | Human | Colorectum | AD | 4.15e-04 | -4.02e-01 | 0.096 |
| 23007 | PLCH1 | HTA11_7696_3000711011 | Human | Colorectum | AD | 1.97e-03 | -3.73e-01 | 0.0674 |
| 23007 | PLCH1 | HTA11_99999973899_84307 | Human | Colorectum | MSS | 5.31e-05 | -5.90e-01 | 0.2585 |
| 23007 | PLCH1 | HTA11_99999974143_84620 | Human | Colorectum | MSS | 2.09e-17 | -6.29e-01 | 0.3005 |
| 23007 | PLCH1 | A015-C-203 | Human | Colorectum | FAP | 2.02e-21 | -4.45e-01 | -0.1294 |
| 23007 | PLCH1 | A015-C-204 | Human | Colorectum | FAP | 2.43e-05 | -2.17e-01 | -0.0228 |
| 23007 | PLCH1 | A014-C-040 | Human | Colorectum | FAP | 2.92e-04 | -3.67e-01 | -0.1184 |
| 23007 | PLCH1 | A002-C-201 | Human | Colorectum | FAP | 2.70e-14 | -3.24e-01 | 0.0324 |
| 23007 | PLCH1 | A002-C-203 | Human | Colorectum | FAP | 1.61e-02 | 1.42e-01 | 0.2786 |
| 23007 | PLCH1 | A001-C-119 | Human | Colorectum | FAP | 7.53e-07 | -3.34e-01 | -0.1557 |
| 23007 | PLCH1 | A001-C-108 | Human | Colorectum | FAP | 1.94e-12 | -2.54e-01 | -0.0272 |
| 23007 | PLCH1 | A002-C-205 | Human | Colorectum | FAP | 6.46e-21 | -3.16e-01 | -0.1236 |
| 23007 | PLCH1 | A015-C-005 | Human | Colorectum | FAP | 3.13e-03 | -1.84e-01 | -0.0336 |
| 23007 | PLCH1 | A015-C-006 | Human | Colorectum | FAP | 1.89e-15 | -3.73e-01 | -0.0994 |
| 23007 | PLCH1 | A015-C-106 | Human | Colorectum | FAP | 4.02e-09 | -3.24e-01 | -0.0511 |
| 23007 | PLCH1 | A002-C-114 | Human | Colorectum | FAP | 4.22e-20 | -4.52e-01 | -0.1561 |
| 23007 | PLCH1 | A015-C-104 | Human | Colorectum | FAP | 1.32e-23 | -3.79e-01 | -0.1899 |
| 23007 | PLCH1 | A001-C-014 | Human | Colorectum | FAP | 4.21e-08 | -2.87e-01 | 0.0135 |
| Page: 1 2 3 |
| Tissue | Expression Dynamics | Abbreviation |
| Colorectum (GSE201348) |  | FAP: Familial adenomatous polyposis |
| CRC: Colorectal cancer | ||
| Colorectum (HTA11) |  | AD: Adenomas |
| SER: Sessile serrated lesions | ||
| MSI-H: Microsatellite-high colorectal cancer | ||
| MSS: Microsatellite stable colorectal cancer | ||
| Endometrium | 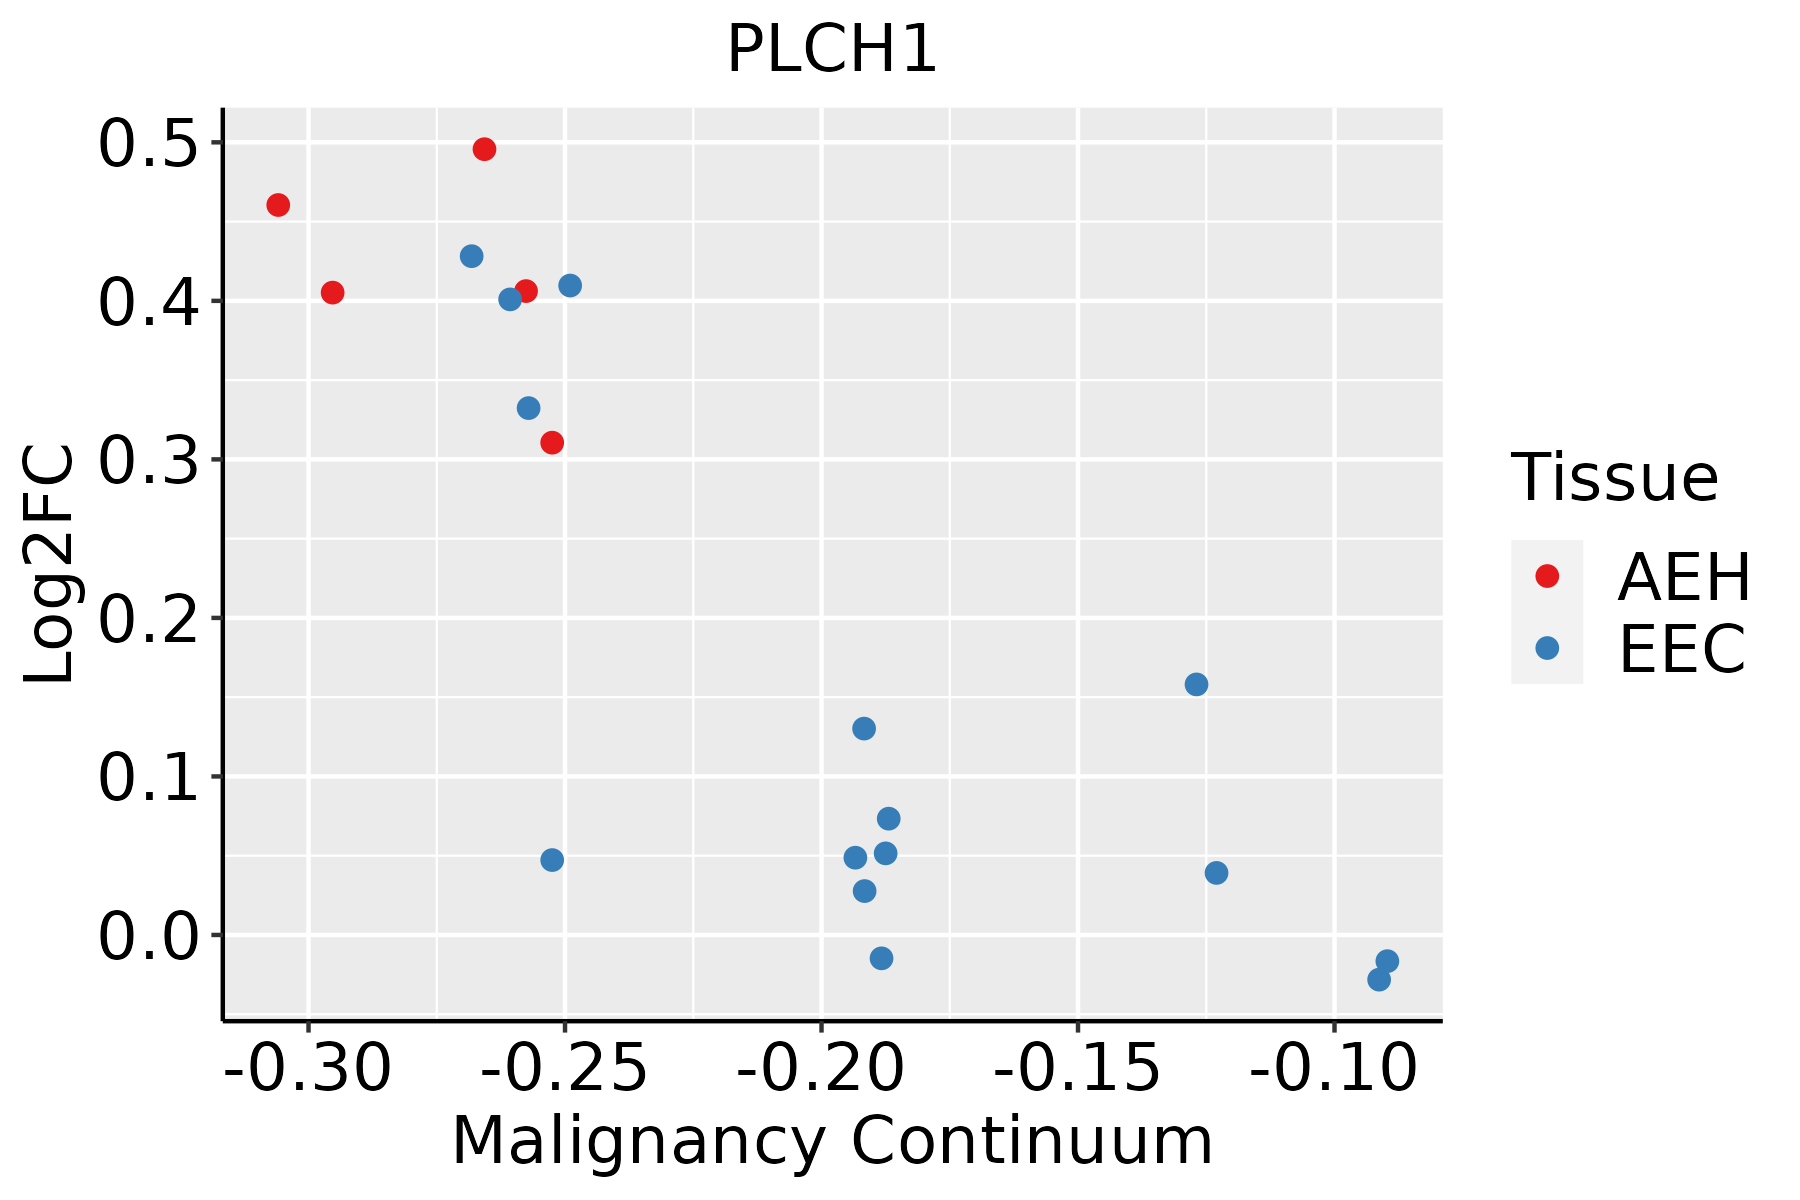 | AEH: Atypical endometrial hyperplasia |
| EEC: Endometrioid Cancer | ||
| Lung |  | AAH: Atypical adenomatous hyperplasia |
| AIS: Adenocarcinoma in situ | ||
| IAC: Invasive lung adenocarcinoma | ||
| MIA: Minimally invasive adenocarcinoma |
| ∗log2FC in expression of this searched gene in stem-like cells from each diseased tissue sample relative to stem-like cells in normal samples in each tissue plotted against the malignancy continuum. Samples are colored based on if they are from different disease stage. |
Top |
Malignant transformation related pathway analysis |
| Find out the enriched GO biological processes and KEGG pathways involved in transition from healthy to precancer to cancer |
| Tissue | Disease Stage | Enriched GO biological Processes |
| Colorectum | AD |  |
| Colorectum | SER |  |
| Colorectum | MSS |  |
| Colorectum | MSI-H |  |
| Colorectum | FAP |  |
| ∗Top 15 enriched GO BP terms are showed in the bar plot of each disease state in each tissue. Each row represents a significant GO biological process which is colored according to the -log10(p.adjust). |
| Page: 1 2 3 4 5 6 7 8 9 |
| GO ID | Tissue | Disease Stage | Description | Gene Ratio | Bg Ratio | pvalue | p.adjust | Count |
| GO:0016042 | Colorectum | AD | lipid catabolic process | 97/3918 | 320/18723 | 4.31e-05 | 7.56e-04 | 97 |
| GO:0048017 | Colorectum | AD | inositol lipid-mediated signaling | 53/3918 | 182/18723 | 5.35e-03 | 3.52e-02 | 53 |
| GO:0048015 | Colorectum | AD | phosphatidylinositol-mediated signaling | 52/3918 | 178/18723 | 5.37e-03 | 3.54e-02 | 52 |
| GO:00160422 | Colorectum | MSS | lipid catabolic process | 77/3467 | 320/18723 | 7.43e-03 | 4.71e-02 | 77 |
| GO:00160423 | Colorectum | FAP | lipid catabolic process | 65/2622 | 320/18723 | 1.13e-03 | 1.08e-02 | 65 |
| GO:00160424 | Colorectum | CRC | lipid catabolic process | 53/2078 | 320/18723 | 1.89e-03 | 1.93e-02 | 53 |
| Page: 1 |
| Pathway ID | Tissue | Disease Stage | Description | Gene Ratio | Bg Ratio | pvalue | p.adjust | qvalue | Count |
| hsa00562 | Colorectum | CRC | Inositol phosphate metabolism | 18/1091 | 73/8465 | 4.38e-03 | 2.52e-02 | 1.71e-02 | 18 |
| hsa005621 | Colorectum | CRC | Inositol phosphate metabolism | 18/1091 | 73/8465 | 4.38e-03 | 2.52e-02 | 1.71e-02 | 18 |
| Page: 1 |
Top |
Cell-cell communication analysis |
| Identification of potential cell-cell interactions between two cell types and their ligand-receptor pairs for different disease states |
| Ligand | Receptor | LRpair | Pathway | Tissue | Disease Stage |
| Page: 1 |
Top |
Single-cell gene regulatory network inference analysis |
| Find out the significant the regulons (TFs) and the target genes of each regulon across cell types for different disease states |
| TF | Cell Type | Tissue | Disease Stage | Target Gene | RSS | Regulon Activity |
| ∗The dot plots of a searched regulon are shown for all cell subpopulations in each disease state of each tissue based on the regulon specific score inferred using pySCENIC and by calculating the average expression. |
| Page: 1 |
Top |
Somatic mutation of malignant transformation related genes |
| Annotation of somatic variants for genes involved in malignant transformation |
| Hugo Symbol | Variant Class | Variant Classification | dbSNP RS | HGVSc | HGVSp | HGVSp Short | SWISSPROT | BIOTYPE | SIFT | PolyPhen | Tumor Sample Barcode | Tissue | Histology | Sex | Age | Stage | Therapy Types | Drugs | Outcome |
| PLCH1 | SNV | Missense_Mutation | novel | c.3631C>T | p.Leu1211Phe | p.L1211F | Q4KWH8 | protein_coding | tolerated_low_confidence(0.08) | possibly_damaging(0.481) | TCGA-5L-AAT0-01 | Breast | breast invasive carcinoma | Female | <65 | I/II | Hormone Therapy | tamoxiphen | SD |
| PLCH1 | SNV | Missense_Mutation | c.4898C>G | p.Ser1633Cys | p.S1633C | Q4KWH8 | protein_coding | deleterious_low_confidence(0) | probably_damaging(0.996) | TCGA-5L-AAT1-01 | Breast | breast invasive carcinoma | Female | <65 | III/IV | Hormone Therapy | letrozol | SD | |
| PLCH1 | SNV | Missense_Mutation | novel | c.3761C>T | p.Ser1254Leu | p.S1254L | Q4KWH8 | protein_coding | deleterious_low_confidence(0.04) | benign(0.335) | TCGA-5L-AAT1-01 | Breast | breast invasive carcinoma | Female | <65 | III/IV | Hormone Therapy | letrozol | SD |
| PLCH1 | SNV | Missense_Mutation | novel | c.304C>T | p.His102Tyr | p.H102Y | Q4KWH8 | protein_coding | deleterious(0) | probably_damaging(0.96) | TCGA-A7-A3IZ-01 | Breast | breast invasive carcinoma | Female | <65 | I/II | Chemotherapy | cytoxan | SD |
| PLCH1 | SNV | Missense_Mutation | c.3884C>G | p.Ala1295Gly | p.A1295G | Q4KWH8 | protein_coding | tolerated_low_confidence(0.23) | benign(0.039) | TCGA-A8-A07W-01 | Breast | breast invasive carcinoma | Female | >=65 | III/IV | Hormone Therapy | exemestane | SD | |
| PLCH1 | SNV | Missense_Mutation | c.1124C>A | p.Thr375Asn | p.T375N | Q4KWH8 | protein_coding | deleterious(0.02) | benign(0.37) | TCGA-A8-A09E-01 | Breast | breast invasive carcinoma | Female | >=65 | III/IV | Hormone Therapy | anastrozole | SD | |
| PLCH1 | SNV | Missense_Mutation | c.3482C>T | p.Ser1161Phe | p.S1161F | Q4KWH8 | protein_coding | deleterious_low_confidence(0.02) | benign(0.326) | TCGA-A8-A09M-01 | Breast | breast invasive carcinoma | Female | >=65 | III/IV | Chemotherapy | paclitaxel | CR | |
| PLCH1 | SNV | Missense_Mutation | novel | c.2885N>A | p.Arg962His | p.R962H | Q4KWH8 | protein_coding | deleterious_low_confidence(0) | probably_damaging(0.964) | TCGA-AN-A046-01 | Breast | breast invasive carcinoma | Female | >=65 | I/II | Unknown | Unknown | SD |
| PLCH1 | SNV | Missense_Mutation | c.1372N>A | p.Glu458Lys | p.E458K | Q4KWH8 | protein_coding | deleterious(0) | possibly_damaging(0.69) | TCGA-AR-A254-01 | Breast | breast invasive carcinoma | Female | <65 | III/IV | Chemotherapy | paclitaxel | SD | |
| PLCH1 | SNV | Missense_Mutation | rs143565615 | c.1546N>T | p.Arg516Trp | p.R516W | Q4KWH8 | protein_coding | deleterious(0) | probably_damaging(0.917) | TCGA-B6-A0RG-01 | Breast | breast invasive carcinoma | Female | <65 | I/II | Unknown | Unknown | SD |
| Page: 1 2 3 4 5 6 7 8 9 10 11 12 13 14 15 16 17 18 19 20 21 22 23 24 25 26 27 |
Top |
Related drugs of malignant transformation related genes |
| Identification of chemicals and drugs interact with genes involved in malignant transfromation |
| (DGIdb 4.0) |
| Entrez ID | Symbol | Category | Interaction Types | Drug Claim Name | Drug Name | PMIDs |
| Page: 1 |

Copyright 2023-Present -The University of Texas Health Science Center at Houston |