
|
|||||
|
 | |
| |
| |
| |
| |
| |
|
Gene: PLCD3 |
Gene summary for PLCD3 |
| Gene information | Species | Human | Gene symbol | PLCD3 | Gene ID | 113026 |
| Gene name | phospholipase C delta 3 | |
| Gene Alias | PLC-delta-3 | |
| Cytomap | 17q21.31 | |
| Gene Type | protein-coding | GO ID | GO:0000003 | UniProtAcc | Q8N3E9 |
Top |
Malignant transformation analysis |
| Identification of the aberrant gene expression in precancerous and cancerous lesions by comparing the gene expression of stem-like cells in diseased tissues with normal stem cells |
| Entrez ID | Symbol | Replicates | Species | Organ | Tissue | Adj P-value | Log2FC | Malignancy |
| 113026 | PLCD3 | HTA11_2487_2000001011 | Human | Colorectum | SER | 1.67e-24 | 7.84e-01 | -0.1808 |
| 113026 | PLCD3 | HTA11_1938_2000001011 | Human | Colorectum | AD | 1.77e-14 | 5.71e-01 | -0.0811 |
| 113026 | PLCD3 | HTA11_78_2000001011 | Human | Colorectum | AD | 1.27e-04 | 2.63e-01 | -0.1088 |
| 113026 | PLCD3 | HTA11_347_2000001011 | Human | Colorectum | AD | 2.11e-25 | 6.29e-01 | -0.1954 |
| 113026 | PLCD3 | HTA11_411_2000001011 | Human | Colorectum | SER | 6.55e-11 | 1.36e+00 | -0.2602 |
| 113026 | PLCD3 | HTA11_2112_2000001011 | Human | Colorectum | SER | 1.27e-06 | 7.86e-01 | -0.2196 |
| 113026 | PLCD3 | HTA11_3361_2000001011 | Human | Colorectum | AD | 8.24e-06 | 3.97e-01 | -0.1207 |
| 113026 | PLCD3 | HTA11_83_2000001011 | Human | Colorectum | SER | 2.08e-11 | 6.00e-01 | -0.1526 |
| 113026 | PLCD3 | HTA11_696_2000001011 | Human | Colorectum | AD | 3.28e-12 | 5.96e-01 | -0.1464 |
| 113026 | PLCD3 | HTA11_866_2000001011 | Human | Colorectum | AD | 2.37e-07 | 3.80e-01 | -0.1001 |
| 113026 | PLCD3 | HTA11_1391_2000001011 | Human | Colorectum | AD | 3.18e-15 | 5.80e-01 | -0.059 |
| 113026 | PLCD3 | HTA11_2992_2000001011 | Human | Colorectum | SER | 3.30e-11 | 1.00e+00 | -0.1706 |
| 113026 | PLCD3 | HTA11_5212_2000001011 | Human | Colorectum | AD | 6.79e-08 | 5.73e-01 | -0.2061 |
| 113026 | PLCD3 | HTA11_5216_2000001011 | Human | Colorectum | SER | 1.18e-04 | 6.00e-01 | -0.1462 |
| 113026 | PLCD3 | HTA11_546_2000001011 | Human | Colorectum | AD | 4.57e-05 | 4.35e-01 | -0.0842 |
| 113026 | PLCD3 | HTA11_8622_2000001021 | Human | Colorectum | SER | 2.65e-03 | 2.89e-01 | 0.0528 |
| 113026 | PLCD3 | HTA11_10711_2000001011 | Human | Colorectum | AD | 3.20e-03 | 2.67e-01 | 0.0338 |
| 113026 | PLCD3 | HTA11_6818_2000001011 | Human | Colorectum | AD | 3.65e-04 | 3.30e-01 | 0.0112 |
| 113026 | PLCD3 | HTA11_6818_2000001021 | Human | Colorectum | AD | 2.30e-04 | 4.23e-01 | 0.0588 |
| 113026 | PLCD3 | LZE24T | Human | Esophagus | ESCC | 1.95e-07 | 2.46e-01 | 0.0596 |
| Page: 1 2 3 4 5 |
| Tissue | Expression Dynamics | Abbreviation |
| Colorectum (GSE201348) |  | FAP: Familial adenomatous polyposis |
| CRC: Colorectal cancer | ||
| Colorectum (HTA11) |  | AD: Adenomas |
| SER: Sessile serrated lesions | ||
| MSI-H: Microsatellite-high colorectal cancer | ||
| MSS: Microsatellite stable colorectal cancer | ||
| Esophagus | 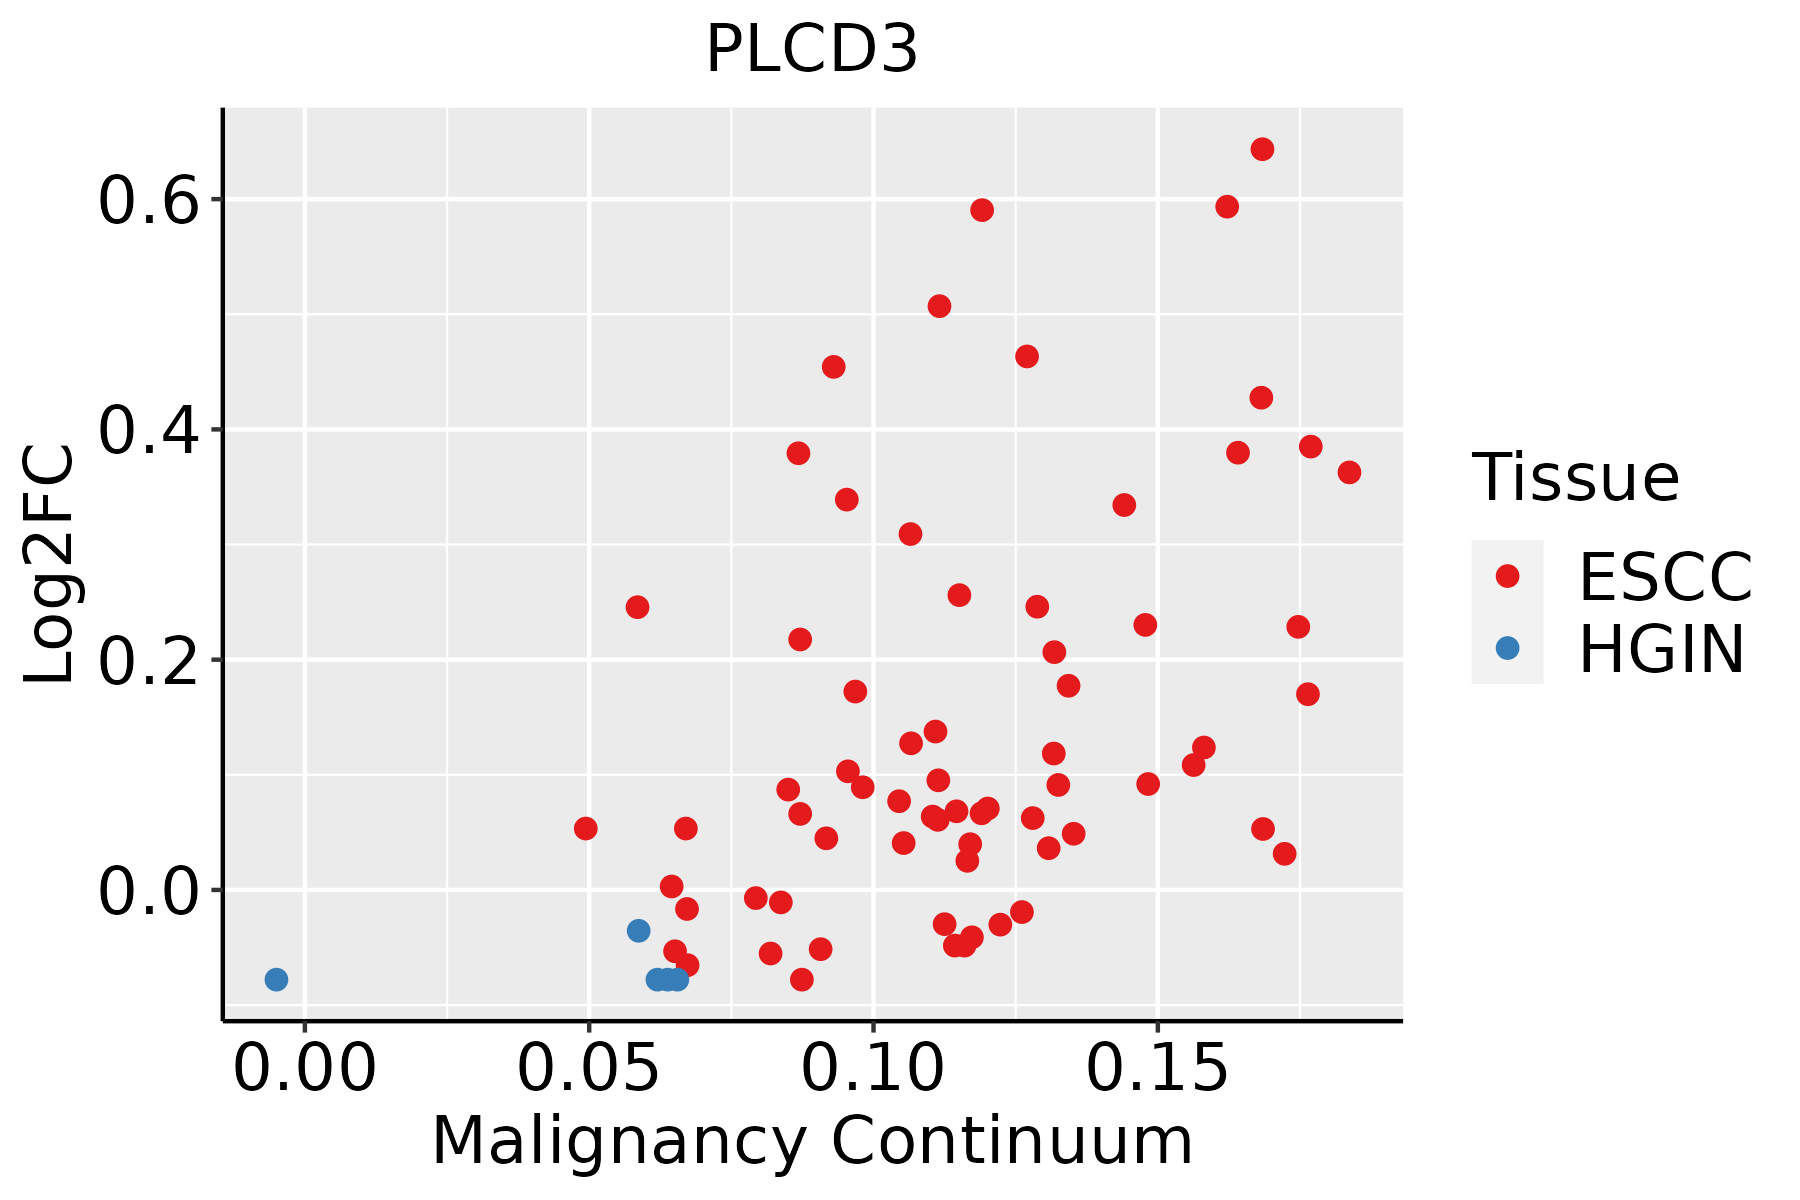 | ESCC: Esophageal squamous cell carcinoma |
| HGIN: High-grade intraepithelial neoplasias | ||
| LGIN: Low-grade intraepithelial neoplasias | ||
| Oral Cavity | 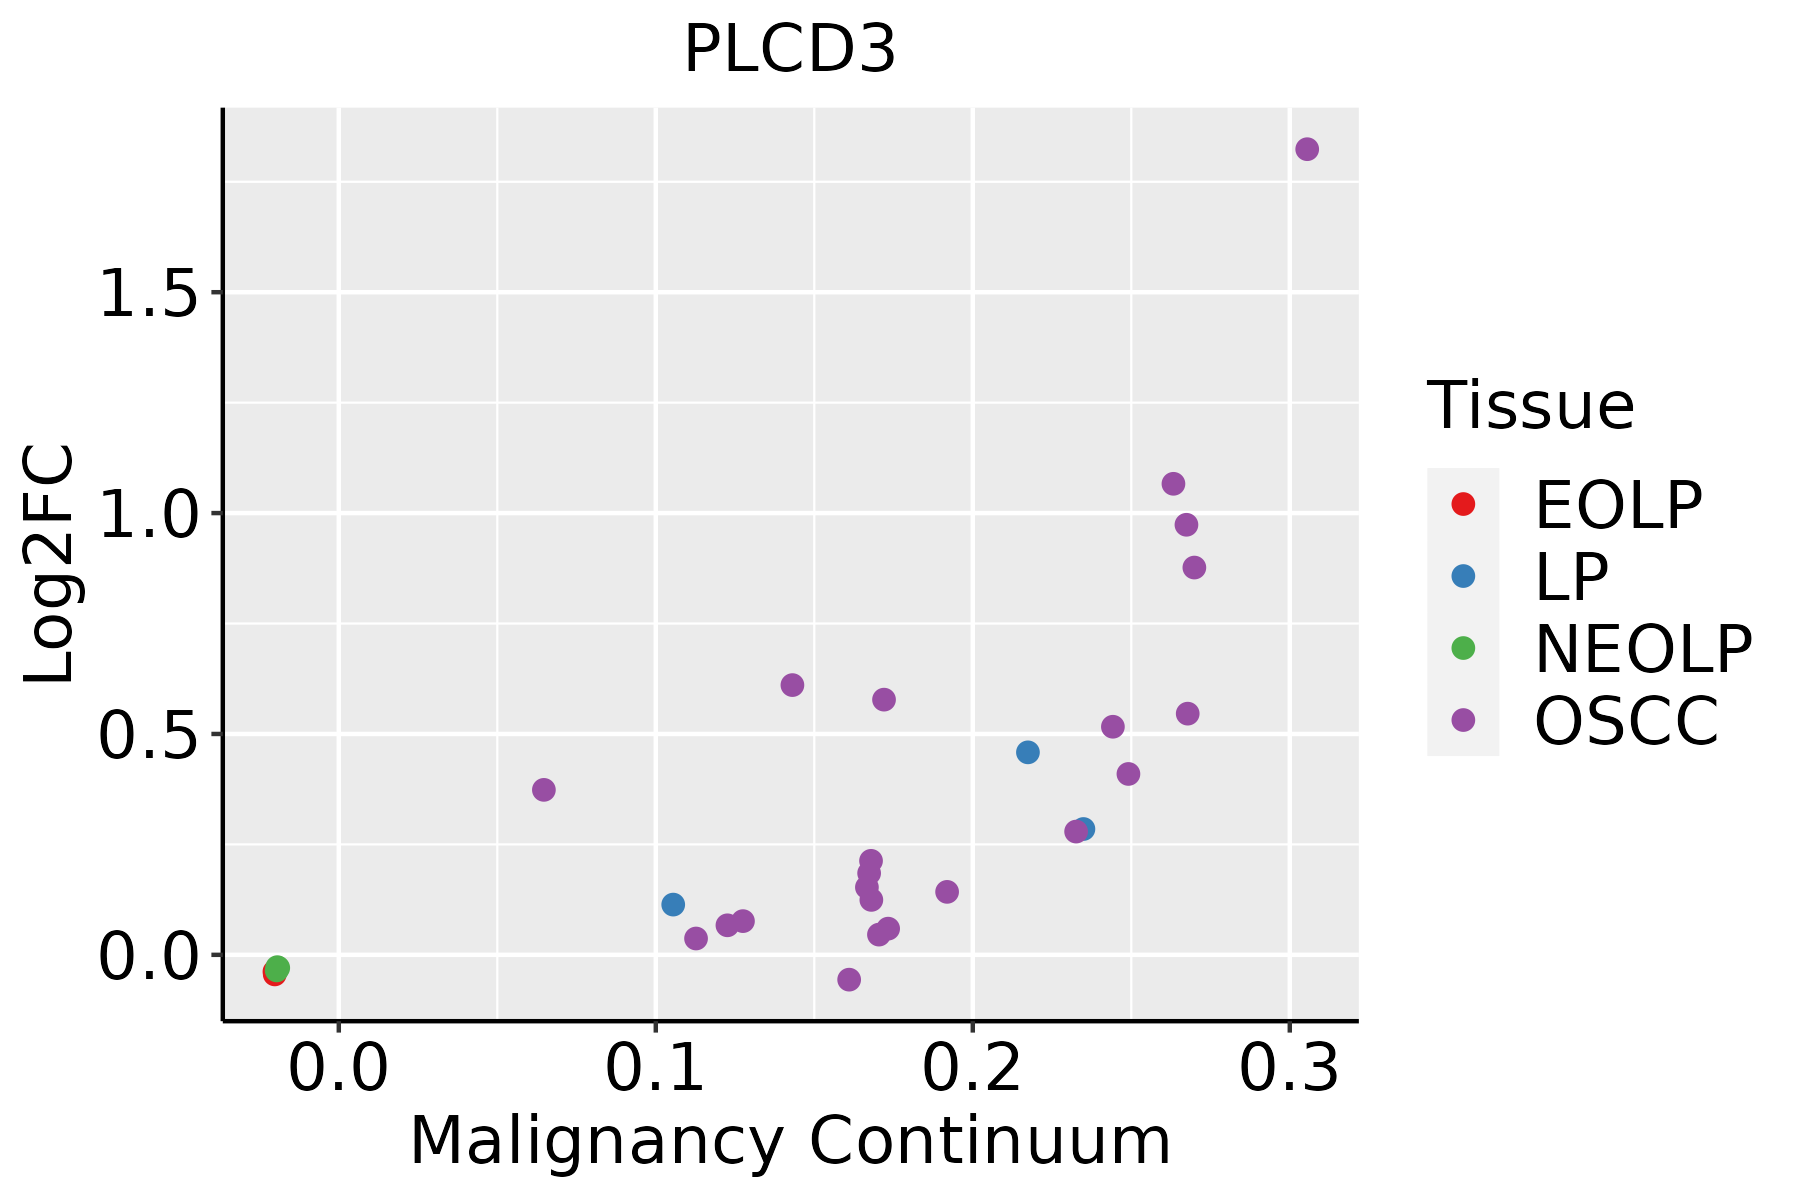 | EOLP: Erosive Oral lichen planus |
| LP: leukoplakia | ||
| NEOLP: Non-erosive oral lichen planus | ||
| OSCC: Oral squamous cell carcinoma | ||
| Skin | 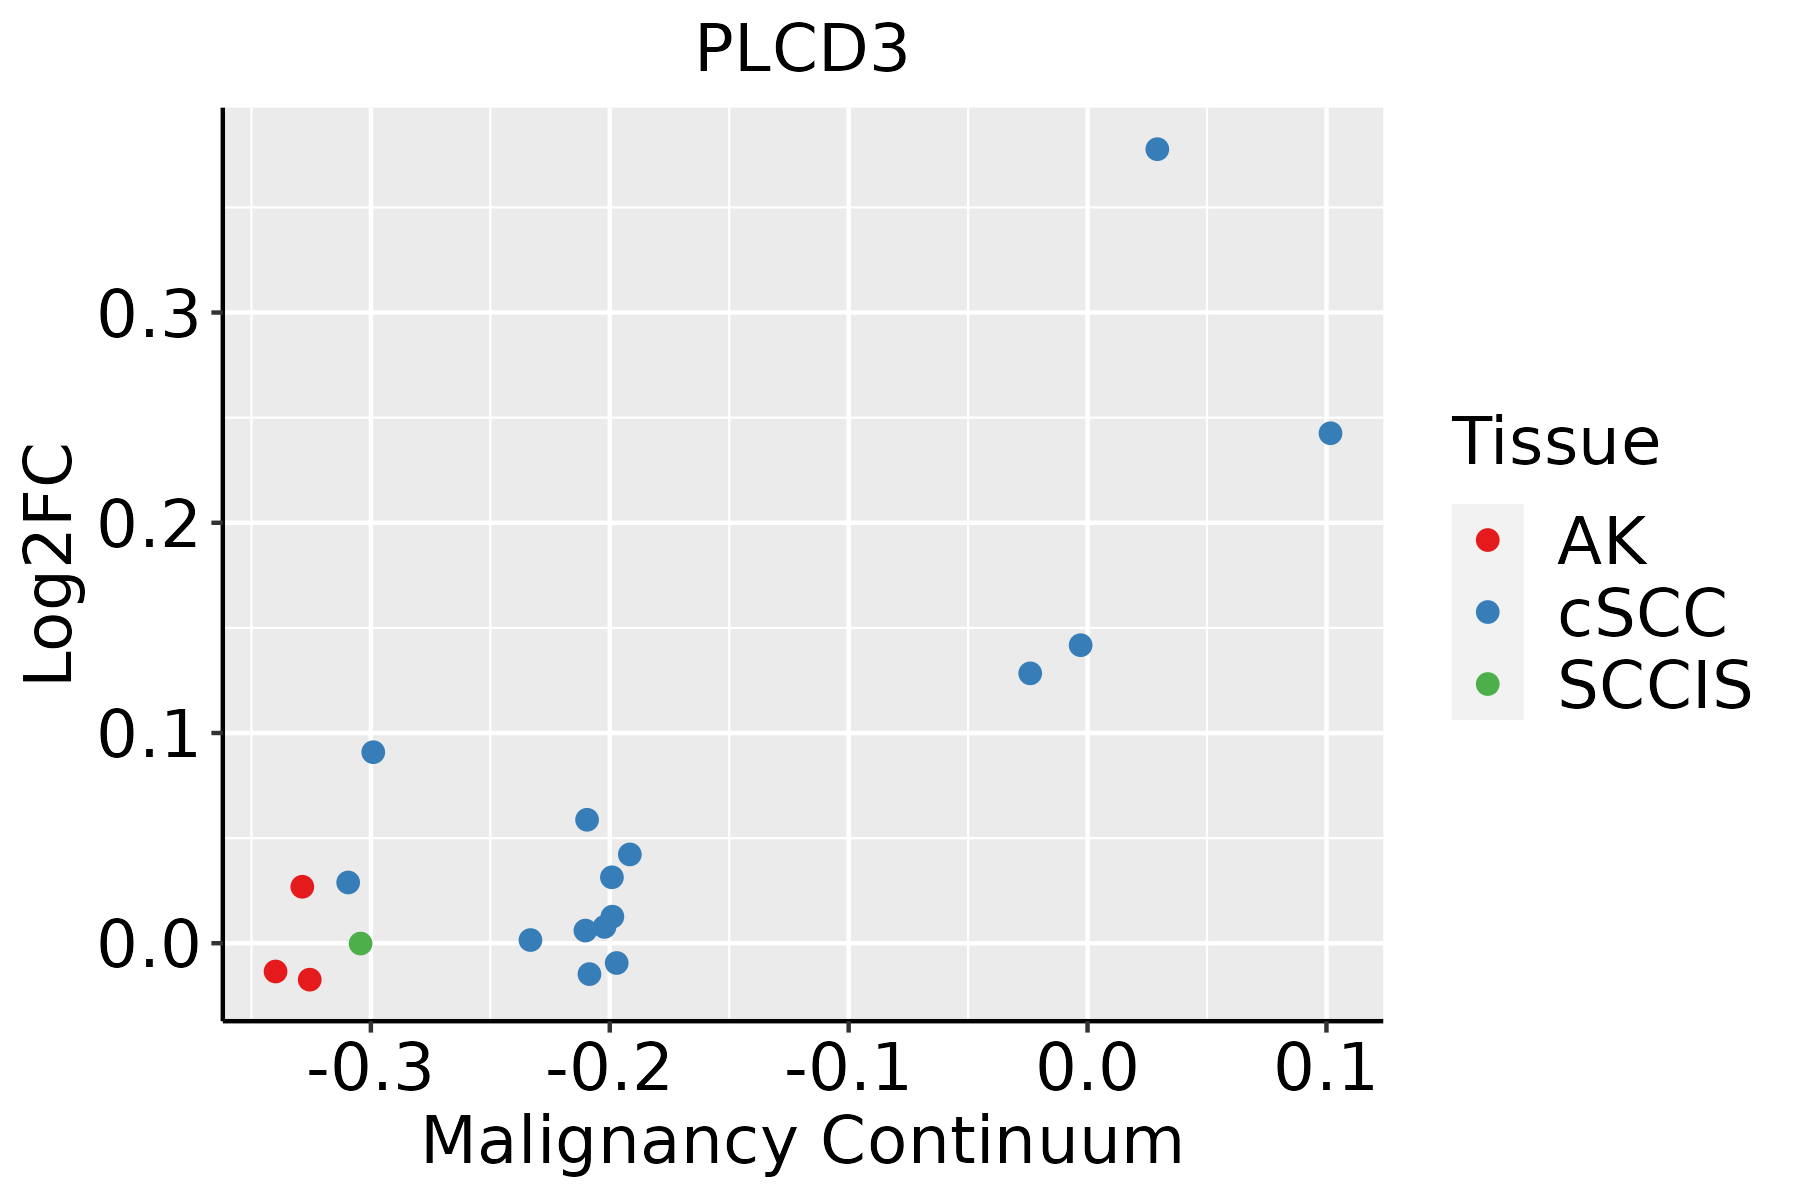 | AK: Actinic keratosis |
| cSCC: Cutaneous squamous cell carcinoma | ||
| SCCIS:squamous cell carcinoma in situ | ||
| Thyroid | 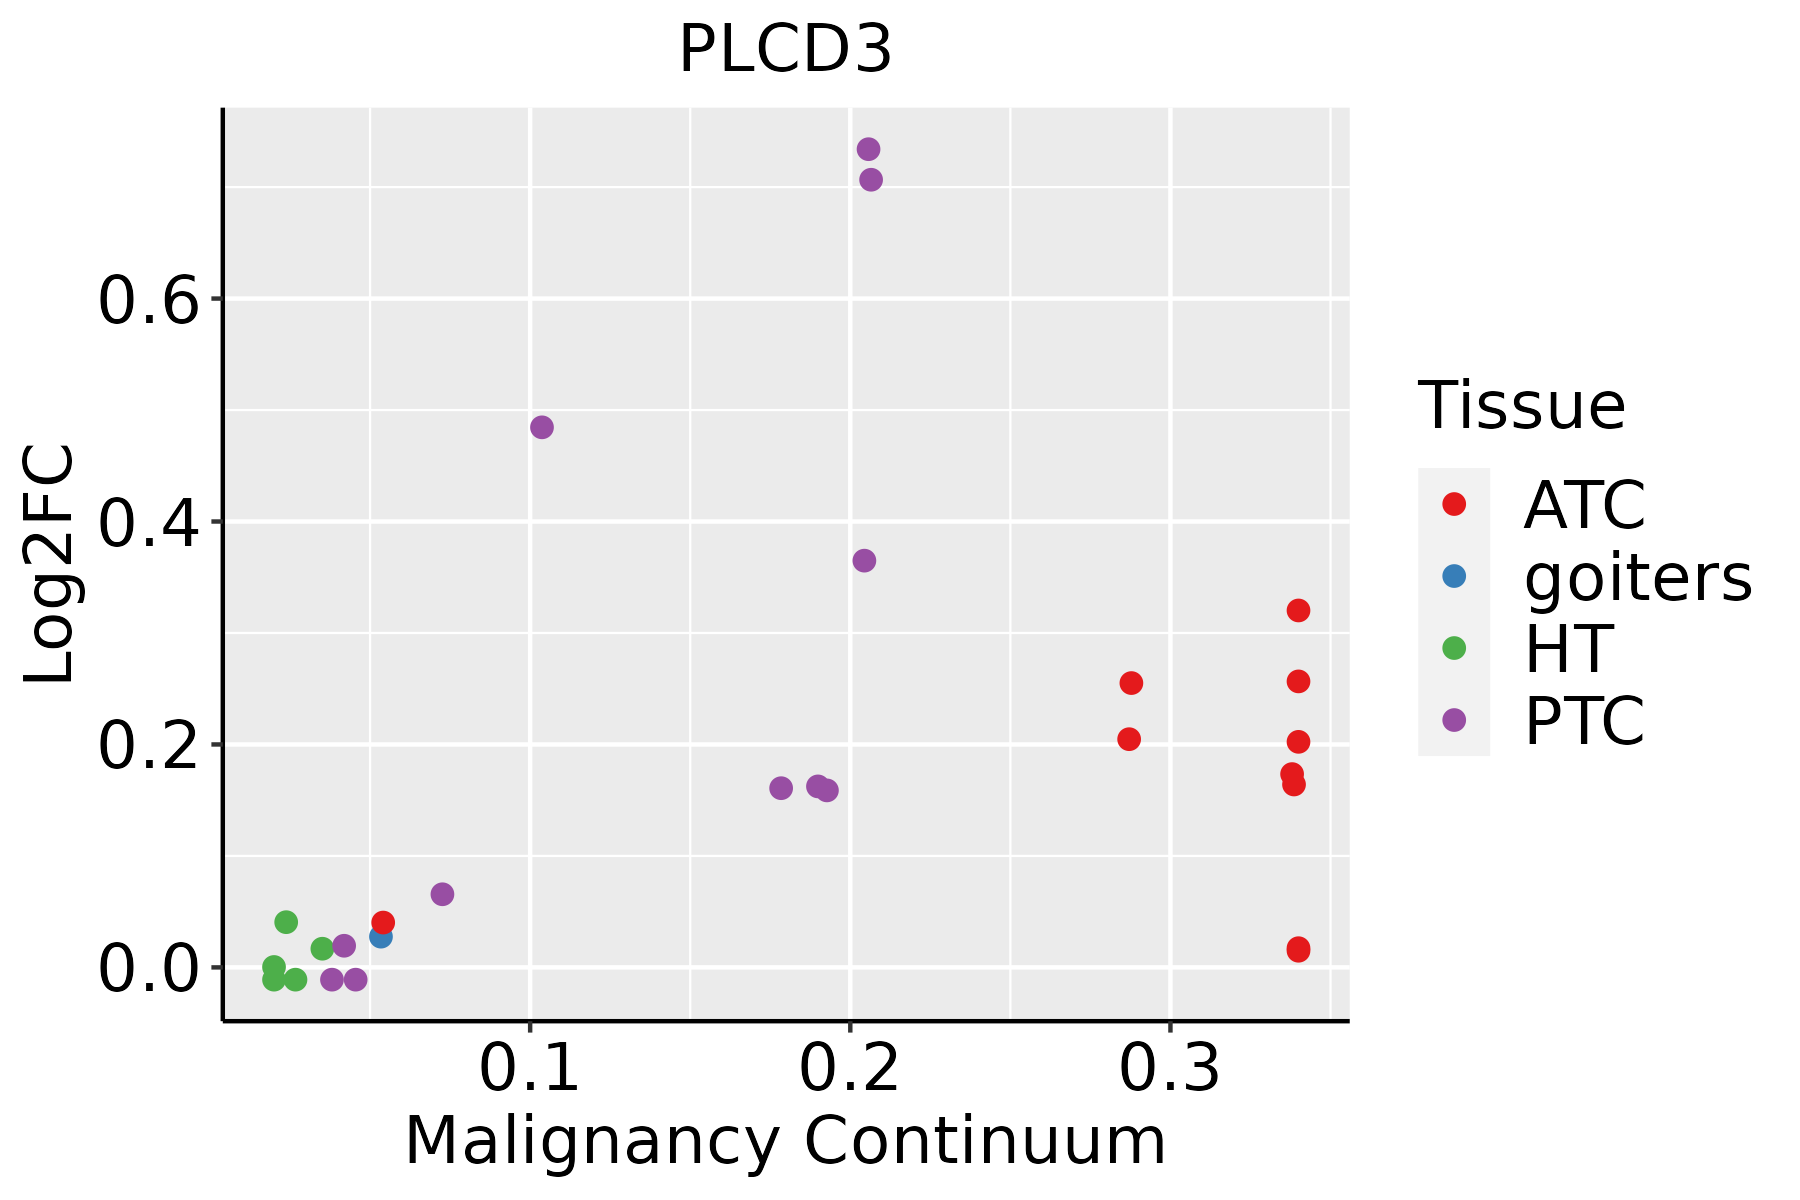 | ATC: Anaplastic thyroid cancer |
| HT: Hashimoto's thyroiditis | ||
| PTC: Papillary thyroid cancer |
| ∗log2FC in expression of this searched gene in stem-like cells from each diseased tissue sample relative to stem-like cells in normal samples in each tissue plotted against the malignancy continuum. Samples are colored based on if they are from different disease stage. |
Top |
Malignant transformation related pathway analysis |
| Find out the enriched GO biological processes and KEGG pathways involved in transition from healthy to precancer to cancer |
| Tissue | Disease Stage | Enriched GO biological Processes |
| Colorectum | AD |  |
| Colorectum | SER |  |
| Colorectum | MSS |  |
| Colorectum | MSI-H |  |
| Colorectum | FAP |  |
| ∗Top 15 enriched GO BP terms are showed in the bar plot of each disease state in each tissue. Each row represents a significant GO biological process which is colored according to the -log10(p.adjust). |
| Page: 1 2 3 4 5 6 7 8 9 |
| GO ID | Tissue | Disease Stage | Description | Gene Ratio | Bg Ratio | pvalue | p.adjust | Count |
| GO:0001701 | Colorectum | AD | in utero embryonic development | 110/3918 | 367/18723 | 2.36e-05 | 4.62e-04 | 110 |
| GO:0001890 | Colorectum | AD | placenta development | 51/3918 | 144/18723 | 3.99e-05 | 7.16e-04 | 51 |
| GO:0016042 | Colorectum | AD | lipid catabolic process | 97/3918 | 320/18723 | 4.31e-05 | 7.56e-04 | 97 |
| GO:0001892 | Colorectum | AD | embryonic placenta development | 33/3918 | 82/18723 | 5.30e-05 | 9.01e-04 | 33 |
| GO:0060711 | Colorectum | AD | labyrinthine layer development | 19/3918 | 44/18723 | 7.13e-04 | 7.21e-03 | 19 |
| GO:0061458 | Colorectum | AD | reproductive system development | 116/3918 | 427/18723 | 1.11e-03 | 1.01e-02 | 116 |
| GO:0048608 | Colorectum | AD | reproductive structure development | 114/3918 | 424/18723 | 1.78e-03 | 1.47e-02 | 114 |
| GO:0048568 | Colorectum | AD | embryonic organ development | 112/3918 | 427/18723 | 4.60e-03 | 3.14e-02 | 112 |
| GO:0048017 | Colorectum | AD | inositol lipid-mediated signaling | 53/3918 | 182/18723 | 5.35e-03 | 3.52e-02 | 53 |
| GO:0048015 | Colorectum | AD | phosphatidylinositol-mediated signaling | 52/3918 | 178/18723 | 5.37e-03 | 3.54e-02 | 52 |
| GO:0060716 | Colorectum | AD | labyrinthine layer blood vessel development | 9/3918 | 18/18723 | 5.82e-03 | 3.67e-02 | 9 |
| GO:00018901 | Colorectum | SER | placenta development | 43/2897 | 144/18723 | 9.10e-06 | 3.03e-04 | 43 |
| GO:00018921 | Colorectum | SER | embryonic placenta development | 28/2897 | 82/18723 | 2.24e-05 | 6.43e-04 | 28 |
| GO:00160421 | Colorectum | SER | lipid catabolic process | 77/2897 | 320/18723 | 3.52e-05 | 9.18e-04 | 77 |
| GO:00607111 | Colorectum | SER | labyrinthine layer development | 16/2897 | 44/18723 | 5.64e-04 | 7.83e-03 | 16 |
| GO:00017011 | Colorectum | SER | in utero embryonic development | 77/2897 | 367/18723 | 2.77e-03 | 2.48e-02 | 77 |
| GO:00614581 | Colorectum | SER | reproductive system development | 87/2897 | 427/18723 | 3.69e-03 | 3.07e-02 | 87 |
| GO:00480171 | Colorectum | SER | inositol lipid-mediated signaling | 42/2897 | 182/18723 | 4.36e-03 | 3.49e-02 | 42 |
| GO:00480151 | Colorectum | SER | phosphatidylinositol-mediated signaling | 41/2897 | 178/18723 | 4.97e-03 | 3.86e-02 | 41 |
| GO:00486081 | Colorectum | SER | reproductive structure development | 85/2897 | 424/18723 | 6.33e-03 | 4.56e-02 | 85 |
| Page: 1 2 3 |
| Pathway ID | Tissue | Disease Stage | Description | Gene Ratio | Bg Ratio | pvalue | p.adjust | qvalue | Count |
| hsa05131 | Colorectum | AD | Shigellosis | 109/2092 | 247/8465 | 1.09e-11 | 2.44e-10 | 1.55e-10 | 109 |
| hsa04919 | Colorectum | AD | Thyroid hormone signaling pathway | 51/2092 | 121/8465 | 1.71e-05 | 1.73e-04 | 1.10e-04 | 51 |
| hsa051311 | Colorectum | AD | Shigellosis | 109/2092 | 247/8465 | 1.09e-11 | 2.44e-10 | 1.55e-10 | 109 |
| hsa049191 | Colorectum | AD | Thyroid hormone signaling pathway | 51/2092 | 121/8465 | 1.71e-05 | 1.73e-04 | 1.10e-04 | 51 |
| hsa051312 | Colorectum | SER | Shigellosis | 87/1580 | 247/8465 | 3.07e-10 | 7.27e-09 | 5.28e-09 | 87 |
| hsa049192 | Colorectum | SER | Thyroid hormone signaling pathway | 40/1580 | 121/8465 | 1.02e-04 | 1.06e-03 | 7.67e-04 | 40 |
| hsa051313 | Colorectum | SER | Shigellosis | 87/1580 | 247/8465 | 3.07e-10 | 7.27e-09 | 5.28e-09 | 87 |
| hsa049193 | Colorectum | SER | Thyroid hormone signaling pathway | 40/1580 | 121/8465 | 1.02e-04 | 1.06e-03 | 7.67e-04 | 40 |
| hsa05131211 | Esophagus | ESCC | Shigellosis | 176/4205 | 247/8465 | 2.27e-12 | 4.01e-11 | 2.05e-11 | 176 |
| hsa0493310 | Esophagus | ESCC | AGE-RAGE signaling pathway in diabetic complications | 72/4205 | 100/8465 | 4.15e-06 | 2.28e-05 | 1.17e-05 | 72 |
| hsa0491928 | Esophagus | ESCC | Thyroid hormone signaling pathway | 78/4205 | 121/8465 | 6.79e-04 | 2.23e-03 | 1.14e-03 | 78 |
| hsa05131310 | Esophagus | ESCC | Shigellosis | 176/4205 | 247/8465 | 2.27e-12 | 4.01e-11 | 2.05e-11 | 176 |
| hsa0493317 | Esophagus | ESCC | AGE-RAGE signaling pathway in diabetic complications | 72/4205 | 100/8465 | 4.15e-06 | 2.28e-05 | 1.17e-05 | 72 |
| hsa04919113 | Esophagus | ESCC | Thyroid hormone signaling pathway | 78/4205 | 121/8465 | 6.79e-04 | 2.23e-03 | 1.14e-03 | 78 |
| hsa0513130 | Oral cavity | OSCC | Shigellosis | 150/3704 | 247/8465 | 3.96e-08 | 3.12e-07 | 1.59e-07 | 150 |
| hsa049339 | Oral cavity | OSCC | AGE-RAGE signaling pathway in diabetic complications | 69/3704 | 100/8465 | 2.61e-07 | 1.65e-06 | 8.41e-07 | 69 |
| hsa0491926 | Oral cavity | OSCC | Thyroid hormone signaling pathway | 73/3704 | 121/8465 | 1.63e-04 | 5.52e-04 | 2.81e-04 | 73 |
| hsa05131113 | Oral cavity | OSCC | Shigellosis | 150/3704 | 247/8465 | 3.96e-08 | 3.12e-07 | 1.59e-07 | 150 |
| hsa0493316 | Oral cavity | OSCC | AGE-RAGE signaling pathway in diabetic complications | 69/3704 | 100/8465 | 2.61e-07 | 1.65e-06 | 8.41e-07 | 69 |
| hsa04919112 | Oral cavity | OSCC | Thyroid hormone signaling pathway | 73/3704 | 121/8465 | 1.63e-04 | 5.52e-04 | 2.81e-04 | 73 |
| Page: 1 |
Top |
Cell-cell communication analysis |
| Identification of potential cell-cell interactions between two cell types and their ligand-receptor pairs for different disease states |
| Ligand | Receptor | LRpair | Pathway | Tissue | Disease Stage |
| Page: 1 |
Top |
Single-cell gene regulatory network inference analysis |
| Find out the significant the regulons (TFs) and the target genes of each regulon across cell types for different disease states |
| TF | Cell Type | Tissue | Disease Stage | Target Gene | RSS | Regulon Activity |
| ∗The dot plots of a searched regulon are shown for all cell subpopulations in each disease state of each tissue based on the regulon specific score inferred using pySCENIC and by calculating the average expression. |
| Page: 1 |
Top |
Somatic mutation of malignant transformation related genes |
| Annotation of somatic variants for genes involved in malignant transformation |
| Hugo Symbol | Variant Class | Variant Classification | dbSNP RS | HGVSc | HGVSp | HGVSp Short | SWISSPROT | BIOTYPE | SIFT | PolyPhen | Tumor Sample Barcode | Tissue | Histology | Sex | Age | Stage | Therapy Types | Drugs | Outcome |
| PLCD3 | SNV | Missense_Mutation | novel | c.2054N>T | p.Asp685Val | p.D685V | Q8N3E9 | protein_coding | deleterious(0) | probably_damaging(0.999) | TCGA-A8-A07R-01 | Breast | breast invasive carcinoma | Female | >=65 | III/IV | Ancillary | zoledronic | SD |
| PLCD3 | SNV | Missense_Mutation | novel | c.1045N>A | p.Ser349Thr | p.S349T | Q8N3E9 | protein_coding | deleterious(0) | possibly_damaging(0.861) | TCGA-E2-A1LH-01 | Breast | breast invasive carcinoma | Female | <65 | I/II | Chemotherapy | adriamycin | SD |
| PLCD3 | SNV | Missense_Mutation | novel | c.424N>A | p.Ala142Thr | p.A142T | Q8N3E9 | protein_coding | tolerated(0.07) | benign(0) | TCGA-2W-A8YY-01 | Cervix | cervical & endocervical cancer | Female | <65 | I/II | Chemotherapy | cisplatin | CR |
| PLCD3 | SNV | Missense_Mutation | novel | c.715G>A | p.Glu239Lys | p.E239K | Q8N3E9 | protein_coding | deleterious(0.01) | probably_damaging(0.994) | TCGA-IR-A3LF-01 | Cervix | cervical & endocervical cancer | Female | <65 | I/II | Unknown | Unknown | SD |
| PLCD3 | SNV | Missense_Mutation | novel | c.1569N>T | p.Gln523His | p.Q523H | Q8N3E9 | protein_coding | tolerated(0.07) | benign(0.014) | TCGA-Q1-A73O-01 | Cervix | cervical & endocervical cancer | Female | <65 | I/II | Chemotherapy | cisplatin | CR |
| PLCD3 | SNV | Missense_Mutation | rs757914564 | c.1246G>A | p.Asp416Asn | p.D416N | Q8N3E9 | protein_coding | tolerated(0.21) | possibly_damaging(0.885) | TCGA-AA-3877-01 | Colorectum | colon adenocarcinoma | Female | >=65 | I/II | Unknown | Unknown | SD |
| PLCD3 | SNV | Missense_Mutation | novel | c.599G>A | p.Ser200Asn | p.S200N | Q8N3E9 | protein_coding | tolerated(0.73) | benign(0.007) | TCGA-AA-3947-01 | Colorectum | colon adenocarcinoma | Female | <65 | I/II | Unknown | Unknown | SD |
| PLCD3 | SNV | Missense_Mutation | novel | c.1836N>T | p.Leu612Phe | p.L612F | Q8N3E9 | protein_coding | deleterious(0) | probably_damaging(0.99) | TCGA-CA-6717-01 | Colorectum | colon adenocarcinoma | Male | <65 | I/II | Chemotherapy | oxaliplatin | CR |
| PLCD3 | SNV | Missense_Mutation | novel | c.1498N>C | p.Glu500Gln | p.E500Q | Q8N3E9 | protein_coding | tolerated(0.1) | benign(0.154) | TCGA-D5-6932-01 | Colorectum | colon adenocarcinoma | Male | >=65 | I/II | Unknown | Unknown | SD |
| PLCD3 | SNV | Missense_Mutation | novel | c.1509N>T | p.Glu503Asp | p.E503D | Q8N3E9 | protein_coding | tolerated(0.37) | benign(0) | TCGA-DM-A1HB-01 | Colorectum | colon adenocarcinoma | Male | >=65 | III/IV | Unknown | Unknown | SD |
| Page: 1 2 3 4 5 |
Top |
Related drugs of malignant transformation related genes |
| Identification of chemicals and drugs interact with genes involved in malignant transfromation |
| (DGIdb 4.0) |
| Entrez ID | Symbol | Category | Interaction Types | Drug Claim Name | Drug Name | PMIDs |
| 113026 | PLCD3 | KINASE, ENZYME, DRUGGABLE GENOME, PHOSPHOLIPASE | diltiazem | DILTIAZEM | 22525200 |
| Page: 1 |

Copyright 2023-Present -The University of Texas Health Science Center at Houston |