
|
|||||
|
 | |
| |
| |
| |
| |
| |
|
Gene: PLBD2 |
Gene summary for PLBD2 |
| Gene information | Species | Human | Gene symbol | PLBD2 | Gene ID | 196463 |
| Gene name | phospholipase B domain containing 2 | |
| Gene Alias | P76 | |
| Cytomap | 12q24.13 | |
| Gene Type | protein-coding | GO ID | GO:0006629 | UniProtAcc | Q8NHP8 |
Top |
Malignant transformation analysis |
| Identification of the aberrant gene expression in precancerous and cancerous lesions by comparing the gene expression of stem-like cells in diseased tissues with normal stem cells |
| Entrez ID | Symbol | Replicates | Species | Organ | Tissue | Adj P-value | Log2FC | Malignancy |
| 196463 | PLBD2 | LZE24T | Human | Esophagus | ESCC | 7.13e-10 | 2.04e-01 | 0.0596 |
| 196463 | PLBD2 | P1T-E | Human | Esophagus | ESCC | 5.30e-03 | 2.47e-01 | 0.0875 |
| 196463 | PLBD2 | P2T-E | Human | Esophagus | ESCC | 7.60e-21 | 3.26e-01 | 0.1177 |
| 196463 | PLBD2 | P4T-E | Human | Esophagus | ESCC | 7.46e-16 | 4.16e-01 | 0.1323 |
| 196463 | PLBD2 | P5T-E | Human | Esophagus | ESCC | 1.31e-10 | 1.39e-01 | 0.1327 |
| 196463 | PLBD2 | P8T-E | Human | Esophagus | ESCC | 2.36e-11 | 2.22e-01 | 0.0889 |
| 196463 | PLBD2 | P9T-E | Human | Esophagus | ESCC | 1.88e-02 | 1.66e-01 | 0.1131 |
| 196463 | PLBD2 | P10T-E | Human | Esophagus | ESCC | 3.76e-09 | 1.03e-01 | 0.116 |
| 196463 | PLBD2 | P11T-E | Human | Esophagus | ESCC | 1.70e-13 | 5.48e-01 | 0.1426 |
| 196463 | PLBD2 | P12T-E | Human | Esophagus | ESCC | 1.94e-17 | 1.76e-01 | 0.1122 |
| 196463 | PLBD2 | P15T-E | Human | Esophagus | ESCC | 1.75e-15 | 3.66e-01 | 0.1149 |
| 196463 | PLBD2 | P16T-E | Human | Esophagus | ESCC | 7.87e-18 | 3.66e-01 | 0.1153 |
| 196463 | PLBD2 | P17T-E | Human | Esophagus | ESCC | 2.21e-06 | 2.66e-01 | 0.1278 |
| 196463 | PLBD2 | P19T-E | Human | Esophagus | ESCC | 7.24e-07 | 4.97e-01 | 0.1662 |
| 196463 | PLBD2 | P20T-E | Human | Esophagus | ESCC | 1.86e-07 | 2.25e-01 | 0.1124 |
| 196463 | PLBD2 | P21T-E | Human | Esophagus | ESCC | 3.60e-31 | 6.83e-01 | 0.1617 |
| 196463 | PLBD2 | P22T-E | Human | Esophagus | ESCC | 3.09e-17 | 2.04e-01 | 0.1236 |
| 196463 | PLBD2 | P23T-E | Human | Esophagus | ESCC | 4.78e-14 | 2.88e-01 | 0.108 |
| 196463 | PLBD2 | P24T-E | Human | Esophagus | ESCC | 2.13e-16 | 2.51e-01 | 0.1287 |
| 196463 | PLBD2 | P26T-E | Human | Esophagus | ESCC | 7.08e-22 | 3.02e-01 | 0.1276 |
| Page: 1 2 3 4 5 |
| Tissue | Expression Dynamics | Abbreviation |
| Esophagus | 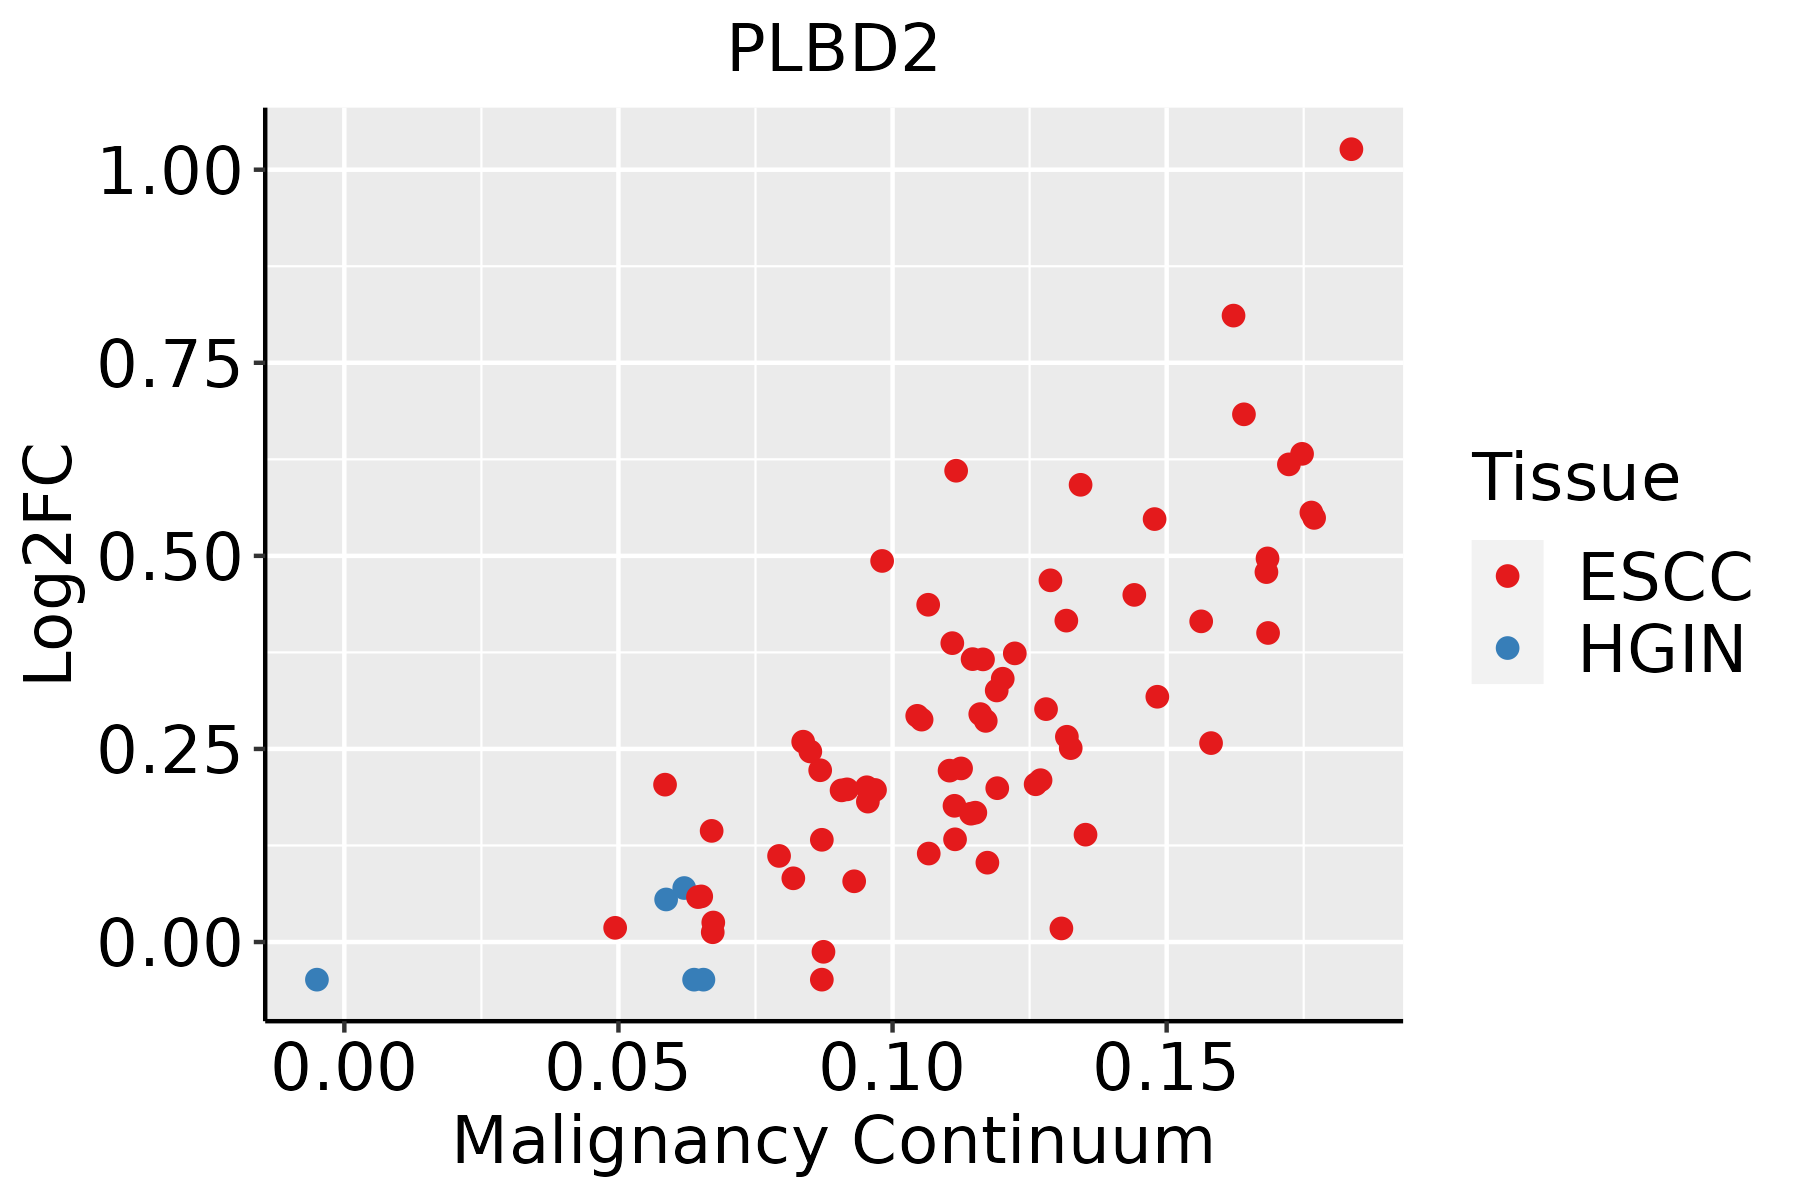 | ESCC: Esophageal squamous cell carcinoma |
| HGIN: High-grade intraepithelial neoplasias | ||
| LGIN: Low-grade intraepithelial neoplasias | ||
| Liver | 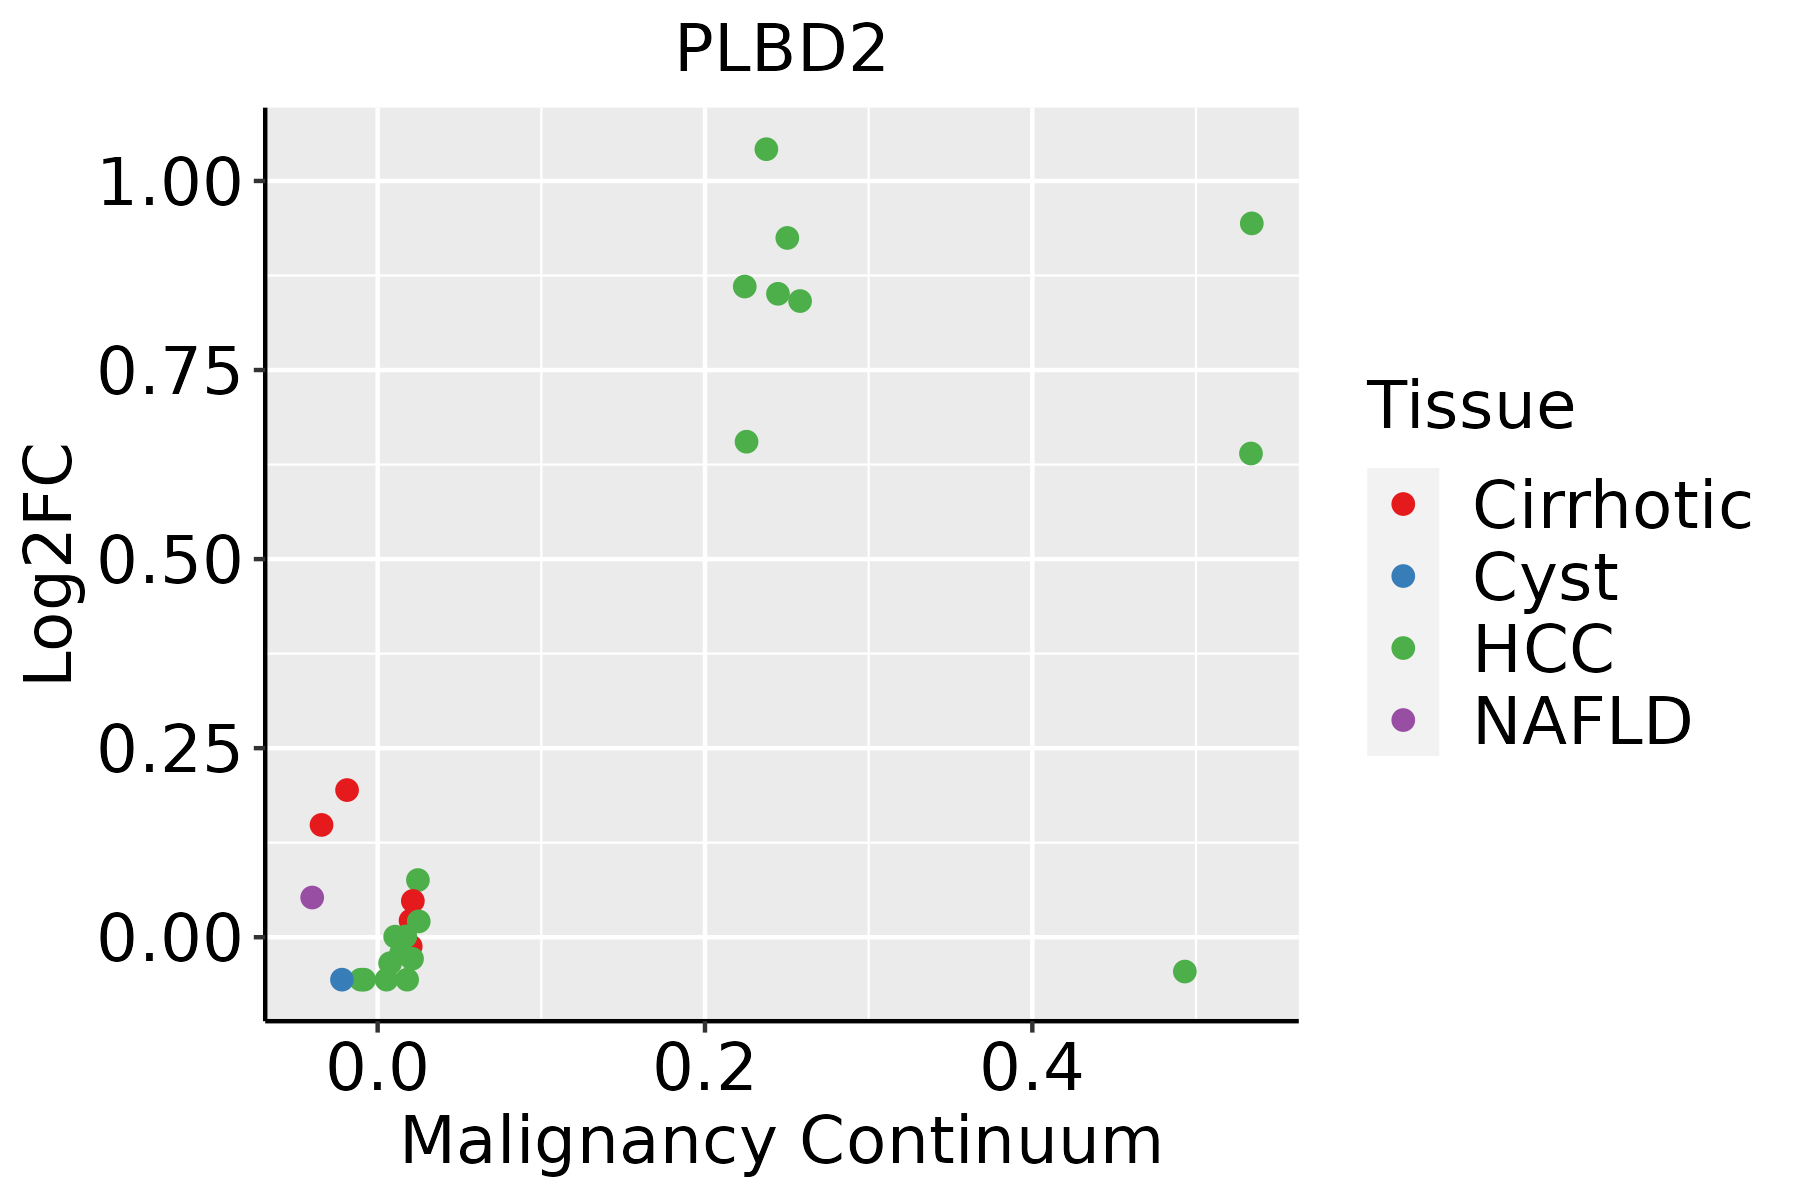 | HCC: Hepatocellular carcinoma |
| NAFLD: Non-alcoholic fatty liver disease | ||
| Oral Cavity |  | EOLP: Erosive Oral lichen planus |
| LP: leukoplakia | ||
| NEOLP: Non-erosive oral lichen planus | ||
| OSCC: Oral squamous cell carcinoma | ||
| Thyroid |  | ATC: Anaplastic thyroid cancer |
| HT: Hashimoto's thyroiditis | ||
| PTC: Papillary thyroid cancer |
| ∗log2FC in expression of this searched gene in stem-like cells from each diseased tissue sample relative to stem-like cells in normal samples in each tissue plotted against the malignancy continuum. Samples are colored based on if they are from different disease stage. |
Top |
Malignant transformation related pathway analysis |
| Find out the enriched GO biological processes and KEGG pathways involved in transition from healthy to precancer to cancer |
| Tissue | Disease Stage | Enriched GO biological Processes |
| Colorectum | AD |  |
| Colorectum | SER |  |
| Colorectum | MSS |  |
| Colorectum | MSI-H |  |
| Colorectum | FAP |  |
| ∗Top 15 enriched GO BP terms are showed in the bar plot of each disease state in each tissue. Each row represents a significant GO biological process which is colored according to the -log10(p.adjust). |
| Page: 1 2 3 4 5 6 7 8 9 |
| GO ID | Tissue | Disease Stage | Description | Gene Ratio | Bg Ratio | pvalue | p.adjust | Count |
| GO:00066446 | Esophagus | ESCC | phospholipid metabolic process | 218/8552 | 383/18723 | 5.37e-06 | 5.59e-05 | 218 |
| GO:00442427 | Esophagus | ESCC | cellular lipid catabolic process | 121/8552 | 214/18723 | 8.63e-04 | 4.43e-03 | 121 |
| GO:00160427 | Esophagus | ESCC | lipid catabolic process | 168/8552 | 320/18723 | 7.97e-03 | 2.84e-02 | 168 |
| GO:004424222 | Liver | HCC | cellular lipid catabolic process | 134/7958 | 214/18723 | 2.07e-09 | 5.79e-08 | 134 |
| GO:00066444 | Liver | HCC | phospholipid metabolic process | 214/7958 | 383/18723 | 7.25e-08 | 1.48e-06 | 214 |
| GO:001604221 | Liver | HCC | lipid catabolic process | 175/7958 | 320/18723 | 6.50e-06 | 7.88e-05 | 175 |
| GO:00464342 | Liver | HCC | organophosphate catabolic process | 89/7958 | 155/18723 | 1.24e-04 | 1.03e-03 | 89 |
| GO:00442426 | Oral cavity | OSCC | cellular lipid catabolic process | 104/7305 | 214/18723 | 2.61e-03 | 1.15e-02 | 104 |
| GO:00066445 | Oral cavity | OSCC | phospholipid metabolic process | 175/7305 | 383/18723 | 4.21e-03 | 1.71e-02 | 175 |
| Page: 1 |
| Pathway ID | Tissue | Disease Stage | Description | Gene Ratio | Bg Ratio | pvalue | p.adjust | qvalue | Count |
| Page: 1 |
Top |
Cell-cell communication analysis |
| Identification of potential cell-cell interactions between two cell types and their ligand-receptor pairs for different disease states |
| Ligand | Receptor | LRpair | Pathway | Tissue | Disease Stage |
| Page: 1 |
Top |
Single-cell gene regulatory network inference analysis |
| Find out the significant the regulons (TFs) and the target genes of each regulon across cell types for different disease states |
| TF | Cell Type | Tissue | Disease Stage | Target Gene | RSS | Regulon Activity |
| ∗The dot plots of a searched regulon are shown for all cell subpopulations in each disease state of each tissue based on the regulon specific score inferred using pySCENIC and by calculating the average expression. |
| Page: 1 |
Top |
Somatic mutation of malignant transformation related genes |
| Annotation of somatic variants for genes involved in malignant transformation |
| Hugo Symbol | Variant Class | Variant Classification | dbSNP RS | HGVSc | HGVSp | HGVSp Short | SWISSPROT | BIOTYPE | SIFT | PolyPhen | Tumor Sample Barcode | Tissue | Histology | Sex | Age | Stage | Therapy Types | Drugs | Outcome |
| PLBD2 | SNV | Missense_Mutation | novel | c.923C>A | p.Ser308Tyr | p.S308Y | Q8NHP8 | protein_coding | deleterious(0) | probably_damaging(0.999) | TCGA-5L-AAT1-01 | Breast | breast invasive carcinoma | Female | <65 | III/IV | Hormone Therapy | letrozol | SD |
| PLBD2 | SNV | Missense_Mutation | c.782N>G | p.His261Arg | p.H261R | Q8NHP8 | protein_coding | deleterious(0) | probably_damaging(0.973) | TCGA-A2-A0T0-01 | Breast | breast invasive carcinoma | Female | <65 | I/II | Chemotherapy | taxotere | SD | |
| PLBD2 | SNV | Missense_Mutation | novel | c.527N>T | p.Ser176Leu | p.S176L | Q8NHP8 | protein_coding | deleterious(0.05) | possibly_damaging(0.473) | TCGA-AC-A3BB-01 | Breast | breast invasive carcinoma | Female | <65 | III/IV | Chemotherapy | cytoxan | CR |
| PLBD2 | SNV | Missense_Mutation | c.1445N>G | p.Asn482Ser | p.N482S | Q8NHP8 | protein_coding | deleterious(0.01) | probably_damaging(0.917) | TCGA-EW-A1J6-01 | Breast | breast invasive carcinoma | Female | >=65 | I/II | Hormone Therapy | femara | SD | |
| PLBD2 | deletion | Frame_Shift_Del | novel | c.1741delN | p.Phe581SerfsTer22 | p.F581Sfs*22 | Q8NHP8 | protein_coding | TCGA-EW-A2FV-01 | Breast | breast invasive carcinoma | Female | <65 | III/IV | Chemotherapy | docetaxel | SD | ||
| PLBD2 | SNV | Missense_Mutation | rs765071928 | c.355N>A | p.Gly119Ser | p.G119S | Q8NHP8 | protein_coding | deleterious(0) | probably_damaging(1) | TCGA-5M-AAT6-01 | Colorectum | colon adenocarcinoma | Female | <65 | III/IV | Unknown | Unknown | PD |
| PLBD2 | SNV | Missense_Mutation | rs761114976 | c.730N>C | p.Cys244Arg | p.C244R | Q8NHP8 | protein_coding | deleterious(0) | probably_damaging(1) | TCGA-AA-3949-01 | Colorectum | colon adenocarcinoma | Female | >=65 | III/IV | Unknown | Unknown | SD |
| PLBD2 | SNV | Missense_Mutation | novel | c.874N>A | p.Val292Ile | p.V292I | Q8NHP8 | protein_coding | tolerated(1) | benign(0.005) | TCGA-AA-A010-01 | Colorectum | colon adenocarcinoma | Female | <65 | I/II | Chemotherapy | folinic | CR |
| PLBD2 | SNV | Missense_Mutation | c.987N>T | p.Lys329Asn | p.K329N | Q8NHP8 | protein_coding | tolerated(0.68) | benign(0.003) | TCGA-AG-3892-01 | Colorectum | rectum adenocarcinoma | Female | <65 | I/II | Unknown | Unknown | SD | |
| PLBD2 | SNV | Missense_Mutation | rs150445091 | c.1012N>T | p.Arg338Trp | p.R338W | Q8NHP8 | protein_coding | deleterious(0) | possibly_damaging(0.849) | TCGA-EI-6507-01 | Colorectum | rectum adenocarcinoma | Male | <65 | I/II | Unknown | Unknown | SD |
| Page: 1 2 3 4 5 |
Top |
Related drugs of malignant transformation related genes |
| Identification of chemicals and drugs interact with genes involved in malignant transfromation |
| (DGIdb 4.0) |
| Entrez ID | Symbol | Category | Interaction Types | Drug Claim Name | Drug Name | PMIDs |
| Page: 1 |

Copyright 2023-Present -The University of Texas Health Science Center at Houston |