
|
|||||
|
 | |
| |
| |
| |
| |
| |
|
Gene: PLAUR |
Gene summary for PLAUR |
| Gene information | Species | Human | Gene symbol | PLAUR | Gene ID | 5329 |
| Gene name | plasminogen activator, urokinase receptor | |
| Gene Alias | CD87 | |
| Cytomap | 19q13.31 | |
| Gene Type | protein-coding | GO ID | GO:0001836 | UniProtAcc | Q03405 |
Top |
Malignant transformation analysis |
| Identification of the aberrant gene expression in precancerous and cancerous lesions by comparing the gene expression of stem-like cells in diseased tissues with normal stem cells |
| Entrez ID | Symbol | Replicates | Species | Organ | Tissue | Adj P-value | Log2FC | Malignancy |
| 5329 | PLAUR | GSM4909285 | Human | Breast | IDC | 5.27e-08 | -2.32e-01 | 0.21 |
| 5329 | PLAUR | GSM4909286 | Human | Breast | IDC | 1.21e-05 | -2.38e-01 | 0.1081 |
| 5329 | PLAUR | GSM4909293 | Human | Breast | IDC | 3.61e-13 | -3.12e-01 | 0.1581 |
| 5329 | PLAUR | GSM4909294 | Human | Breast | IDC | 3.49e-15 | -3.16e-01 | 0.2022 |
| 5329 | PLAUR | GSM4909296 | Human | Breast | IDC | 4.60e-04 | -2.05e-01 | 0.1524 |
| 5329 | PLAUR | GSM4909297 | Human | Breast | IDC | 8.44e-13 | -3.06e-01 | 0.1517 |
| 5329 | PLAUR | GSM4909298 | Human | Breast | IDC | 3.21e-07 | -2.70e-01 | 0.1551 |
| 5329 | PLAUR | GSM4909301 | Human | Breast | IDC | 5.23e-07 | -2.42e-01 | 0.1577 |
| 5329 | PLAUR | GSM4909302 | Human | Breast | IDC | 1.90e-02 | -2.06e-01 | 0.1545 |
| 5329 | PLAUR | GSM4909304 | Human | Breast | IDC | 2.28e-11 | -2.84e-01 | 0.1636 |
| 5329 | PLAUR | GSM4909306 | Human | Breast | IDC | 3.59e-03 | -2.21e-01 | 0.1564 |
| 5329 | PLAUR | GSM4909307 | Human | Breast | IDC | 1.05e-08 | -2.72e-01 | 0.1569 |
| 5329 | PLAUR | GSM4909308 | Human | Breast | IDC | 7.12e-04 | -2.62e-01 | 0.158 |
| 5329 | PLAUR | GSM4909309 | Human | Breast | IDC | 1.20e-02 | -2.09e-01 | 0.0483 |
| 5329 | PLAUR | GSM4909311 | Human | Breast | IDC | 4.21e-17 | -3.15e-01 | 0.1534 |
| 5329 | PLAUR | GSM4909312 | Human | Breast | IDC | 2.45e-14 | -3.17e-01 | 0.1552 |
| 5329 | PLAUR | GSM4909313 | Human | Breast | IDC | 6.71e-04 | -2.58e-01 | 0.0391 |
| 5329 | PLAUR | GSM4909315 | Human | Breast | IDC | 3.61e-10 | -3.05e-01 | 0.21 |
| 5329 | PLAUR | GSM4909316 | Human | Breast | IDC | 1.12e-03 | -3.26e-01 | 0.21 |
| 5329 | PLAUR | GSM4909317 | Human | Breast | IDC | 4.32e-05 | -2.76e-01 | 0.1355 |
| Page: 1 2 3 4 5 6 7 8 9 10 |
| Tissue | Expression Dynamics | Abbreviation |
| Breast | 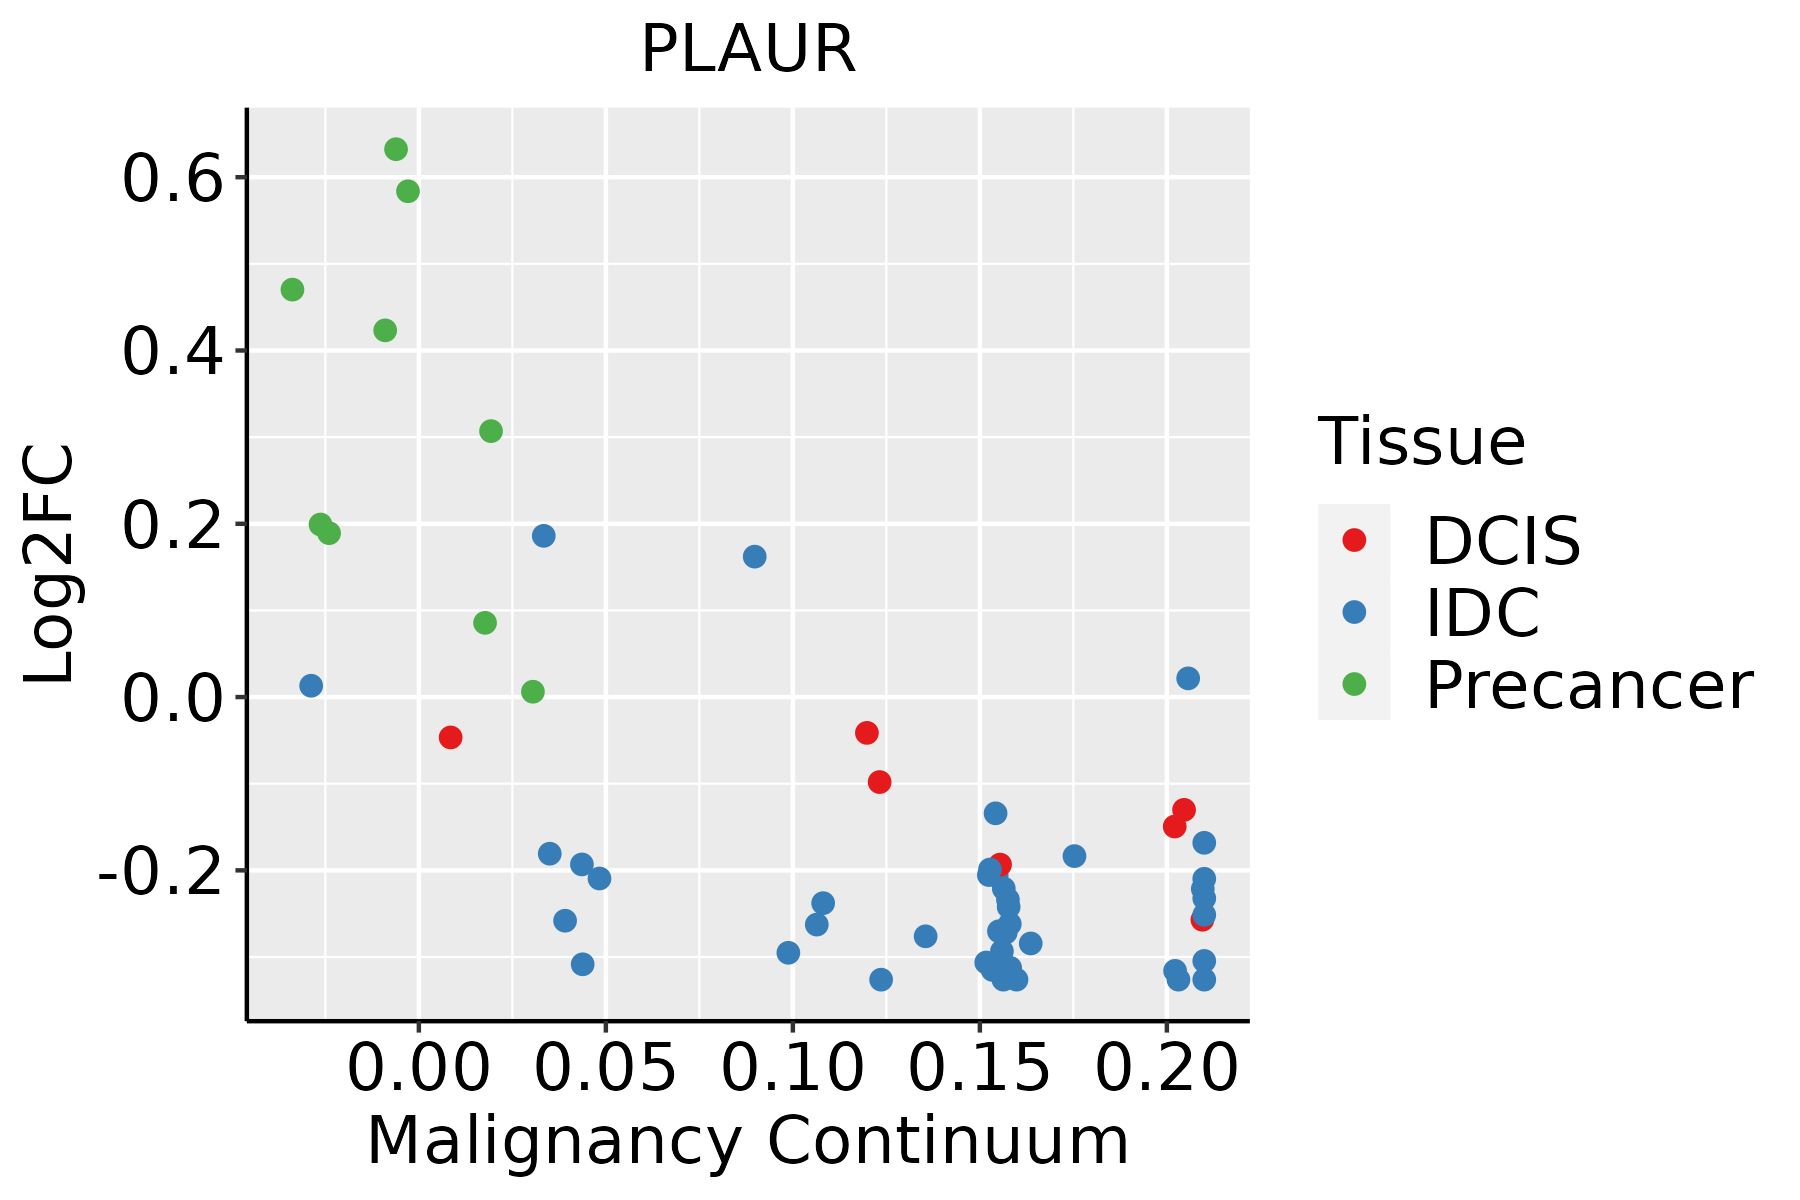 | IDC: Invasive ductal carcinoma |
| DCIS: Ductal carcinoma in situ | ||
| Precancer(BRCA1-mut): Precancerous lesion from BRCA1 mutation carriers | ||
| Colorectum (GSE201348) |  | FAP: Familial adenomatous polyposis |
| CRC: Colorectal cancer | ||
| Colorectum (HTA11) |  | AD: Adenomas |
| SER: Sessile serrated lesions | ||
| MSI-H: Microsatellite-high colorectal cancer | ||
| MSS: Microsatellite stable colorectal cancer | ||
| Endometrium | 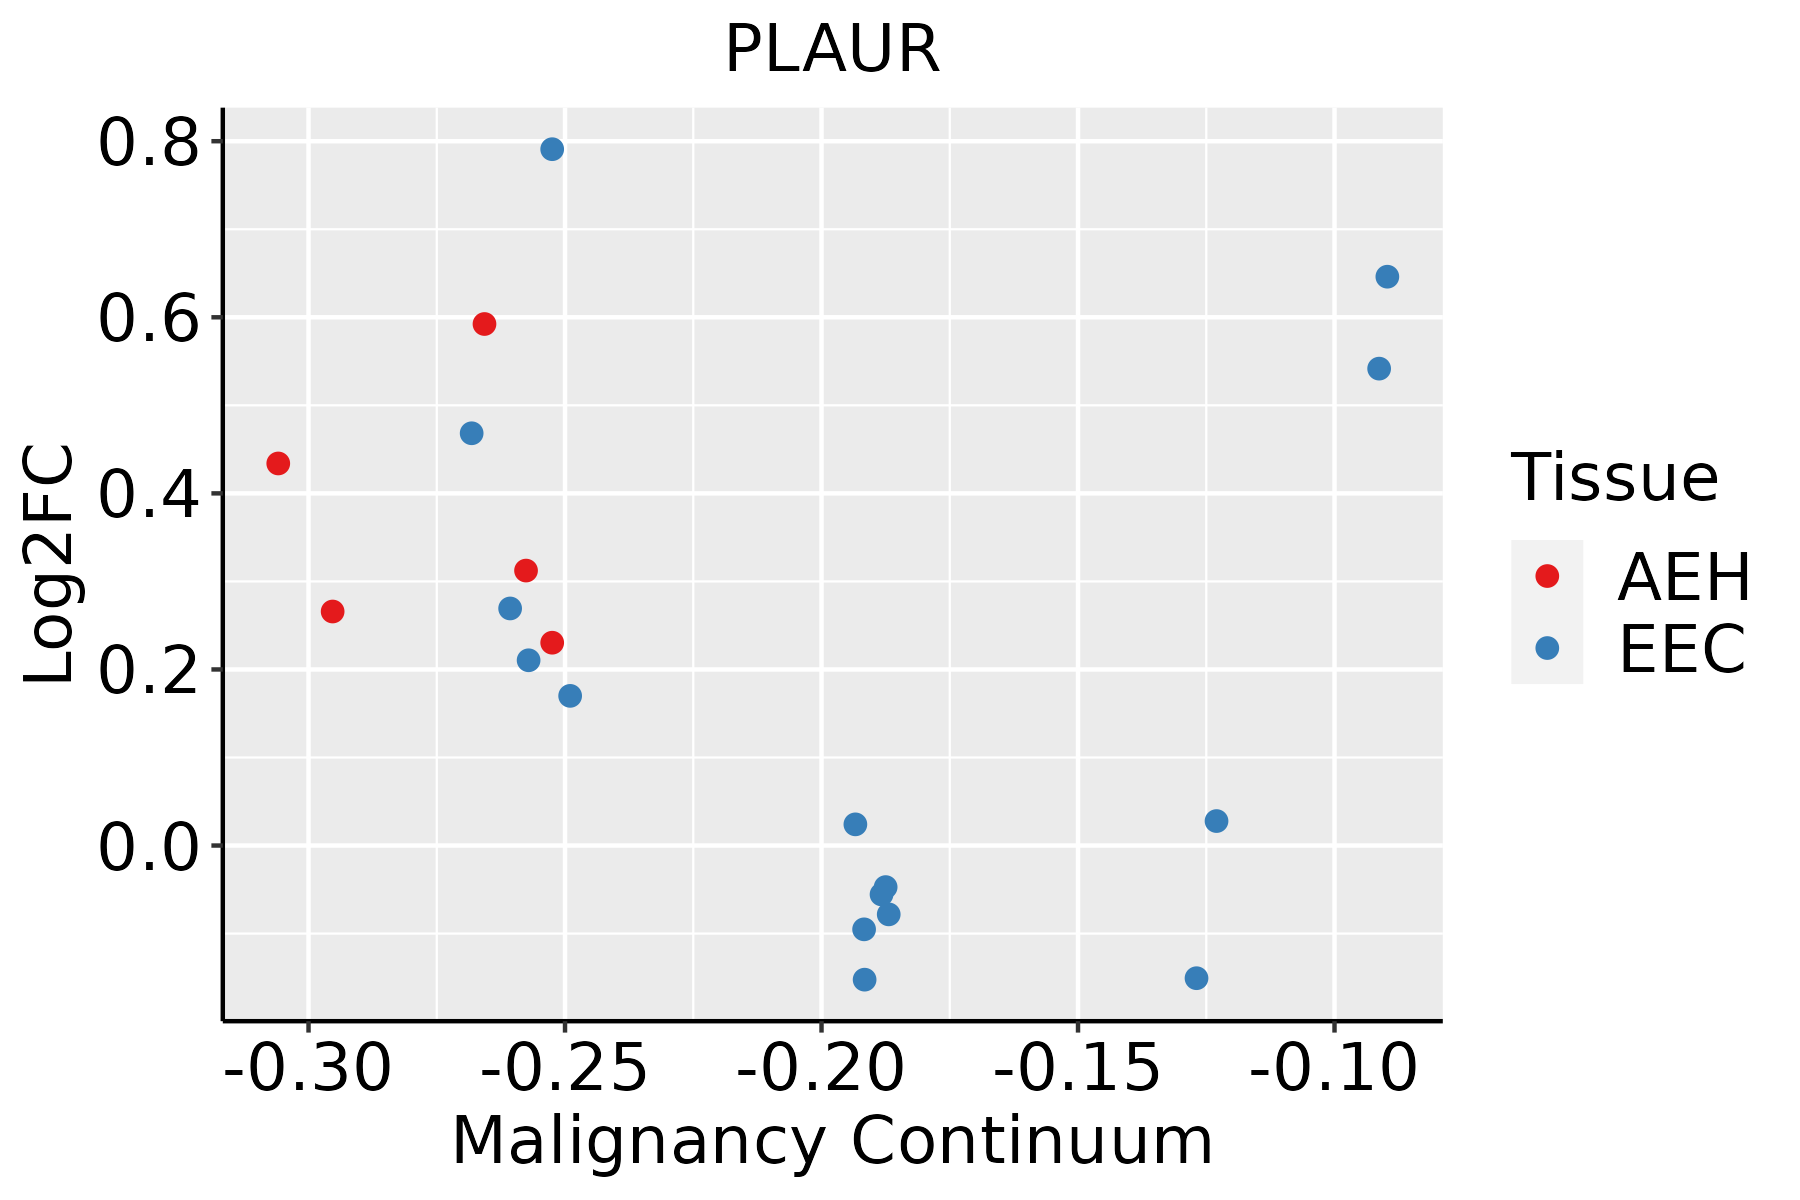 | AEH: Atypical endometrial hyperplasia |
| EEC: Endometrioid Cancer | ||
| Esophagus |  | ESCC: Esophageal squamous cell carcinoma |
| HGIN: High-grade intraepithelial neoplasias | ||
| LGIN: Low-grade intraepithelial neoplasias | ||
| GC |  | CAG: Chronic atrophic gastritis |
| CAG with IM: Chronic atrophic gastritis with intestinal metaplasia | ||
| CSG: Chronic superficial gastritis | ||
| GC: Gastric cancer | ||
| SIM: Severe intestinal metaplasia | ||
| WIM: Wild intestinal metaplasia | ||
| Lung | 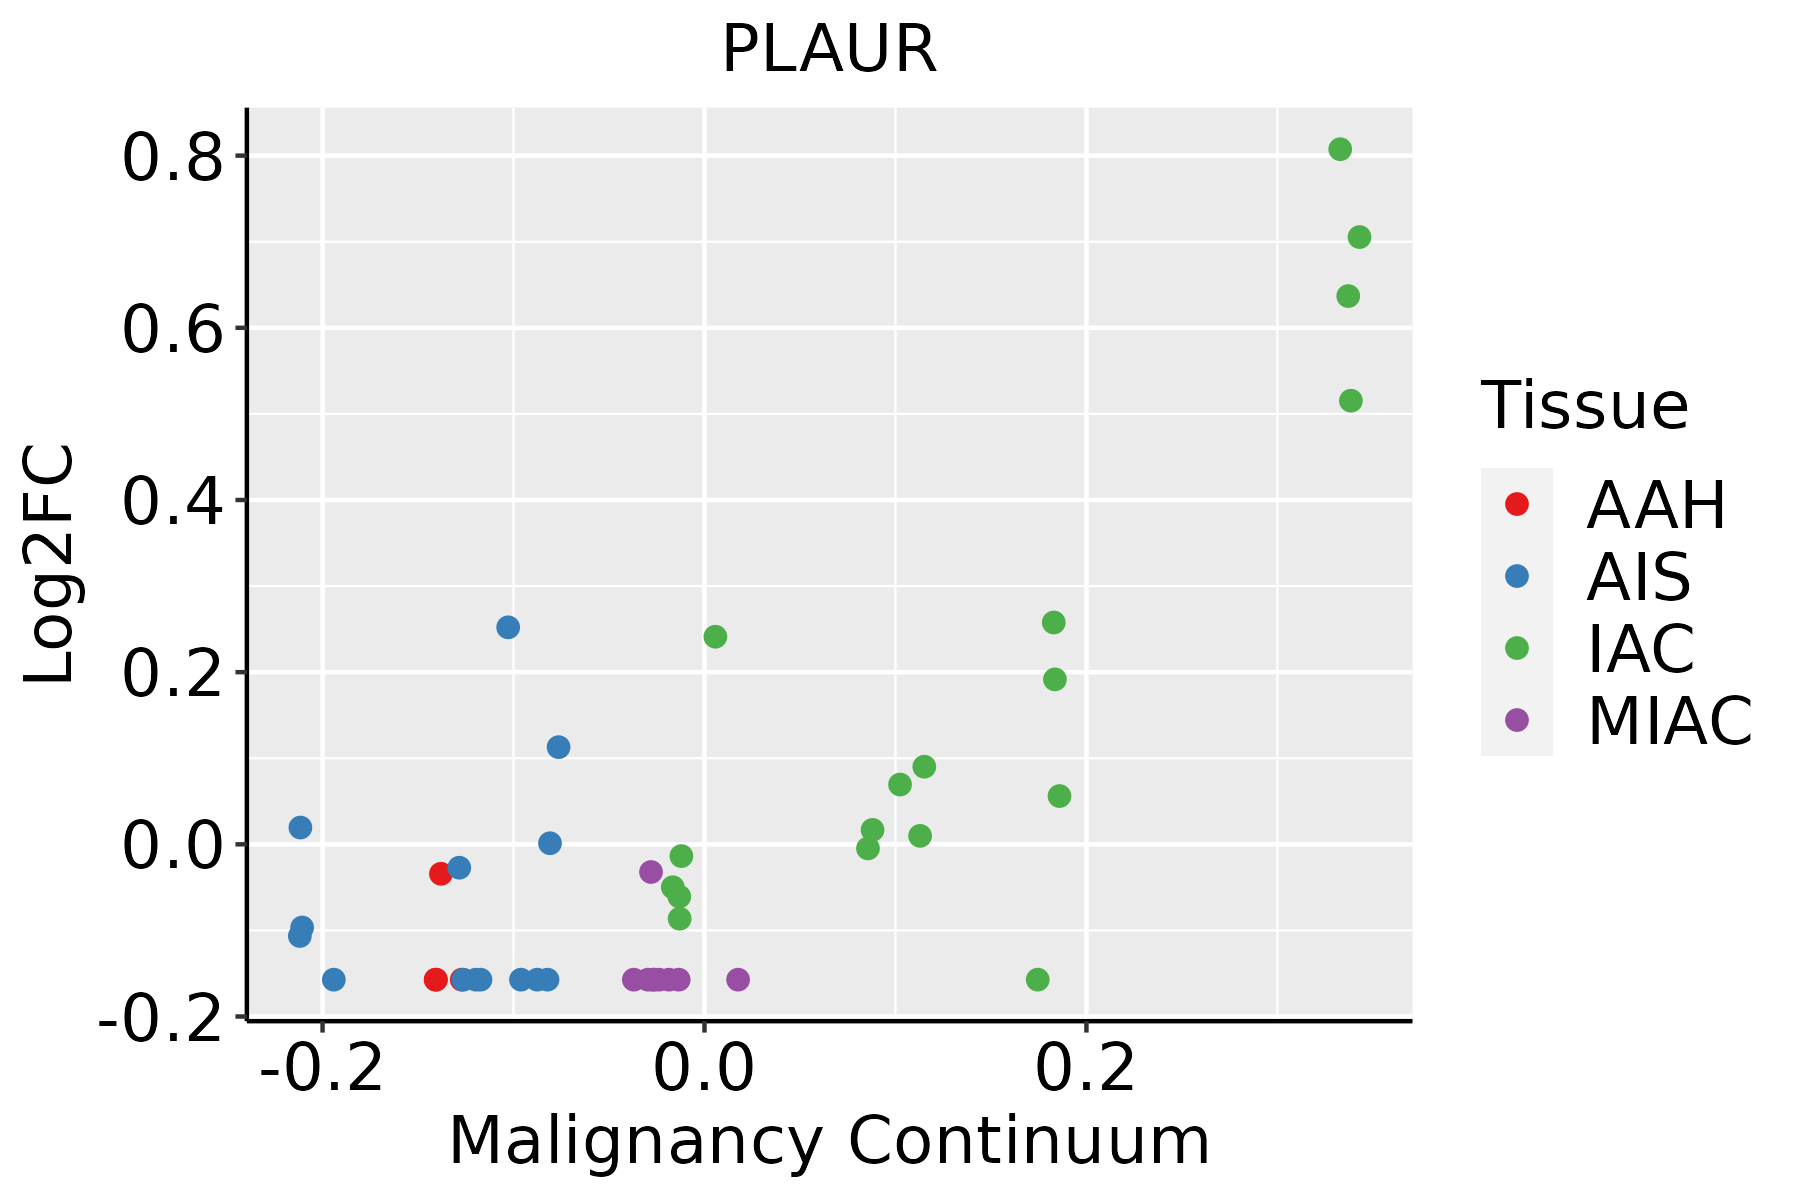 | AAH: Atypical adenomatous hyperplasia |
| AIS: Adenocarcinoma in situ | ||
| IAC: Invasive lung adenocarcinoma | ||
| MIA: Minimally invasive adenocarcinoma | ||
| Oral Cavity | 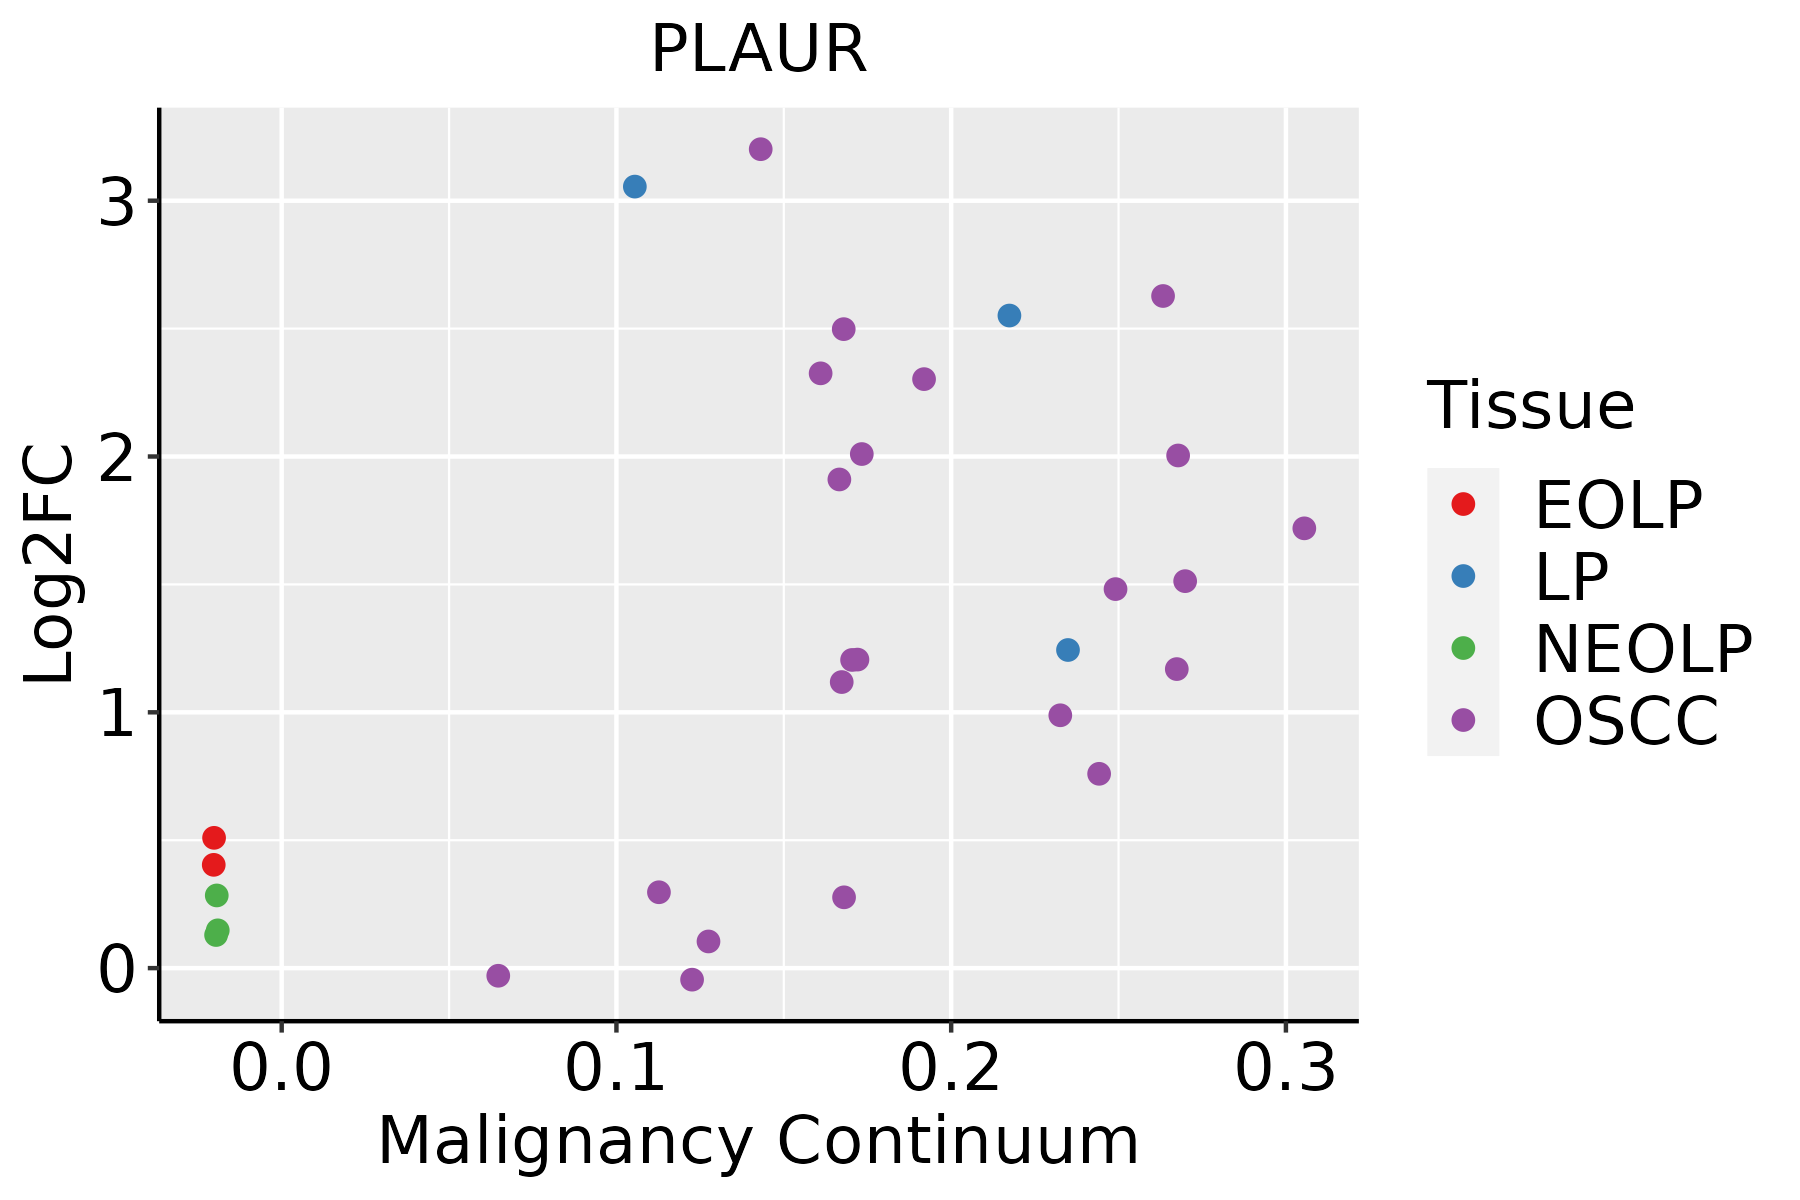 | EOLP: Erosive Oral lichen planus |
| LP: leukoplakia | ||
| NEOLP: Non-erosive oral lichen planus | ||
| OSCC: Oral squamous cell carcinoma | ||
| Prostate |  | BPH: Benign Prostatic Hyperplasia |
| Skin |  | AK: Actinic keratosis |
| cSCC: Cutaneous squamous cell carcinoma | ||
| SCCIS:squamous cell carcinoma in situ | ||
| Thyroid |  | ATC: Anaplastic thyroid cancer |
| HT: Hashimoto's thyroiditis | ||
| PTC: Papillary thyroid cancer |
| ∗log2FC in expression of this searched gene in stem-like cells from each diseased tissue sample relative to stem-like cells in normal samples in each tissue plotted against the malignancy continuum. Samples are colored based on if they are from different disease stage. |
Top |
Malignant transformation related pathway analysis |
| Find out the enriched GO biological processes and KEGG pathways involved in transition from healthy to precancer to cancer |
| Tissue | Disease Stage | Enriched GO biological Processes |
| Colorectum | AD |  |
| Colorectum | SER |  |
| Colorectum | MSS |  |
| Colorectum | MSI-H |  |
| Colorectum | FAP |  |
| ∗Top 15 enriched GO BP terms are showed in the bar plot of each disease state in each tissue. Each row represents a significant GO biological process which is colored according to the -log10(p.adjust). |
| Page: 1 2 3 4 5 6 7 8 9 |
| GO ID | Tissue | Disease Stage | Description | Gene Ratio | Bg Ratio | pvalue | p.adjust | Count |
| GO:00971939 | Breast | Precancer | intrinsic apoptotic signaling pathway | 59/1080 | 288/18723 | 8.07e-18 | 3.60e-15 | 59 |
| GO:20012339 | Breast | Precancer | regulation of apoptotic signaling pathway | 65/1080 | 356/18723 | 7.70e-17 | 3.17e-14 | 65 |
| GO:20012429 | Breast | Precancer | regulation of intrinsic apoptotic signaling pathway | 41/1080 | 164/18723 | 6.48e-16 | 2.31e-13 | 41 |
| GO:00525479 | Breast | Precancer | regulation of peptidase activity | 71/1080 | 461/18723 | 2.72e-14 | 6.94e-12 | 71 |
| GO:00525489 | Breast | Precancer | regulation of endopeptidase activity | 67/1080 | 432/18723 | 1.06e-13 | 2.36e-11 | 67 |
| GO:20001169 | Breast | Precancer | regulation of cysteine-type endopeptidase activity | 43/1080 | 235/18723 | 1.30e-11 | 1.83e-09 | 43 |
| GO:00432819 | Breast | Precancer | regulation of cysteine-type endopeptidase activity involved in apoptotic process | 40/1080 | 209/18723 | 1.59e-11 | 2.07e-09 | 40 |
| GO:20012349 | Breast | Precancer | negative regulation of apoptotic signaling pathway | 39/1080 | 224/18723 | 5.35e-10 | 4.77e-08 | 39 |
| GO:00458619 | Breast | Precancer | negative regulation of proteolysis | 50/1080 | 351/18723 | 2.99e-09 | 2.39e-07 | 50 |
| GO:20012439 | Breast | Precancer | negative regulation of intrinsic apoptotic signaling pathway | 23/1080 | 98/18723 | 5.82e-09 | 4.45e-07 | 23 |
| GO:00086378 | Breast | Precancer | apoptotic mitochondrial changes | 23/1080 | 107/18723 | 3.44e-08 | 2.12e-06 | 23 |
| GO:00513468 | Breast | Precancer | negative regulation of hydrolase activity | 50/1080 | 379/18723 | 3.85e-08 | 2.34e-06 | 50 |
| GO:00104668 | Breast | Precancer | negative regulation of peptidase activity | 38/1080 | 262/18723 | 1.46e-07 | 7.82e-06 | 38 |
| GO:00109519 | Breast | Precancer | negative regulation of endopeptidase activity | 37/1080 | 252/18723 | 1.55e-07 | 8.05e-06 | 37 |
| GO:20001179 | Breast | Precancer | negative regulation of cysteine-type endopeptidase activity | 19/1080 | 86/18723 | 3.36e-07 | 1.58e-05 | 19 |
| GO:00457859 | Breast | Precancer | positive regulation of cell adhesion | 52/1080 | 437/18723 | 5.74e-07 | 2.49e-05 | 52 |
| GO:00511019 | Breast | Precancer | regulation of DNA binding | 22/1080 | 118/18723 | 9.28e-07 | 3.71e-05 | 22 |
| GO:00431548 | Breast | Precancer | negative regulation of cysteine-type endopeptidase activity involved in apoptotic process | 17/1080 | 78/18723 | 1.69e-06 | 6.08e-05 | 17 |
| GO:00433887 | Breast | Precancer | positive regulation of DNA binding | 14/1080 | 56/18723 | 2.46e-06 | 8.35e-05 | 14 |
| GO:00510989 | Breast | Precancer | regulation of binding | 44/1080 | 363/18723 | 2.59e-06 | 8.65e-05 | 44 |
| Page: 1 2 3 4 5 6 7 8 9 10 11 12 13 14 15 16 17 18 19 20 21 22 23 24 25 26 27 28 29 30 31 32 33 34 35 36 37 38 39 40 |
| Pathway ID | Tissue | Disease Stage | Description | Gene Ratio | Bg Ratio | pvalue | p.adjust | qvalue | Count |
| hsa0520514 | Breast | Precancer | Proteoglycans in cancer | 30/684 | 205/8465 | 1.00e-03 | 7.18e-03 | 5.50e-03 | 30 |
| hsa0520515 | Breast | Precancer | Proteoglycans in cancer | 30/684 | 205/8465 | 1.00e-03 | 7.18e-03 | 5.50e-03 | 30 |
| hsa0520523 | Breast | IDC | Proteoglycans in cancer | 42/867 | 205/8465 | 7.69e-06 | 9.99e-05 | 7.48e-05 | 42 |
| hsa0520533 | Breast | IDC | Proteoglycans in cancer | 42/867 | 205/8465 | 7.69e-06 | 9.99e-05 | 7.48e-05 | 42 |
| hsa0520542 | Breast | DCIS | Proteoglycans in cancer | 39/846 | 205/8465 | 5.36e-05 | 5.58e-04 | 4.11e-04 | 39 |
| hsa0520552 | Breast | DCIS | Proteoglycans in cancer | 39/846 | 205/8465 | 5.36e-05 | 5.58e-04 | 4.11e-04 | 39 |
| hsa05205 | Colorectum | AD | Proteoglycans in cancer | 70/2092 | 205/8465 | 1.37e-03 | 8.46e-03 | 5.39e-03 | 70 |
| hsa052051 | Colorectum | AD | Proteoglycans in cancer | 70/2092 | 205/8465 | 1.37e-03 | 8.46e-03 | 5.39e-03 | 70 |
| hsa052052 | Colorectum | SER | Proteoglycans in cancer | 58/1580 | 205/8465 | 4.37e-04 | 3.82e-03 | 2.77e-03 | 58 |
| hsa052053 | Colorectum | SER | Proteoglycans in cancer | 58/1580 | 205/8465 | 4.37e-04 | 3.82e-03 | 2.77e-03 | 58 |
| hsa052054 | Colorectum | MSS | Proteoglycans in cancer | 65/1875 | 205/8465 | 8.66e-04 | 5.38e-03 | 3.29e-03 | 65 |
| hsa052055 | Colorectum | MSS | Proteoglycans in cancer | 65/1875 | 205/8465 | 8.66e-04 | 5.38e-03 | 3.29e-03 | 65 |
| hsa0520518 | Endometrium | AEH | Proteoglycans in cancer | 53/1197 | 205/8465 | 5.43e-06 | 6.53e-05 | 4.78e-05 | 53 |
| hsa0520519 | Endometrium | AEH | Proteoglycans in cancer | 53/1197 | 205/8465 | 5.43e-06 | 6.53e-05 | 4.78e-05 | 53 |
| hsa0520524 | Endometrium | EEC | Proteoglycans in cancer | 52/1237 | 205/8465 | 3.01e-05 | 3.19e-04 | 2.38e-04 | 52 |
| hsa0520534 | Endometrium | EEC | Proteoglycans in cancer | 52/1237 | 205/8465 | 3.01e-05 | 3.19e-04 | 2.38e-04 | 52 |
| hsa0520529 | Esophagus | ESCC | Proteoglycans in cancer | 138/4205 | 205/8465 | 1.79e-07 | 1.40e-06 | 7.15e-07 | 138 |
| hsa0520537 | Esophagus | ESCC | Proteoglycans in cancer | 138/4205 | 205/8465 | 1.79e-07 | 1.40e-06 | 7.15e-07 | 138 |
| hsa0520512 | Lung | IAC | Proteoglycans in cancer | 53/1053 | 205/8465 | 9.47e-08 | 6.16e-06 | 4.09e-06 | 53 |
| hsa0520513 | Lung | IAC | Proteoglycans in cancer | 53/1053 | 205/8465 | 9.47e-08 | 6.16e-06 | 4.09e-06 | 53 |
| Page: 1 2 |
Top |
Cell-cell communication analysis |
| Identification of potential cell-cell interactions between two cell types and their ligand-receptor pairs for different disease states |
| Ligand | Receptor | LRpair | Pathway | Tissue | Disease Stage |
| Page: 1 |
Top |
Single-cell gene regulatory network inference analysis |
| Find out the significant the regulons (TFs) and the target genes of each regulon across cell types for different disease states |
| TF | Cell Type | Tissue | Disease Stage | Target Gene | RSS | Regulon Activity |
| ∗The dot plots of a searched regulon are shown for all cell subpopulations in each disease state of each tissue based on the regulon specific score inferred using pySCENIC and by calculating the average expression. |
| Page: 1 |
Top |
Somatic mutation of malignant transformation related genes |
| Annotation of somatic variants for genes involved in malignant transformation |
| Hugo Symbol | Variant Class | Variant Classification | dbSNP RS | HGVSc | HGVSp | HGVSp Short | SWISSPROT | BIOTYPE | SIFT | PolyPhen | Tumor Sample Barcode | Tissue | Histology | Sex | Age | Stage | Therapy Types | Drugs | Outcome |
| PLAUR | SNV | Missense_Mutation | rs750492027 | c.829N>A | p.Ala277Thr | p.A277T | Q03405 | protein_coding | tolerated(0.19) | benign(0.018) | TCGA-AN-A0AK-01 | Breast | breast invasive carcinoma | Female | >=65 | I/II | Unknown | Unknown | SD |
| PLAUR | SNV | Missense_Mutation | c.198N>G | p.Ser66Arg | p.S66R | Q03405 | protein_coding | deleterious(0) | benign(0.284) | TCGA-AR-A24Q-01 | Breast | breast invasive carcinoma | Female | <65 | I/II | Chemotherapy | doxorubicin | SD | |
| PLAUR | insertion | In_Frame_Ins | novel | c.389_390insTCCCCTGGCCCCCATAGGGCGTCCAAAGGATGA | p.Gly130_Arg131insProLeuAlaProIleGlyArgProLysAspAsp | p.G130_R131insPLAPIGRPKDD | Q03405 | protein_coding | TCGA-A8-A09A-01 | Breast | breast invasive carcinoma | Female | <65 | I/II | Hormone Therapy | tamoxiphen | SD | ||
| PLAUR | SNV | Missense_Mutation | c.346G>A | p.Glu116Lys | p.E116K | Q03405 | protein_coding | deleterious(0.01) | probably_damaging(0.987) | TCGA-AA-A00N-01 | Colorectum | colon adenocarcinoma | Male | >=65 | I/II | Unknown | Unknown | PD | |
| PLAUR | SNV | Missense_Mutation | rs756038834 | c.814N>A | p.Ala272Thr | p.A272T | Q03405 | protein_coding | tolerated(0.3) | benign(0.042) | TCGA-NH-A5IV-01 | Colorectum | colon adenocarcinoma | Female | >=65 | I/II | Unknown | Unknown | SD |
| PLAUR | SNV | Missense_Mutation | c.118G>T | p.Ala40Ser | p.A40S | Q03405 | protein_coding | tolerated(0.21) | benign(0.028) | TCGA-AF-4110-01 | Colorectum | rectum adenocarcinoma | Male | >=65 | I/II | Chemotherapy | oxaliplatin | SD | |
| PLAUR | SNV | Missense_Mutation | novel | c.979N>A | p.Leu327Met | p.L327M | Q03405 | protein_coding | deleterious_low_confidence(0.02) | possibly_damaging(0.533) | TCGA-A5-A1OF-01 | Endometrium | uterine corpus endometrioid carcinoma | Female | <65 | I/II | Unknown | Unknown | SD |
| PLAUR | SNV | Missense_Mutation | novel | c.389N>A | p.Gly130Asp | p.G130D | Q03405 | protein_coding | deleterious(0.01) | benign(0.264) | TCGA-AJ-A23O-01 | Endometrium | uterine corpus endometrioid carcinoma | Female | >=65 | I/II | Unknown | Unknown | SD |
| PLAUR | SNV | Missense_Mutation | novel | c.668N>T | p.Ser223Ile | p.S223I | Q03405 | protein_coding | deleterious(0) | probably_damaging(0.959) | TCGA-AP-A051-01 | Endometrium | uterine corpus endometrioid carcinoma | Female | >=65 | I/II | Unknown | Unknown | SD |
| PLAUR | SNV | Missense_Mutation | c.252N>T | p.Lys84Asn | p.K84N | Q03405 | protein_coding | deleterious(0.03) | benign(0.213) | TCGA-AP-A059-01 | Endometrium | uterine corpus endometrioid carcinoma | Female | >=65 | I/II | Unknown | Unknown | SD |
| Page: 1 2 3 |
Top |
Related drugs of malignant transformation related genes |
| Identification of chemicals and drugs interact with genes involved in malignant transfromation |
| (DGIdb 4.0) |
| Entrez ID | Symbol | Category | Interaction Types | Drug Claim Name | Drug Name | PMIDs |
| 5329 | PLAUR | DRUGGABLE GENOME, ENZYME, CELL SURFACE | ADENOVIRAL VECTOR | 12955075 | ||
| 5329 | PLAUR | DRUGGABLE GENOME, ENZYME, CELL SURFACE | UROKINASE | UROKINASE | ||
| 5329 | PLAUR | DRUGGABLE GENOME, ENZYME, CELL SURFACE | RECOMBINANT INTERFERON GAMMA | 8049441 | ||
| 5329 | PLAUR | DRUGGABLE GENOME, ENZYME, CELL SURFACE | G-CSF | FILGRASTIM | 15747404 | |
| 5329 | PLAUR | DRUGGABLE GENOME, ENZYME, CELL SURFACE | MCP-2 | 12138365 | ||
| 5329 | PLAUR | DRUGGABLE GENOME, ENZYME, CELL SURFACE | DIPHTHERIA TOXIN | 11959893 | ||
| 5329 | PLAUR | DRUGGABLE GENOME, ENZYME, CELL SURFACE | Ruxolitinib | RUXOLITINIB | ||
| 5329 | PLAUR | DRUGGABLE GENOME, ENZYME, CELL SURFACE | PHORBOL MYRISTATE ACETATE | 9531044 |
| Page: 1 |

Copyright 2023-Present -The University of Texas Health Science Center at Houston |