
|
|||||
|
 | |
| |
| |
| |
| |
| |
|
Gene: PLAT |
Gene summary for PLAT |
| Gene information | Species | Human | Gene symbol | PLAT | Gene ID | 5327 |
| Gene name | plasminogen activator, tissue type | |
| Gene Alias | T-PA | |
| Cytomap | 8p11.21 | |
| Gene Type | protein-coding | GO ID | GO:0000003 | UniProtAcc | P00750 |
Top |
Malignant transformation analysis |
| Identification of the aberrant gene expression in precancerous and cancerous lesions by comparing the gene expression of stem-like cells in diseased tissues with normal stem cells |
| Entrez ID | Symbol | Replicates | Species | Organ | Tissue | Adj P-value | Log2FC | Malignancy |
| 5327 | PLAT | GSM4909281 | Human | Breast | IDC | 4.12e-06 | -2.30e-01 | 0.21 |
| 5327 | PLAT | GSM4909282 | Human | Breast | IDC | 3.85e-08 | -2.30e-01 | -0.0288 |
| 5327 | PLAT | GSM4909285 | Human | Breast | IDC | 1.71e-06 | -2.28e-01 | 0.21 |
| 5327 | PLAT | GSM4909286 | Human | Breast | IDC | 1.78e-08 | -2.32e-01 | 0.1081 |
| 5327 | PLAT | GSM4909287 | Human | Breast | IDC | 3.83e-03 | -2.06e-01 | 0.2057 |
| 5327 | PLAT | GSM4909290 | Human | Breast | IDC | 1.81e-04 | -2.34e-01 | 0.2096 |
| 5327 | PLAT | GSM4909293 | Human | Breast | IDC | 2.61e-02 | -2.02e-01 | 0.1581 |
| 5327 | PLAT | GSM4909296 | Human | Breast | IDC | 3.85e-08 | -2.29e-01 | 0.1524 |
| 5327 | PLAT | GSM4909298 | Human | Breast | IDC | 1.49e-02 | -2.04e-01 | 0.1551 |
| 5327 | PLAT | GSM4909301 | Human | Breast | IDC | 1.17e-15 | 5.86e-01 | 0.1577 |
| 5327 | PLAT | GSM4909304 | Human | Breast | IDC | 8.33e-05 | -2.25e-01 | 0.1636 |
| 5327 | PLAT | GSM4909307 | Human | Breast | IDC | 1.32e-10 | 5.06e-01 | 0.1569 |
| 5327 | PLAT | GSM4909308 | Human | Breast | IDC | 2.32e-58 | 1.00e+00 | 0.158 |
| 5327 | PLAT | GSM4909311 | Human | Breast | IDC | 2.70e-06 | -2.22e-01 | 0.1534 |
| 5327 | PLAT | GSM4909312 | Human | Breast | IDC | 3.85e-08 | -2.34e-01 | 0.1552 |
| 5327 | PLAT | GSM4909315 | Human | Breast | IDC | 3.85e-08 | -2.34e-01 | 0.21 |
| 5327 | PLAT | GSM4909319 | Human | Breast | IDC | 8.23e-09 | -2.34e-01 | 0.1563 |
| 5327 | PLAT | brca1 | Human | Breast | Precancer | 2.53e-04 | -2.05e-01 | -0.0338 |
| 5327 | PLAT | brca2 | Human | Breast | Precancer | 2.40e-09 | 4.53e-01 | -0.024 |
| 5327 | PLAT | M1 | Human | Breast | IDC | 5.20e-03 | -2.34e-01 | 0.1577 |
| Page: 1 2 3 4 5 |
| Tissue | Expression Dynamics | Abbreviation |
| Breast |  | IDC: Invasive ductal carcinoma |
| DCIS: Ductal carcinoma in situ | ||
| Precancer(BRCA1-mut): Precancerous lesion from BRCA1 mutation carriers | ||
| Esophagus | 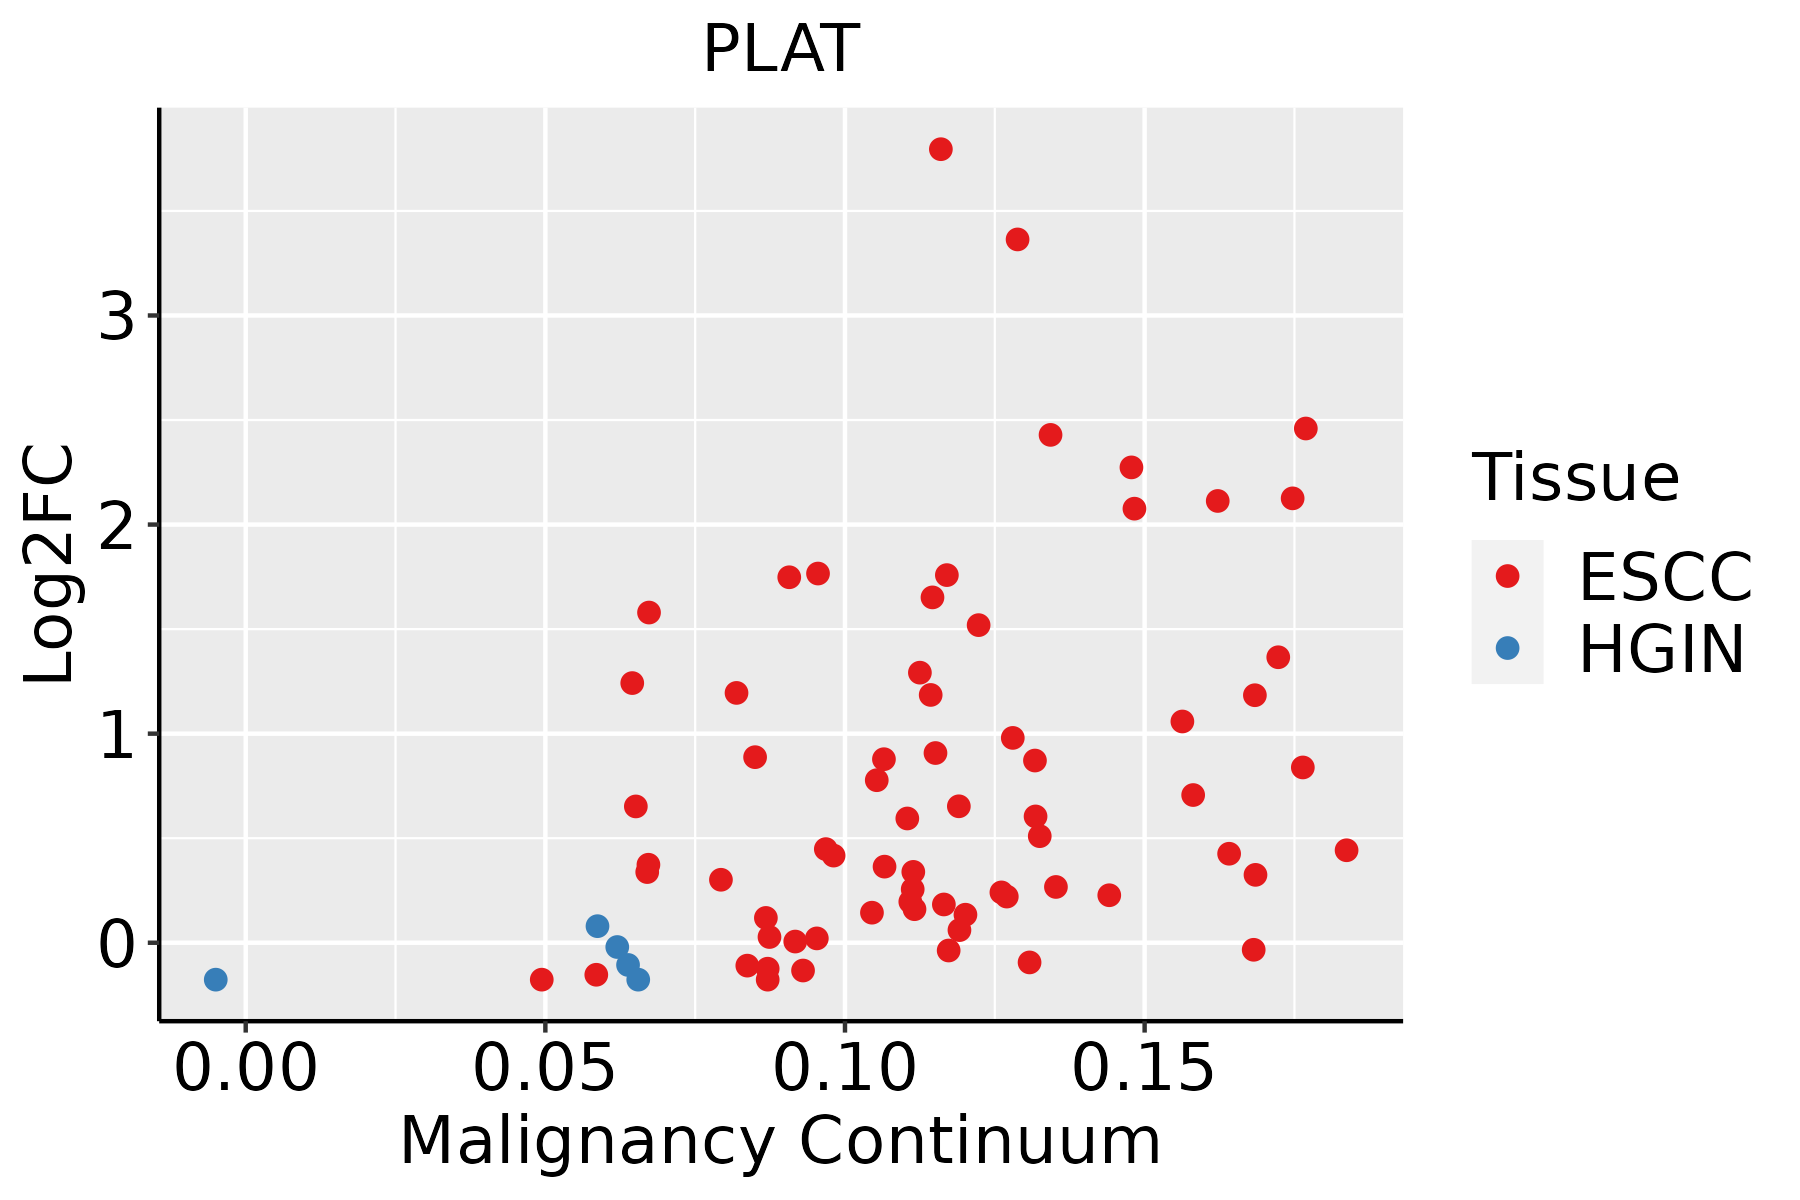 | ESCC: Esophageal squamous cell carcinoma |
| HGIN: High-grade intraepithelial neoplasias | ||
| LGIN: Low-grade intraepithelial neoplasias | ||
| Lung |  | AAH: Atypical adenomatous hyperplasia |
| AIS: Adenocarcinoma in situ | ||
| IAC: Invasive lung adenocarcinoma | ||
| MIA: Minimally invasive adenocarcinoma | ||
| Oral Cavity | 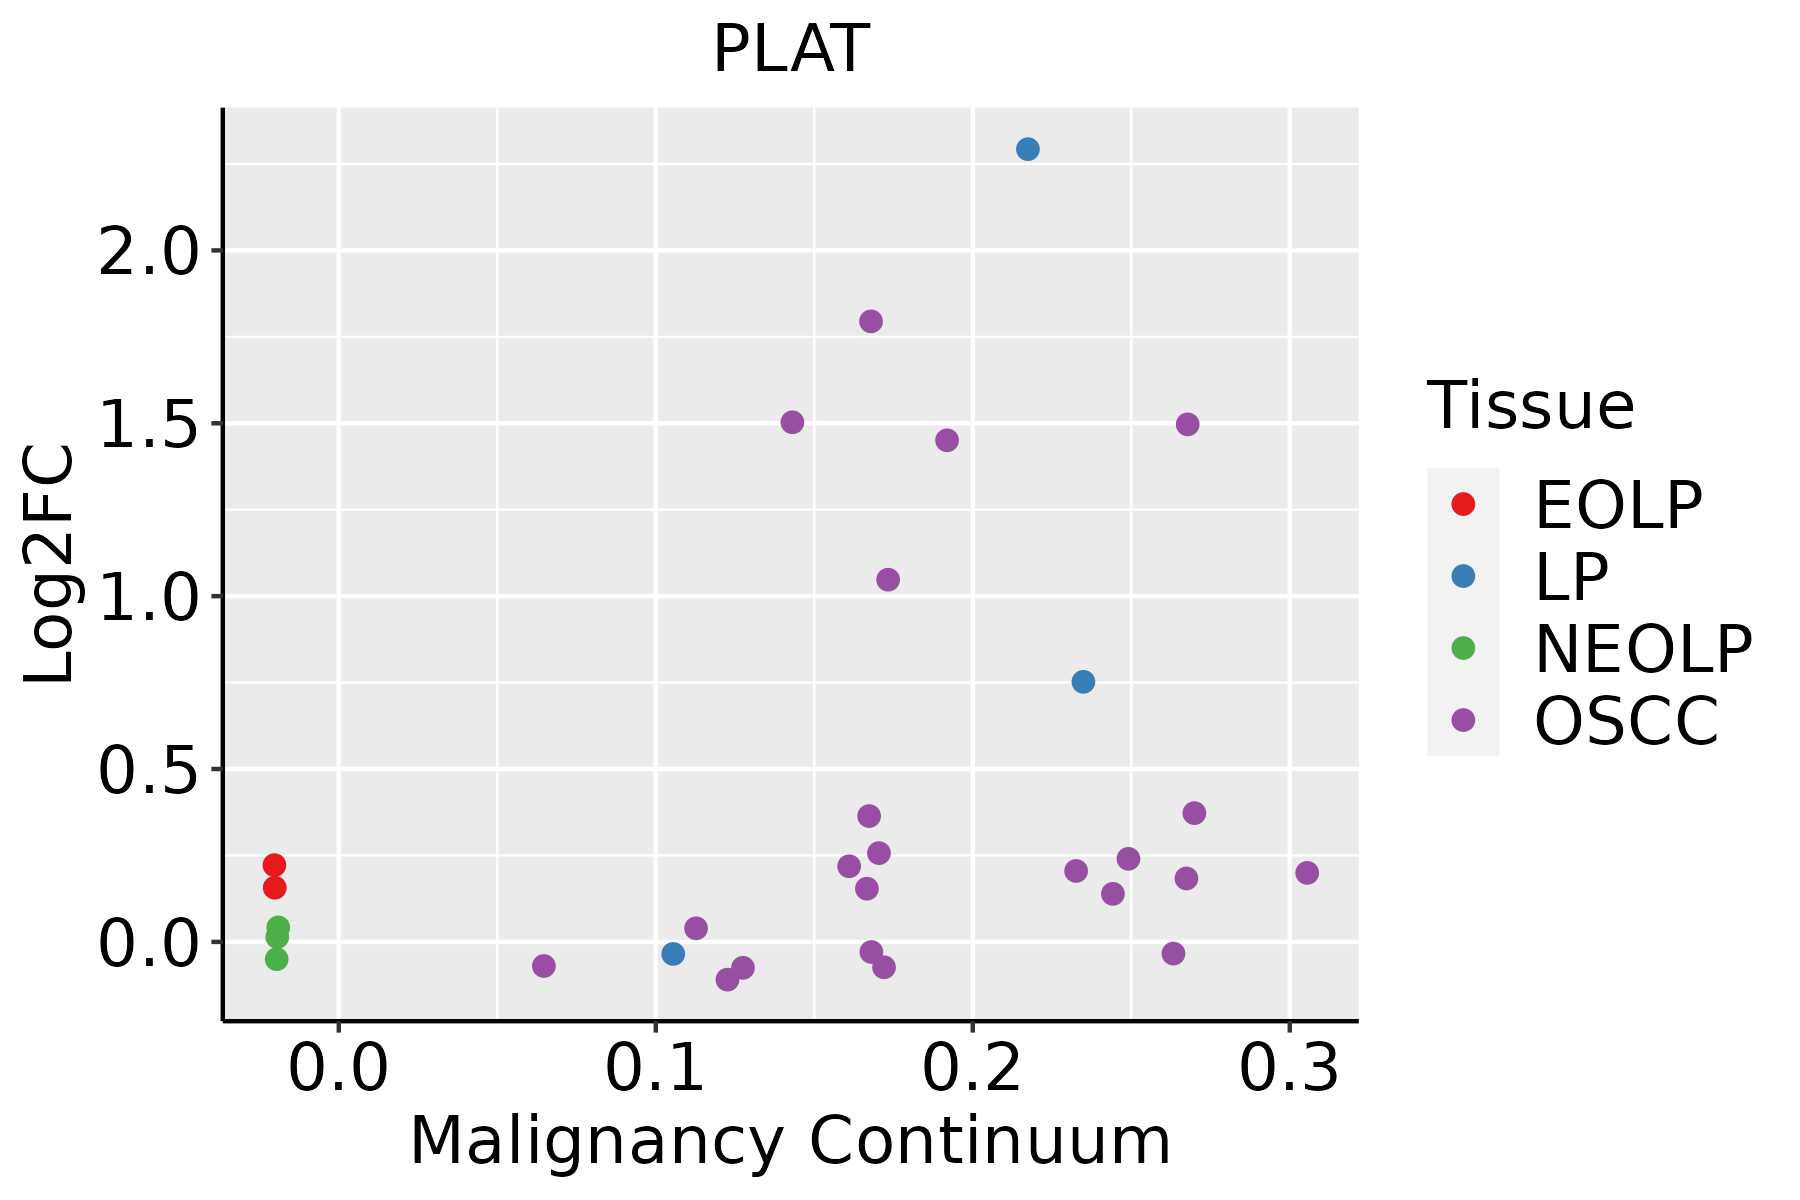 | EOLP: Erosive Oral lichen planus |
| LP: leukoplakia | ||
| NEOLP: Non-erosive oral lichen planus | ||
| OSCC: Oral squamous cell carcinoma | ||
| Prostate | 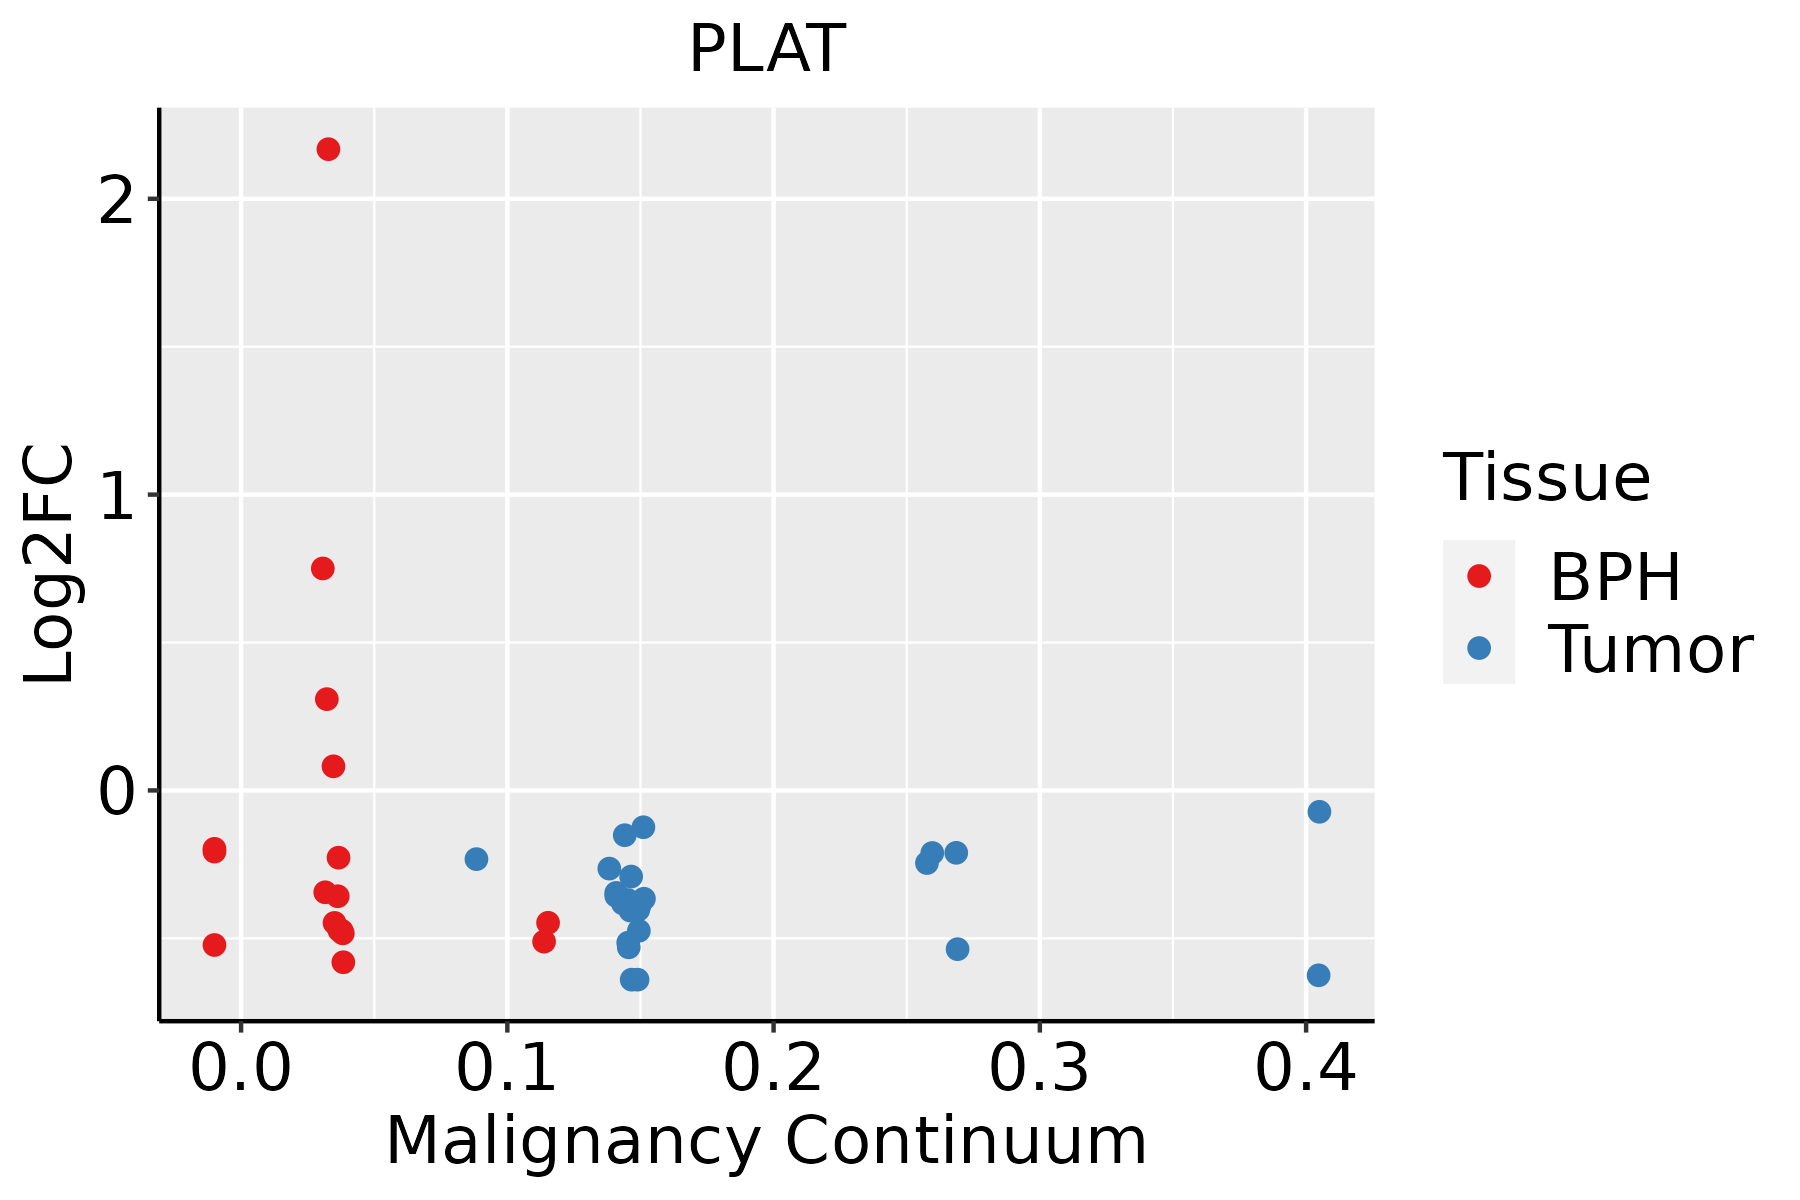 | BPH: Benign Prostatic Hyperplasia |
| Thyroid | 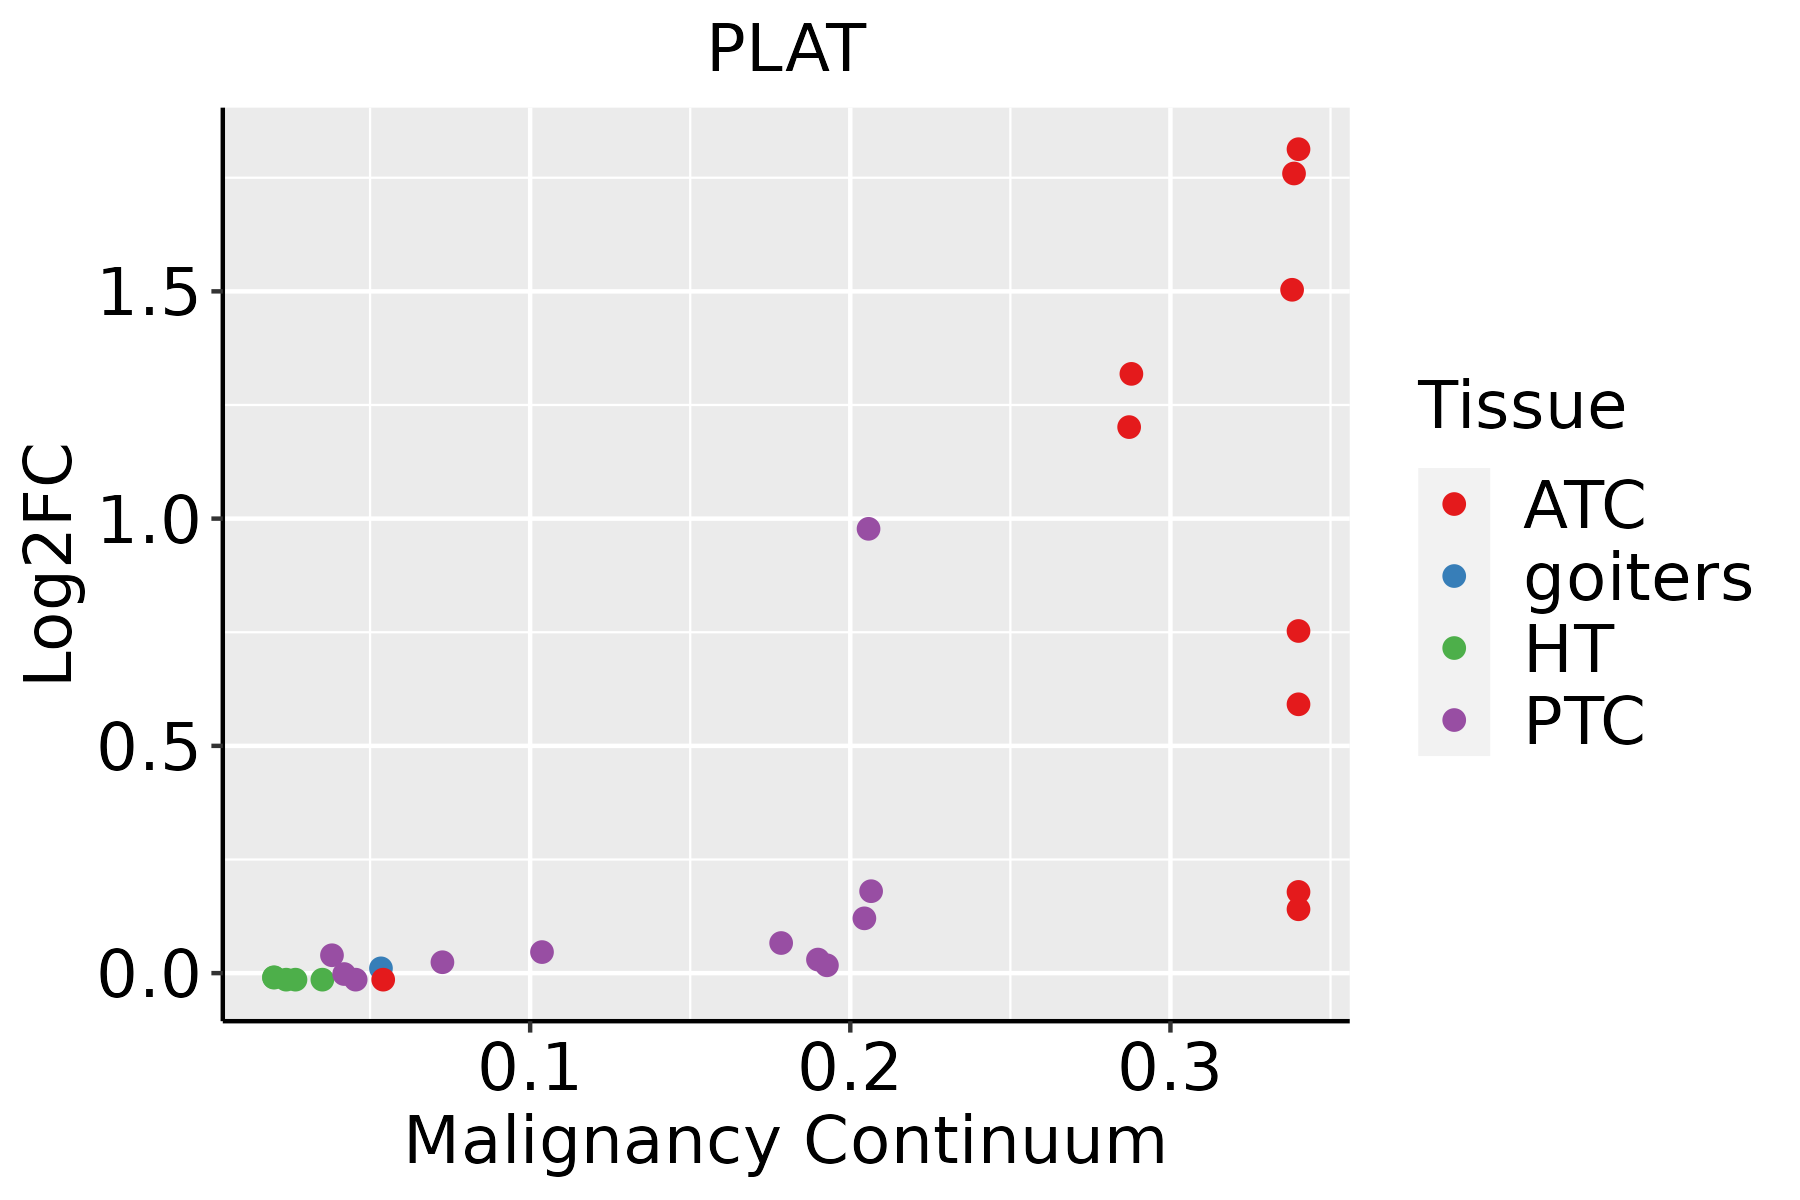 | ATC: Anaplastic thyroid cancer |
| HT: Hashimoto's thyroiditis | ||
| PTC: Papillary thyroid cancer |
| ∗log2FC in expression of this searched gene in stem-like cells from each diseased tissue sample relative to stem-like cells in normal samples in each tissue plotted against the malignancy continuum. Samples are colored based on if they are from different disease stage. |
Top |
Malignant transformation related pathway analysis |
| Find out the enriched GO biological processes and KEGG pathways involved in transition from healthy to precancer to cancer |
| Tissue | Disease Stage | Enriched GO biological Processes |
| Colorectum | AD |  |
| Colorectum | SER |  |
| Colorectum | MSS |  |
| Colorectum | MSI-H |  |
| Colorectum | FAP |  |
| ∗Top 15 enriched GO BP terms are showed in the bar plot of each disease state in each tissue. Each row represents a significant GO biological process which is colored according to the -log10(p.adjust). |
| Page: 1 2 3 4 5 6 7 8 9 |
| GO ID | Tissue | Disease Stage | Description | Gene Ratio | Bg Ratio | pvalue | p.adjust | Count |
| GO:00362939 | Breast | Precancer | response to decreased oxygen levels | 53/1080 | 322/18723 | 4.09e-12 | 6.84e-10 | 53 |
| GO:00016669 | Breast | Precancer | response to hypoxia | 51/1080 | 307/18723 | 7.33e-12 | 1.11e-09 | 51 |
| GO:00704829 | Breast | Precancer | response to oxygen levels | 55/1080 | 347/18723 | 7.47e-12 | 1.11e-09 | 55 |
| GO:00458619 | Breast | Precancer | negative regulation of proteolysis | 50/1080 | 351/18723 | 2.99e-09 | 2.39e-07 | 50 |
| GO:00420609 | Breast | Precancer | wound healing | 48/1080 | 422/18723 | 5.48e-06 | 1.63e-04 | 48 |
| GO:00508789 | Breast | Precancer | regulation of body fluid levels | 40/1080 | 379/18723 | 1.68e-04 | 2.77e-03 | 40 |
| GO:00316393 | Breast | Precancer | plasminogen activation | 6/1080 | 24/18723 | 1.99e-03 | 1.90e-02 | 6 |
| GO:00075995 | Breast | Precancer | hemostasis | 24/1080 | 222/18723 | 2.31e-03 | 2.15e-02 | 24 |
| GO:19030348 | Breast | Precancer | regulation of response to wounding | 19/1080 | 167/18723 | 3.60e-03 | 2.98e-02 | 19 |
| GO:00075965 | Breast | Precancer | blood coagulation | 23/1080 | 217/18723 | 3.61e-03 | 2.98e-02 | 23 |
| GO:00508175 | Breast | Precancer | coagulation | 23/1080 | 222/18723 | 4.78e-03 | 3.64e-02 | 23 |
| GO:00516047 | Breast | Precancer | protein maturation | 28/1080 | 294/18723 | 6.45e-03 | 4.50e-02 | 28 |
| GO:004586114 | Breast | IDC | negative regulation of proteolysis | 70/1434 | 351/18723 | 8.21e-14 | 2.22e-11 | 70 |
| GO:007048214 | Breast | IDC | response to oxygen levels | 64/1434 | 347/18723 | 3.45e-11 | 5.57e-09 | 64 |
| GO:003629314 | Breast | IDC | response to decreased oxygen levels | 60/1434 | 322/18723 | 9.26e-11 | 1.25e-08 | 60 |
| GO:000166614 | Breast | IDC | response to hypoxia | 58/1434 | 307/18723 | 1.09e-10 | 1.38e-08 | 58 |
| GO:004206014 | Breast | IDC | wound healing | 55/1434 | 422/18723 | 7.27e-05 | 1.45e-03 | 55 |
| GO:005087813 | Breast | IDC | regulation of body fluid levels | 50/1434 | 379/18723 | 1.12e-04 | 2.10e-03 | 50 |
| GO:190303413 | Breast | IDC | regulation of response to wounding | 24/1434 | 167/18723 | 2.07e-03 | 1.95e-02 | 24 |
| GO:005160413 | Breast | IDC | protein maturation | 35/1434 | 294/18723 | 6.18e-03 | 4.40e-02 | 35 |
| Page: 1 2 3 4 5 6 7 |
| Pathway ID | Tissue | Disease Stage | Description | Gene Ratio | Bg Ratio | pvalue | p.adjust | qvalue | Count |
| hsa0541818 | Breast | Precancer | Fluid shear stress and atherosclerosis | 28/684 | 139/8465 | 4.74e-06 | 6.00e-05 | 4.59e-05 | 28 |
| hsa0541819 | Breast | Precancer | Fluid shear stress and atherosclerosis | 28/684 | 139/8465 | 4.74e-06 | 6.00e-05 | 4.59e-05 | 28 |
| hsa0541824 | Breast | IDC | Fluid shear stress and atherosclerosis | 34/867 | 139/8465 | 9.41e-07 | 1.61e-05 | 1.20e-05 | 34 |
| hsa0541834 | Breast | IDC | Fluid shear stress and atherosclerosis | 34/867 | 139/8465 | 9.41e-07 | 1.61e-05 | 1.20e-05 | 34 |
| hsa0541844 | Breast | DCIS | Fluid shear stress and atherosclerosis | 34/846 | 139/8465 | 5.31e-07 | 9.03e-06 | 6.65e-06 | 34 |
| hsa0541854 | Breast | DCIS | Fluid shear stress and atherosclerosis | 34/846 | 139/8465 | 5.31e-07 | 9.03e-06 | 6.65e-06 | 34 |
| hsa05418211 | Esophagus | ESCC | Fluid shear stress and atherosclerosis | 109/4205 | 139/8465 | 2.00e-12 | 3.72e-11 | 1.90e-11 | 109 |
| hsa0521516 | Esophagus | ESCC | Prostate cancer | 72/4205 | 97/8465 | 6.12e-07 | 4.10e-06 | 2.10e-06 | 72 |
| hsa052028 | Esophagus | ESCC | Transcriptional misregulation in cancer | 116/4205 | 193/8465 | 2.08e-03 | 5.95e-03 | 3.05e-03 | 116 |
| hsa05418310 | Esophagus | ESCC | Fluid shear stress and atherosclerosis | 109/4205 | 139/8465 | 2.00e-12 | 3.72e-11 | 1.90e-11 | 109 |
| hsa0521517 | Esophagus | ESCC | Prostate cancer | 72/4205 | 97/8465 | 6.12e-07 | 4.10e-06 | 2.10e-06 | 72 |
| hsa0520213 | Esophagus | ESCC | Transcriptional misregulation in cancer | 116/4205 | 193/8465 | 2.08e-03 | 5.95e-03 | 3.05e-03 | 116 |
| hsa052022 | Lung | AIS | Transcriptional misregulation in cancer | 39/961 | 193/8465 | 2.15e-04 | 2.41e-03 | 1.54e-03 | 39 |
| hsa052023 | Lung | AIS | Transcriptional misregulation in cancer | 39/961 | 193/8465 | 2.15e-04 | 2.41e-03 | 1.54e-03 | 39 |
| hsa0541830 | Oral cavity | OSCC | Fluid shear stress and atherosclerosis | 92/3704 | 139/8465 | 6.51e-08 | 4.84e-07 | 2.47e-07 | 92 |
| hsa0521510 | Oral cavity | OSCC | Prostate cancer | 66/3704 | 97/8465 | 1.05e-06 | 5.89e-06 | 3.00e-06 | 66 |
| hsa05418114 | Oral cavity | OSCC | Fluid shear stress and atherosclerosis | 92/3704 | 139/8465 | 6.51e-08 | 4.84e-07 | 2.47e-07 | 92 |
| hsa0521515 | Oral cavity | OSCC | Prostate cancer | 66/3704 | 97/8465 | 1.05e-06 | 5.89e-06 | 3.00e-06 | 66 |
| hsa05418210 | Oral cavity | LP | Fluid shear stress and atherosclerosis | 65/2418 | 139/8465 | 3.42e-06 | 3.26e-05 | 2.10e-05 | 65 |
| hsa0541838 | Oral cavity | LP | Fluid shear stress and atherosclerosis | 65/2418 | 139/8465 | 3.42e-06 | 3.26e-05 | 2.10e-05 | 65 |
| Page: 1 2 |
Top |
Cell-cell communication analysis |
| Identification of potential cell-cell interactions between two cell types and their ligand-receptor pairs for different disease states |
| Ligand | Receptor | LRpair | Pathway | Tissue | Disease Stage |
| Page: 1 |
Top |
Single-cell gene regulatory network inference analysis |
| Find out the significant the regulons (TFs) and the target genes of each regulon across cell types for different disease states |
| TF | Cell Type | Tissue | Disease Stage | Target Gene | RSS | Regulon Activity |
| ∗The dot plots of a searched regulon are shown for all cell subpopulations in each disease state of each tissue based on the regulon specific score inferred using pySCENIC and by calculating the average expression. |
| Page: 1 |
Top |
Somatic mutation of malignant transformation related genes |
| Annotation of somatic variants for genes involved in malignant transformation |
| Hugo Symbol | Variant Class | Variant Classification | dbSNP RS | HGVSc | HGVSp | HGVSp Short | SWISSPROT | BIOTYPE | SIFT | PolyPhen | Tumor Sample Barcode | Tissue | Histology | Sex | Age | Stage | Therapy Types | Drugs | Outcome |
| PLAT | SNV | Missense_Mutation | c.1670N>C | p.Arg557Pro | p.R557P | P00750 | protein_coding | deleterious(0.04) | benign(0.105) | TCGA-A2-A04R-01 | Breast | breast invasive carcinoma | Female | <65 | I/II | Chemotherapy | taxol | SD | |
| PLAT | SNV | Missense_Mutation | c.72N>C | p.Gln24His | p.Q24H | P00750 | protein_coding | deleterious(0) | possibly_damaging(0.647) | TCGA-A8-A06X-01 | Breast | breast invasive carcinoma | Female | >=65 | I/II | Unknown | Unknown | SD | |
| PLAT | SNV | Missense_Mutation | novel | c.1519N>T | p.Asp507Tyr | p.D507Y | P00750 | protein_coding | deleterious(0) | probably_damaging(1) | TCGA-AC-A2QI-01 | Breast | breast invasive carcinoma | Female | >=65 | III/IV | Chemotherapy | cytoxan | CR |
| PLAT | SNV | Missense_Mutation | c.334N>A | p.Glu112Lys | p.E112K | P00750 | protein_coding | tolerated(0.47) | benign(0.009) | TCGA-AN-A046-01 | Breast | breast invasive carcinoma | Female | >=65 | I/II | Unknown | Unknown | SD | |
| PLAT | SNV | Missense_Mutation | rs760967419 | c.1016N>A | p.Arg339Gln | p.R339Q | P00750 | protein_coding | tolerated(0.44) | benign(0.051) | TCGA-AO-A128-01 | Breast | breast invasive carcinoma | Female | <65 | I/II | Chemotherapy | doxorubicin | SD |
| PLAT | SNV | Missense_Mutation | c.276N>A | p.Phe92Leu | p.F92L | P00750 | protein_coding | tolerated(0.61) | benign(0.013) | TCGA-E2-A1LH-01 | Breast | breast invasive carcinoma | Female | <65 | I/II | Chemotherapy | adriamycin | SD | |
| PLAT | SNV | Missense_Mutation | c.1061N>G | p.Ser354Cys | p.S354C | P00750 | protein_coding | deleterious(0) | probably_damaging(0.985) | TCGA-EK-A2PM-01 | Cervix | cervical & endocervical cancer | Female | >=65 | I/II | Unknown | Unknown | SD | |
| PLAT | SNV | Missense_Mutation | c.334N>A | p.Glu112Lys | p.E112K | P00750 | protein_coding | tolerated(0.47) | benign(0.009) | TCGA-EK-A3GK-01 | Cervix | cervical & endocervical cancer | Female | <65 | I/II | Unknown | Unknown | SD | |
| PLAT | SNV | Missense_Mutation | rs114534719 | c.1411N>C | p.Tyr471His | p.Y471H | P00750 | protein_coding | deleterious(0.05) | probably_damaging(0.983) | TCGA-5M-AATA-01 | Colorectum | colon adenocarcinoma | Unknown | Unknown | I/II | Unknown | Unknown | Unknown |
| PLAT | SNV | Missense_Mutation | c.257N>A | p.Cys86Tyr | p.C86Y | P00750 | protein_coding | deleterious(0) | probably_damaging(0.997) | TCGA-A6-5665-01 | Colorectum | colon adenocarcinoma | Female | >=65 | I/II | Unknown | Unknown | PD |
| Page: 1 2 3 4 5 6 7 |
Top |
Related drugs of malignant transformation related genes |
| Identification of chemicals and drugs interact with genes involved in malignant transfromation |
| (DGIdb 4.0) |
| Entrez ID | Symbol | Category | Interaction Types | Drug Claim Name | Drug Name | PMIDs |
| 5327 | PLAT | ENZYME, DRUGGABLE GENOME, PROTEASE, CELL SURFACE | LYMPHOKINES | 7586221 | ||
| 5327 | PLAT | ENZYME, DRUGGABLE GENOME, PROTEASE, CELL SURFACE | MELPHALAN | MELPHALAN | 9031449 | |
| 5327 | PLAT | ENZYME, DRUGGABLE GENOME, PROTEASE, CELL SURFACE | ORAL CONTRACEPTIVE | 8392873,12388132 | ||
| 5327 | PLAT | ENZYME, DRUGGABLE GENOME, PROTEASE, CELL SURFACE | BORTEZOMIB | BORTEZOMIB | 20875739 | |
| 5327 | PLAT | ENZYME, DRUGGABLE GENOME, PROTEASE, CELL SURFACE | NAPROXEN | NAPROXEN | 1908176 | |
| 5327 | PLAT | ENZYME, DRUGGABLE GENOME, PROTEASE, CELL SURFACE | UROKINASE | UROKINASE | ||
| 5327 | PLAT | ENZYME, DRUGGABLE GENOME, PROTEASE, CELL SURFACE | inhibitor | 252827418 | CHEMBL290376 | |
| 5327 | PLAT | ENZYME, DRUGGABLE GENOME, PROTEASE, CELL SURFACE | TRANEXAMIC ACID | |||
| 5327 | PLAT | ENZYME, DRUGGABLE GENOME, PROTEASE, CELL SURFACE | TRANEXAMIC ACID | |||
| 5327 | PLAT | ENZYME, DRUGGABLE GENOME, PROTEASE, CELL SURFACE | ERYTHROPOIETIN | EPOETIN BETA | 10682118 |
| Page: 1 2 |

Copyright 2023-Present -The University of Texas Health Science Center at Houston |