
|
|||||
|
 | |
| |
| |
| |
| |
| |
|
Gene: PLAGL2 |
Gene summary for PLAGL2 |
| Gene information | Species | Human | Gene symbol | PLAGL2 | Gene ID | 5326 |
| Gene name | PLAG1 like zinc finger 2 | |
| Gene Alias | ZNF900 | |
| Cytomap | 20q11.21 | |
| Gene Type | protein-coding | GO ID | GO:0006139 | UniProtAcc | Q9UPG8 |
Top |
Malignant transformation analysis |
| Identification of the aberrant gene expression in precancerous and cancerous lesions by comparing the gene expression of stem-like cells in diseased tissues with normal stem cells |
| Entrez ID | Symbol | Replicates | Species | Organ | Tissue | Adj P-value | Log2FC | Malignancy |
| 5326 | PLAGL2 | LZE24T | Human | Esophagus | ESCC | 1.54e-18 | 5.16e-01 | 0.0596 |
| 5326 | PLAGL2 | P1T-E | Human | Esophagus | ESCC | 1.64e-02 | 1.67e-01 | 0.0875 |
| 5326 | PLAGL2 | P2T-E | Human | Esophagus | ESCC | 2.04e-13 | 2.57e-01 | 0.1177 |
| 5326 | PLAGL2 | P4T-E | Human | Esophagus | ESCC | 1.85e-08 | 2.72e-01 | 0.1323 |
| 5326 | PLAGL2 | P5T-E | Human | Esophagus | ESCC | 5.08e-11 | 1.87e-01 | 0.1327 |
| 5326 | PLAGL2 | P8T-E | Human | Esophagus | ESCC | 7.38e-24 | 6.21e-01 | 0.0889 |
| 5326 | PLAGL2 | P9T-E | Human | Esophagus | ESCC | 3.90e-02 | 1.20e-01 | 0.1131 |
| 5326 | PLAGL2 | P10T-E | Human | Esophagus | ESCC | 5.06e-18 | 2.54e-01 | 0.116 |
| 5326 | PLAGL2 | P11T-E | Human | Esophagus | ESCC | 3.69e-02 | 1.81e-01 | 0.1426 |
| 5326 | PLAGL2 | P12T-E | Human | Esophagus | ESCC | 4.14e-20 | 3.90e-01 | 0.1122 |
| 5326 | PLAGL2 | P15T-E | Human | Esophagus | ESCC | 5.26e-18 | 2.90e-01 | 0.1149 |
| 5326 | PLAGL2 | P16T-E | Human | Esophagus | ESCC | 1.93e-17 | 1.79e-01 | 0.1153 |
| 5326 | PLAGL2 | P20T-E | Human | Esophagus | ESCC | 2.07e-06 | 1.71e-01 | 0.1124 |
| 5326 | PLAGL2 | P21T-E | Human | Esophagus | ESCC | 3.76e-14 | 2.94e-01 | 0.1617 |
| 5326 | PLAGL2 | P22T-E | Human | Esophagus | ESCC | 5.55e-10 | 1.05e-01 | 0.1236 |
| 5326 | PLAGL2 | P23T-E | Human | Esophagus | ESCC | 4.97e-14 | 3.63e-01 | 0.108 |
| 5326 | PLAGL2 | P24T-E | Human | Esophagus | ESCC | 8.90e-06 | 7.03e-02 | 0.1287 |
| 5326 | PLAGL2 | P26T-E | Human | Esophagus | ESCC | 8.03e-32 | 5.84e-01 | 0.1276 |
| 5326 | PLAGL2 | P27T-E | Human | Esophagus | ESCC | 1.88e-14 | 1.64e-01 | 0.1055 |
| 5326 | PLAGL2 | P28T-E | Human | Esophagus | ESCC | 6.61e-35 | 7.55e-01 | 0.1149 |
| Page: 1 2 3 4 |
| Tissue | Expression Dynamics | Abbreviation |
| Esophagus | 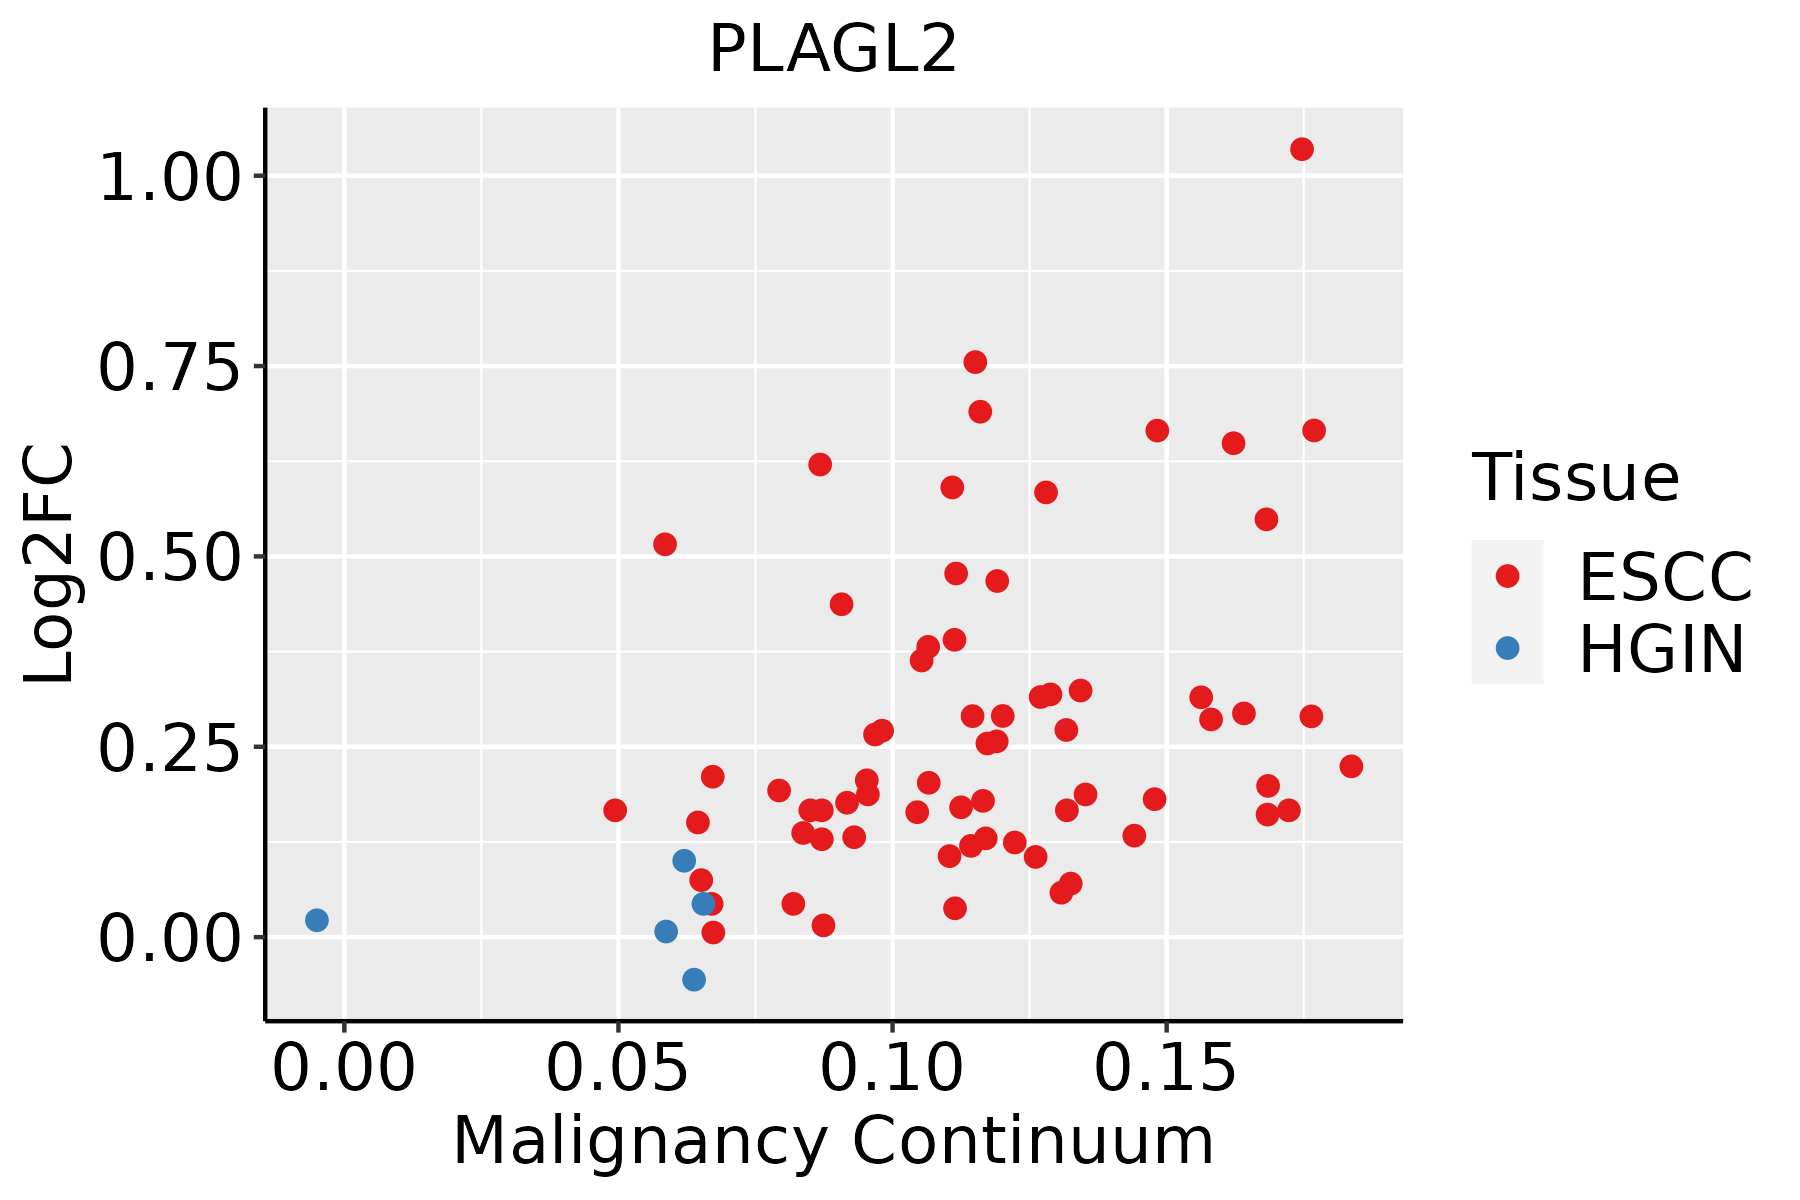 | ESCC: Esophageal squamous cell carcinoma |
| HGIN: High-grade intraepithelial neoplasias | ||
| LGIN: Low-grade intraepithelial neoplasias | ||
| Oral Cavity | 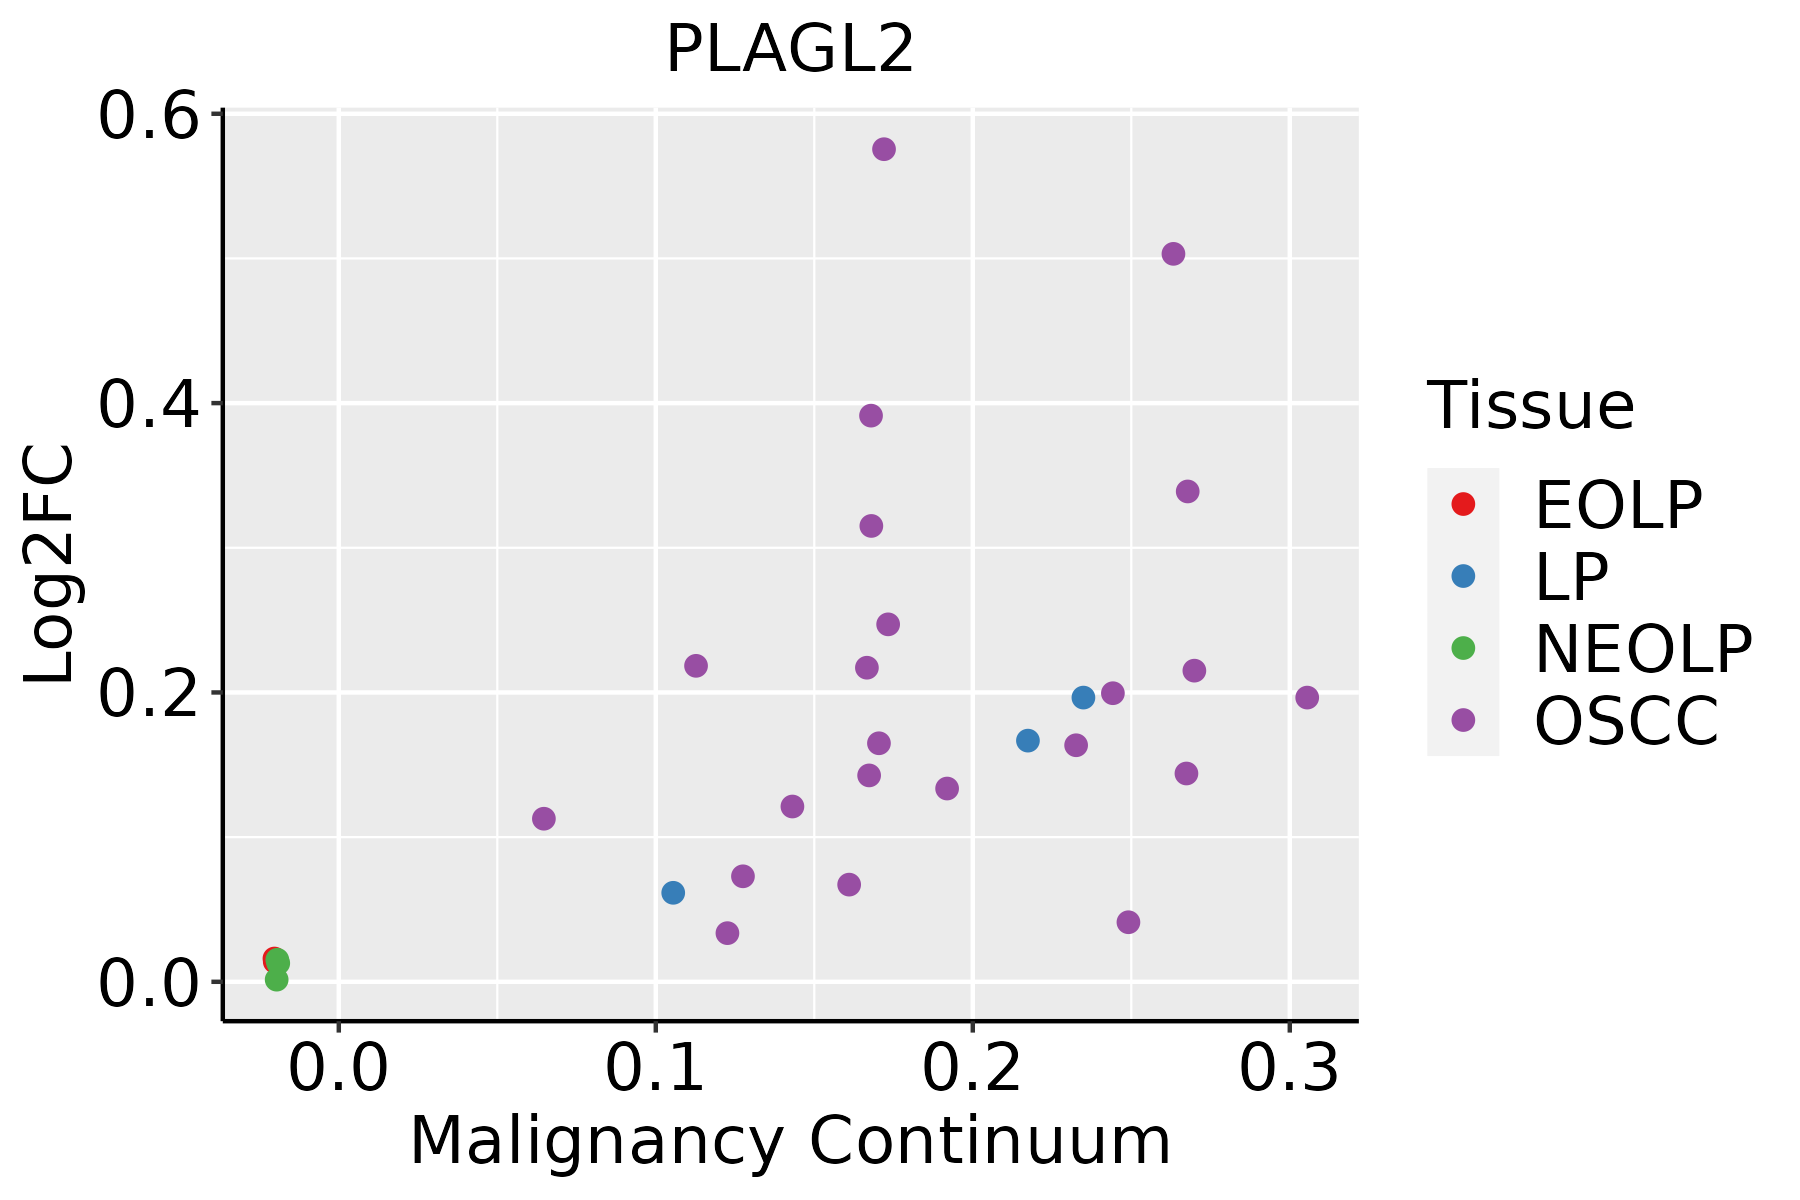 | EOLP: Erosive Oral lichen planus |
| LP: leukoplakia | ||
| NEOLP: Non-erosive oral lichen planus | ||
| OSCC: Oral squamous cell carcinoma |
| ∗log2FC in expression of this searched gene in stem-like cells from each diseased tissue sample relative to stem-like cells in normal samples in each tissue plotted against the malignancy continuum. Samples are colored based on if they are from different disease stage. |
Top |
Malignant transformation related pathway analysis |
| Find out the enriched GO biological processes and KEGG pathways involved in transition from healthy to precancer to cancer |
| Tissue | Disease Stage | Enriched GO biological Processes |
| Colorectum | AD |  |
| Colorectum | SER |  |
| Colorectum | MSS |  |
| Colorectum | MSI-H |  |
| Colorectum | FAP |  |
| ∗Top 15 enriched GO BP terms are showed in the bar plot of each disease state in each tissue. Each row represents a significant GO biological process which is colored according to the -log10(p.adjust). |
| Page: 1 2 3 4 5 6 7 8 9 |
| GO ID | Tissue | Disease Stage | Description | Gene Ratio | Bg Ratio | pvalue | p.adjust | Count |
| GO:0097193111 | Esophagus | ESCC | intrinsic apoptotic signaling pathway | 222/8552 | 288/18723 | 5.87e-28 | 2.02e-25 | 222 |
| GO:2001233111 | Esophagus | ESCC | regulation of apoptotic signaling pathway | 256/8552 | 356/18723 | 4.11e-24 | 1.04e-21 | 256 |
| GO:2001242111 | Esophagus | ESCC | regulation of intrinsic apoptotic signaling pathway | 128/8552 | 164/18723 | 1.75e-17 | 1.50e-15 | 128 |
| GO:2001235110 | Esophagus | ESCC | positive regulation of apoptotic signaling pathway | 92/8552 | 126/18723 | 3.91e-10 | 1.05e-08 | 92 |
| GO:00097919 | Esophagus | ESCC | post-embryonic development | 56/8552 | 80/18723 | 9.08e-06 | 8.71e-05 | 56 |
| GO:200124417 | Esophagus | ESCC | positive regulation of intrinsic apoptotic signaling pathway | 43/8552 | 58/18723 | 9.86e-06 | 9.37e-05 | 43 |
| GO:200123320 | Oral cavity | OSCC | regulation of apoptotic signaling pathway | 242/7305 | 356/18723 | 6.66e-29 | 3.24e-26 | 242 |
| GO:009719320 | Oral cavity | OSCC | intrinsic apoptotic signaling pathway | 202/7305 | 288/18723 | 4.64e-27 | 1.73e-24 | 202 |
| GO:200124220 | Oral cavity | OSCC | regulation of intrinsic apoptotic signaling pathway | 123/7305 | 164/18723 | 5.71e-21 | 9.77e-19 | 123 |
| GO:200123510 | Oral cavity | OSCC | positive regulation of apoptotic signaling pathway | 92/7305 | 126/18723 | 8.45e-15 | 5.19e-13 | 92 |
| GO:20012449 | Oral cavity | OSCC | positive regulation of intrinsic apoptotic signaling pathway | 44/7305 | 58/18723 | 1.22e-08 | 2.48e-07 | 44 |
| GO:00097918 | Oral cavity | OSCC | post-embryonic development | 51/7305 | 80/18723 | 6.43e-06 | 7.13e-05 | 51 |
| Page: 1 |
| Pathway ID | Tissue | Disease Stage | Description | Gene Ratio | Bg Ratio | pvalue | p.adjust | qvalue | Count |
| Page: 1 |
Top |
Cell-cell communication analysis |
| Identification of potential cell-cell interactions between two cell types and their ligand-receptor pairs for different disease states |
| Ligand | Receptor | LRpair | Pathway | Tissue | Disease Stage |
| Page: 1 |
Top |
Single-cell gene regulatory network inference analysis |
| Find out the significant the regulons (TFs) and the target genes of each regulon across cell types for different disease states |
| TF | Cell Type | Tissue | Disease Stage | Target Gene | RSS | Regulon Activity |
| PLAGL2 | TREG | Breast | DCIS | MMD,GPR132,ERCC6L2, etc. | 1.84e-01 |  |
| PLAGL2 | CAF | Breast | Precancer | RNMTL1,TAB3,EPG5, etc. | 2.28e-01 |  |
| PLAGL2 | TREG | Endometrium | AEH | DMAP1,PTP4A3,B3GALT6, etc. | 1.55e-01 |  |
| PLAGL2 | TREG | Endometrium | EEC | DMAP1,PTP4A3,B3GALT6, etc. | 1.41e-01 |  |
| PLAGL2 | CLUB | Lung | AAH | S100P,SCUBE3,GSTT2B, etc. | 3.33e-01 |  |
| PLAGL2 | CLUB | Lung | ADJ | S100P,SCUBE3,GSTT2B, etc. | 3.70e-01 |  |
| PLAGL2 | CLUB | Lung | AIS | S100P,SCUBE3,GSTT2B, etc. | 7.33e-02 |  |
| PLAGL2 | AT2 | Lung | MIAC | S100P,SCUBE3,GSTT2B, etc. | 2.85e-01 |  |
| PLAGL2 | CLUB | Lung | MIAC | S100P,SCUBE3,GSTT2B, etc. | 9.60e-02 | |
| PLAGL2 | INMON | Lung | AIS | APOBEC3A,EMP2,TIMP1, etc. | 9.21e-02 | |
| ∗The dot plots of a searched regulon are shown for all cell subpopulations in each disease state of each tissue based on the regulon specific score inferred using pySCENIC and by calculating the average expression. |
| Page: 1 2 3 |
Top |
Somatic mutation of malignant transformation related genes |
| Annotation of somatic variants for genes involved in malignant transformation |
| Hugo Symbol | Variant Class | Variant Classification | dbSNP RS | HGVSc | HGVSp | HGVSp Short | SWISSPROT | BIOTYPE | SIFT | PolyPhen | Tumor Sample Barcode | Tissue | Histology | Sex | Age | Stage | Therapy Types | Drugs | Outcome |
| PLAGL2 | SNV | Missense_Mutation | c.1087C>G | p.Leu363Val | p.L363V | Q9UPG8 | protein_coding | tolerated(0.16) | probably_damaging(0.952) | TCGA-A2-A0EY-01 | Breast | breast invasive carcinoma | Female | <65 | I/II | Chemotherapy | adriamycin | SD | |
| PLAGL2 | SNV | Missense_Mutation | novel | c.1160C>A | p.Ala387Asp | p.A387D | Q9UPG8 | protein_coding | tolerated(0.63) | benign(0.122) | TCGA-C8-A274-01 | Breast | breast invasive carcinoma | Female | <65 | I/II | Hormone Therapy | tamoxiphen | SD |
| PLAGL2 | SNV | Missense_Mutation | c.811N>A | p.Glu271Lys | p.E271K | Q9UPG8 | protein_coding | deleterious(0.01) | probably_damaging(0.993) | TCGA-FU-A23L-01 | Cervix | cervical & endocervical cancer | Female | <65 | I/II | Chemotherapy | cisplatin | CR | |
| PLAGL2 | SNV | Missense_Mutation | c.190N>C | p.Glu64Gln | p.E64Q | Q9UPG8 | protein_coding | deleterious(0.01) | benign(0.284) | TCGA-DM-A28F-01 | Colorectum | colon adenocarcinoma | Male | >=65 | III/IV | Unknown | Unknown | SD | |
| PLAGL2 | SNV | Missense_Mutation | rs760161049 | c.1063N>T | p.Pro355Ser | p.P355S | Q9UPG8 | protein_coding | tolerated(0.7) | benign(0.227) | TCGA-F4-6461-01 | Colorectum | colon adenocarcinoma | Female | <65 | III/IV | Unknown | Unknown | PD |
| PLAGL2 | SNV | Missense_Mutation | rs745622775 | c.923N>T | p.Thr308Met | p.T308M | Q9UPG8 | protein_coding | tolerated(0.09) | benign(0.39) | TCGA-A5-A0G2-01 | Endometrium | uterine corpus endometrioid carcinoma | Female | <65 | III/IV | Unknown | Unknown | SD |
| PLAGL2 | SNV | Missense_Mutation | novel | c.54N>T | p.Glu18Asp | p.E18D | Q9UPG8 | protein_coding | tolerated_low_confidence(0.51) | benign(0.161) | TCGA-A5-A0G2-01 | Endometrium | uterine corpus endometrioid carcinoma | Female | <65 | III/IV | Unknown | Unknown | SD |
| PLAGL2 | SNV | Missense_Mutation | c.1306N>T | p.Gly436Cys | p.G436C | Q9UPG8 | protein_coding | deleterious(0.01) | possibly_damaging(0.907) | TCGA-AP-A0LM-01 | Endometrium | uterine corpus endometrioid carcinoma | Female | <65 | III/IV | Chemotherapy | cisplatin | SD | |
| PLAGL2 | SNV | Missense_Mutation | rs781462741 | c.1123N>A | p.Ala375Thr | p.A375T | Q9UPG8 | protein_coding | tolerated(0.6) | benign(0.012) | TCGA-AP-A0LM-01 | Endometrium | uterine corpus endometrioid carcinoma | Female | <65 | III/IV | Chemotherapy | cisplatin | SD |
| PLAGL2 | SNV | Missense_Mutation | rs145582553 | c.1468C>T | p.Arg490Cys | p.R490C | Q9UPG8 | protein_coding | deleterious(0) | probably_damaging(0.991) | TCGA-AX-A05Y-01 | Endometrium | uterine corpus endometrioid carcinoma | Female | <65 | I/II | Unknown | Unknown | PD |
| Page: 1 2 3 4 |
Top |
Related drugs of malignant transformation related genes |
| Identification of chemicals and drugs interact with genes involved in malignant transfromation |
| (DGIdb 4.0) |
| Entrez ID | Symbol | Category | Interaction Types | Drug Claim Name | Drug Name | PMIDs |
| Page: 1 |

Copyright 2023-Present -The University of Texas Health Science Center at Houston |