
|
|||||
|
 | |
| |
| |
| |
| |
| |
|
Gene: PLAC9 |
Gene summary for PLAC9 |
| Gene information | Species | Human | Gene symbol | PLAC9 | Gene ID | 219348 |
| Gene name | placenta associated 9 | |
| Gene Alias | PLAC9 | |
| Cytomap | 10q22.3 | |
| Gene Type | protein-coding | GO ID | GO:0005575 | UniProtAcc | Q5JTB6 |
Top |
Malignant transformation analysis |
| Identification of the aberrant gene expression in precancerous and cancerous lesions by comparing the gene expression of stem-like cells in diseased tissues with normal stem cells |
| Entrez ID | Symbol | Replicates | Species | Organ | Tissue | Adj P-value | Log2FC | Malignancy |
| 219348 | PLAC9 | LZE2T | Human | Esophagus | ESCC | 3.86e-23 | 7.97e-01 | 0.082 |
| 219348 | PLAC9 | LZE24T | Human | Esophagus | ESCC | 3.99e-03 | -2.62e-01 | 0.0596 |
| 219348 | PLAC9 | P1T-E | Human | Esophagus | ESCC | 3.17e-02 | -1.64e-01 | 0.0875 |
| 219348 | PLAC9 | P4T-E | Human | Esophagus | ESCC | 1.20e-03 | 1.57e-01 | 0.1323 |
| 219348 | PLAC9 | P16T-E | Human | Esophagus | ESCC | 8.40e-04 | -2.67e-01 | 0.1153 |
| 219348 | PLAC9 | P21T-E | Human | Esophagus | ESCC | 5.21e-04 | -2.61e-01 | 0.1617 |
| 219348 | PLAC9 | P26T-E | Human | Esophagus | ESCC | 2.11e-02 | -2.55e-01 | 0.1276 |
| 219348 | PLAC9 | P31T-E | Human | Esophagus | ESCC | 2.12e-02 | -2.34e-01 | 0.1251 |
| 219348 | PLAC9 | P36T-E | Human | Esophagus | ESCC | 9.56e-04 | -2.26e-01 | 0.1187 |
| 219348 | PLAC9 | P37T-E | Human | Esophagus | ESCC | 2.28e-04 | -2.15e-01 | 0.1371 |
| 219348 | PLAC9 | P40T-E | Human | Esophagus | ESCC | 3.68e-02 | -2.47e-01 | 0.109 |
| 219348 | PLAC9 | P47T-E | Human | Esophagus | ESCC | 1.25e-03 | -2.06e-01 | 0.1067 |
| 219348 | PLAC9 | P52T-E | Human | Esophagus | ESCC | 9.12e-05 | -2.56e-01 | 0.1555 |
| 219348 | PLAC9 | P54T-E | Human | Esophagus | ESCC | 5.10e-04 | -2.55e-01 | 0.0975 |
| 219348 | PLAC9 | P62T-E | Human | Esophagus | ESCC | 3.86e-02 | -2.40e-01 | 0.1302 |
| 219348 | PLAC9 | P65T-E | Human | Esophagus | ESCC | 6.85e-03 | 3.91e-02 | 0.0978 |
| 219348 | PLAC9 | P74T-E | Human | Esophagus | ESCC | 3.71e-04 | 4.38e-01 | 0.1479 |
| 219348 | PLAC9 | P76T-E | Human | Esophagus | ESCC | 7.23e-03 | -2.62e-01 | 0.1207 |
| 219348 | PLAC9 | P127T-E | Human | Esophagus | ESCC | 8.42e-06 | -2.65e-01 | 0.0826 |
| 219348 | PLAC9 | P128T-E | Human | Esophagus | ESCC | 5.01e-10 | -2.17e-02 | 0.1241 |
| Page: 1 2 3 |
| Tissue | Expression Dynamics | Abbreviation |
| Esophagus | 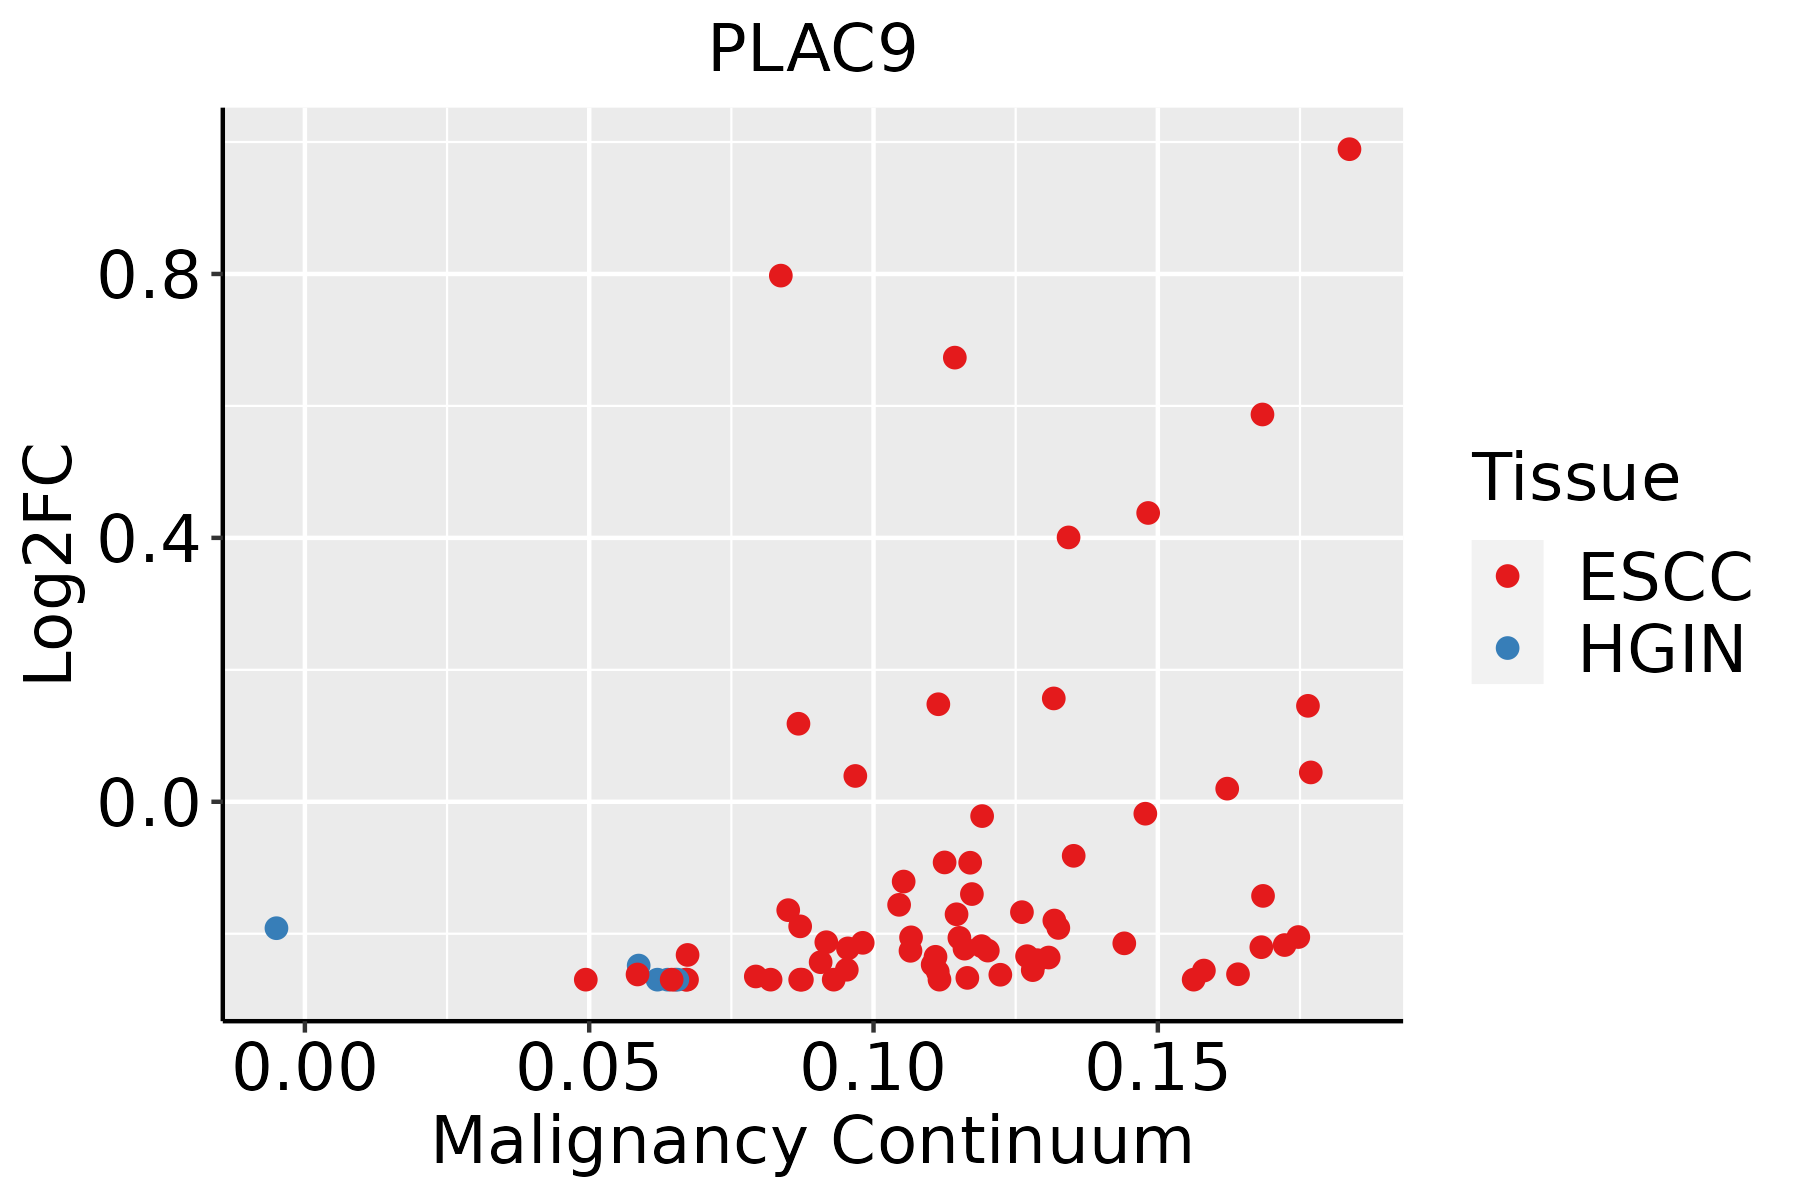 | ESCC: Esophageal squamous cell carcinoma |
| HGIN: High-grade intraepithelial neoplasias | ||
| LGIN: Low-grade intraepithelial neoplasias | ||
| Oral Cavity | 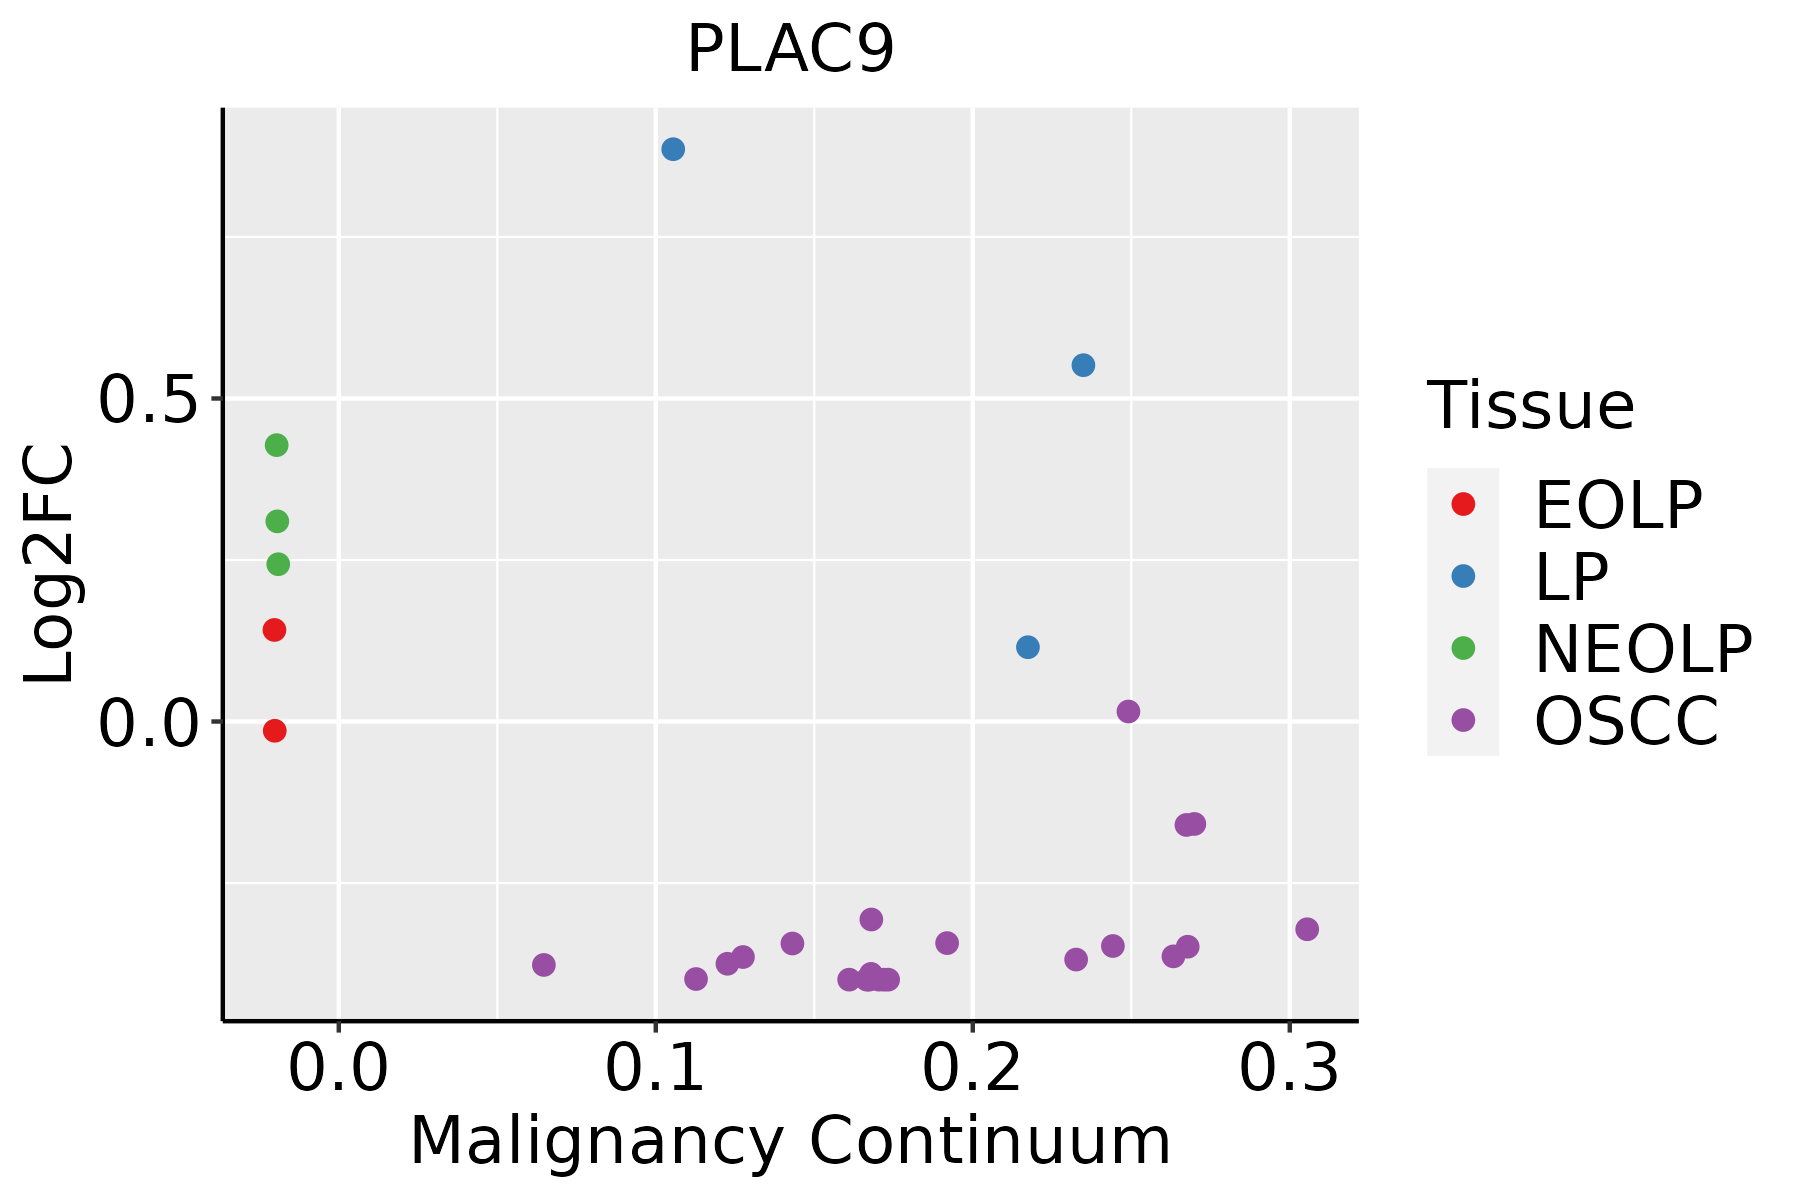 | EOLP: Erosive Oral lichen planus |
| LP: leukoplakia | ||
| NEOLP: Non-erosive oral lichen planus | ||
| OSCC: Oral squamous cell carcinoma | ||
| Skin | 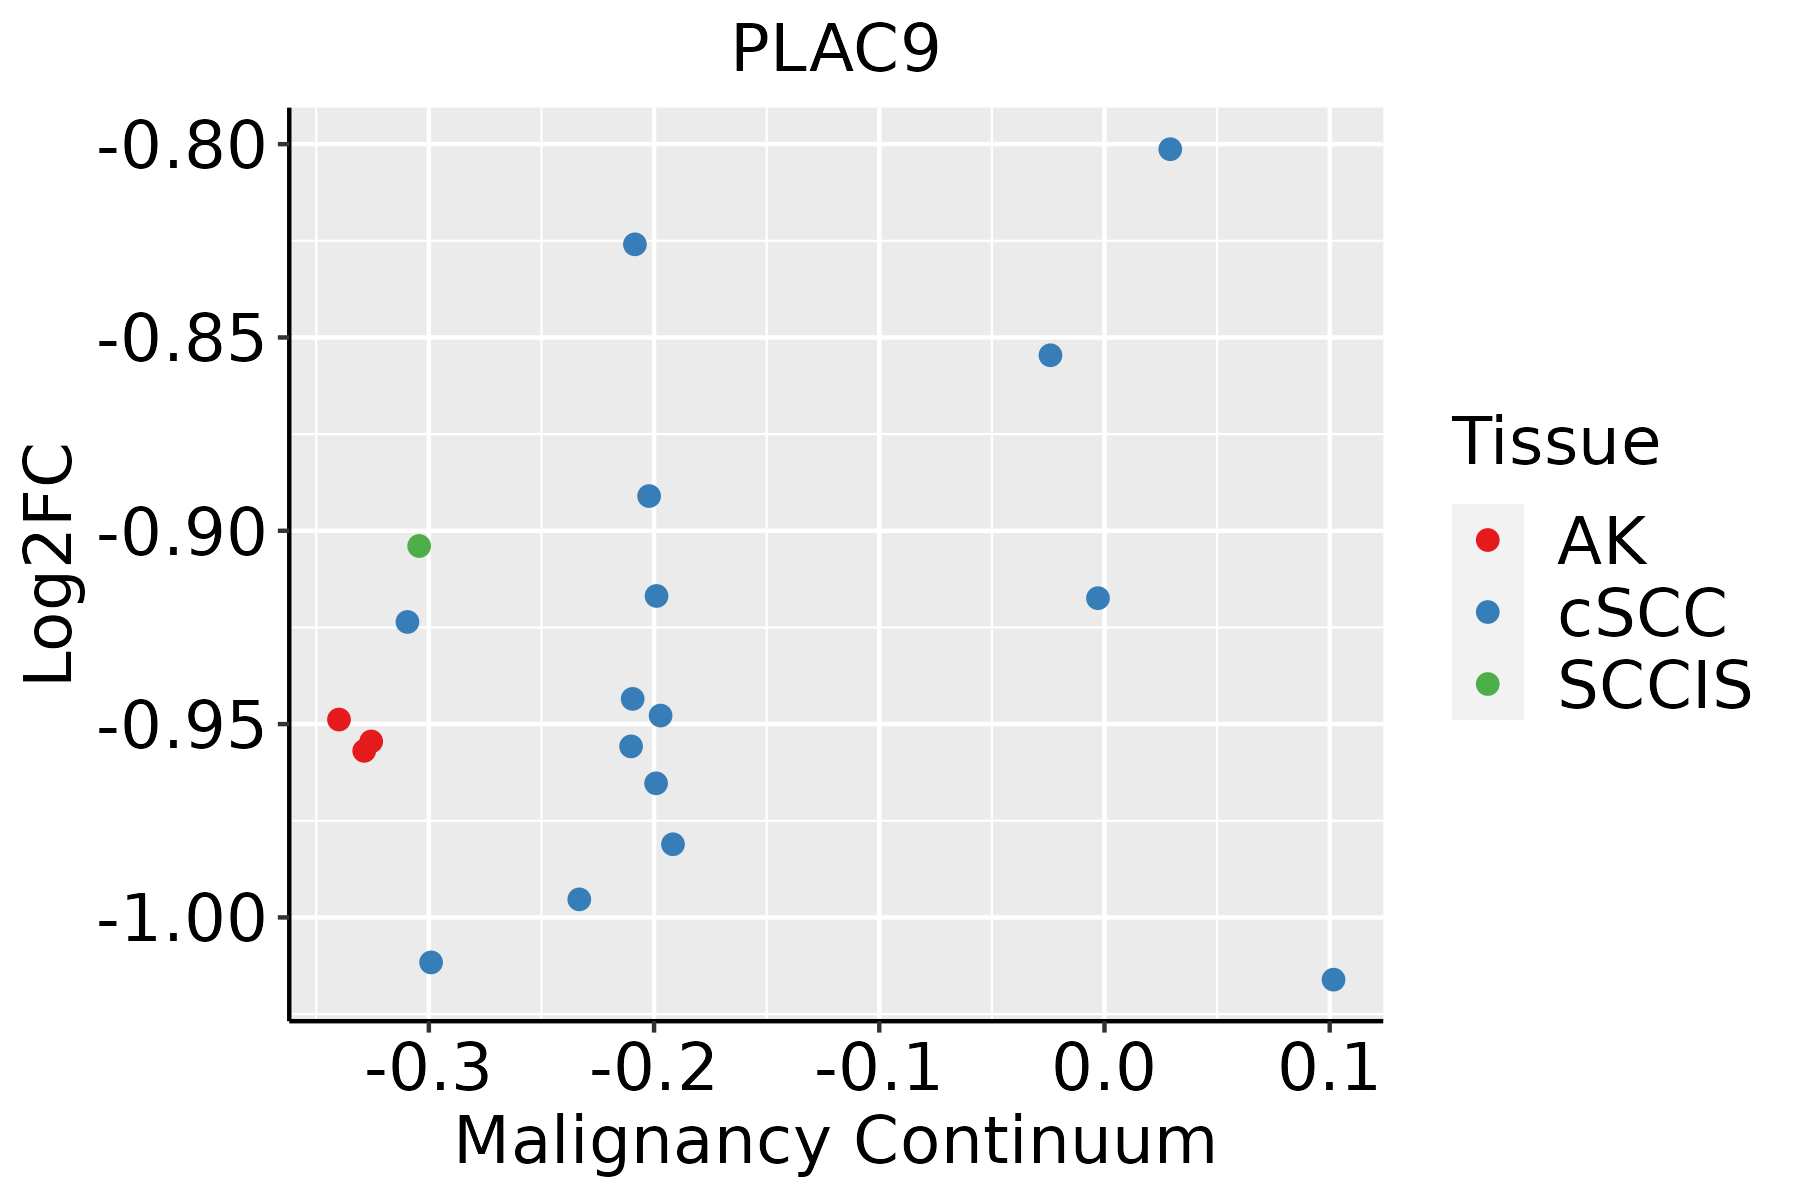 | AK: Actinic keratosis |
| cSCC: Cutaneous squamous cell carcinoma | ||
| SCCIS:squamous cell carcinoma in situ | ||
| Thyroid | 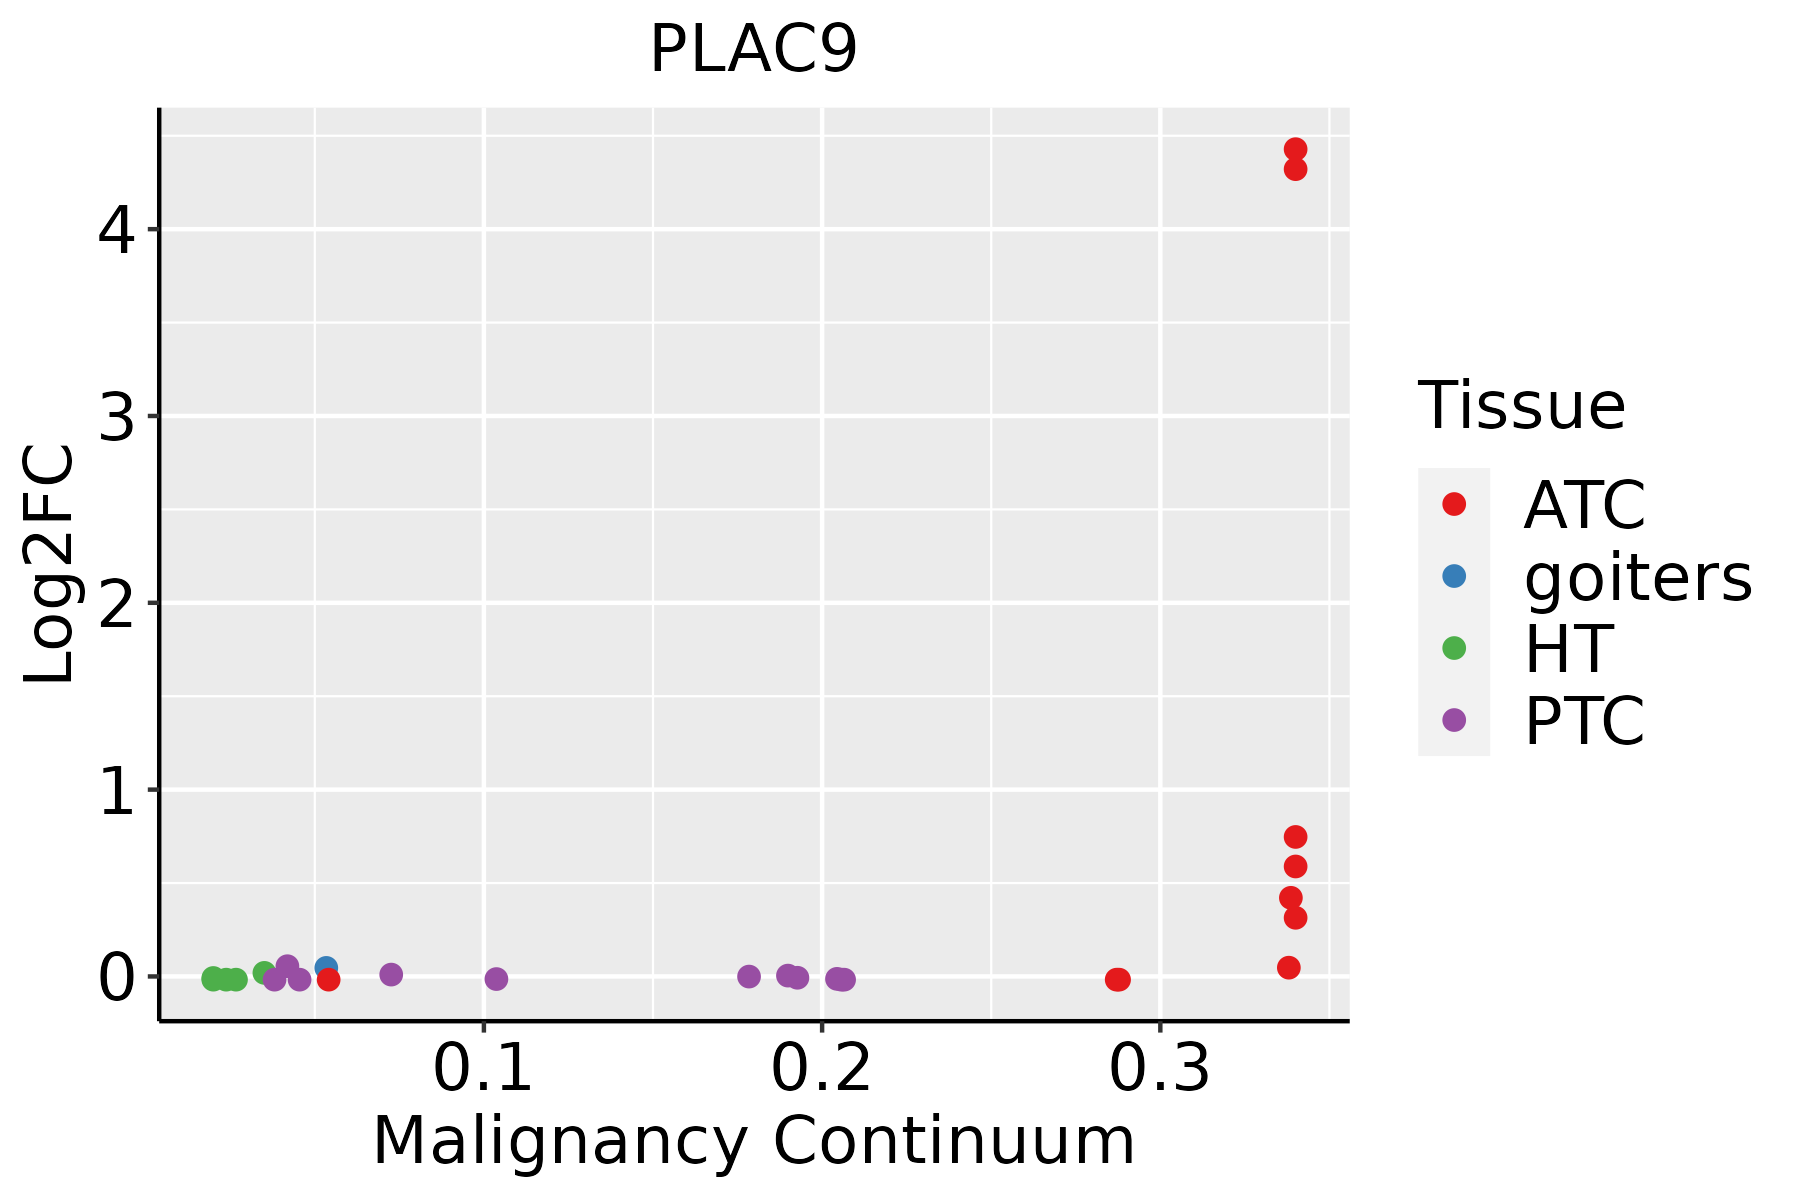 | ATC: Anaplastic thyroid cancer |
| HT: Hashimoto's thyroiditis | ||
| PTC: Papillary thyroid cancer |
| ∗log2FC in expression of this searched gene in stem-like cells from each diseased tissue sample relative to stem-like cells in normal samples in each tissue plotted against the malignancy continuum. Samples are colored based on if they are from different disease stage. |
Top |
Malignant transformation related pathway analysis |
| Find out the enriched GO biological processes and KEGG pathways involved in transition from healthy to precancer to cancer |
| Tissue | Disease Stage | Enriched GO biological Processes |
| Colorectum | AD |  |
| Colorectum | SER |  |
| Colorectum | MSS |  |
| Colorectum | MSI-H |  |
| Colorectum | FAP |  |
| ∗Top 15 enriched GO BP terms are showed in the bar plot of each disease state in each tissue. Each row represents a significant GO biological process which is colored according to the -log10(p.adjust). |
| Page: 1 2 3 4 5 6 7 8 9 |
| GO ID | Tissue | Disease Stage | Description | Gene Ratio | Bg Ratio | pvalue | p.adjust | Count |
| Page: 1 |
| Pathway ID | Tissue | Disease Stage | Description | Gene Ratio | Bg Ratio | pvalue | p.adjust | qvalue | Count |
| Page: 1 |
Top |
Cell-cell communication analysis |
| Identification of potential cell-cell interactions between two cell types and their ligand-receptor pairs for different disease states |
| Ligand | Receptor | LRpair | Pathway | Tissue | Disease Stage |
| Page: 1 |
Top |
Single-cell gene regulatory network inference analysis |
| Find out the significant the regulons (TFs) and the target genes of each regulon across cell types for different disease states |
| TF | Cell Type | Tissue | Disease Stage | Target Gene | RSS | Regulon Activity |
| ∗The dot plots of a searched regulon are shown for all cell subpopulations in each disease state of each tissue based on the regulon specific score inferred using pySCENIC and by calculating the average expression. |
| Page: 1 |
Top |
Somatic mutation of malignant transformation related genes |
| Annotation of somatic variants for genes involved in malignant transformation |
| Hugo Symbol | Variant Class | Variant Classification | dbSNP RS | HGVSc | HGVSp | HGVSp Short | SWISSPROT | BIOTYPE | SIFT | PolyPhen | Tumor Sample Barcode | Tissue | Histology | Sex | Age | Stage | Therapy Types | Drugs | Outcome |
| PLAC9 | SNV | Missense_Mutation | c.160G>C | p.Glu54Gln | p.E54Q | Q5JTB6 | protein_coding | deleterious(0) | probably_damaging(0.994) | TCGA-EW-A1PB-01 | Breast | breast invasive carcinoma | Female | >=65 | III/IV | Unknown | Unknown | SD | |
| PLAC9 | SNV | Missense_Mutation | c.206G>A | p.Gly69Asp | p.G69D | Q5JTB6 | protein_coding | tolerated(0.09) | benign(0.424) | TCGA-A6-6650-01 | Colorectum | colon adenocarcinoma | Female | >=65 | I/II | Unknown | Unknown | SD | |
| PLAC9 | SNV | Missense_Mutation | rs200468028 | c.143N>A | p.Arg48His | p.R48H | Q5JTB6 | protein_coding | deleterious(0.03) | benign(0.012) | TCGA-B5-A11E-01 | Endometrium | uterine corpus endometrioid carcinoma | Female | <65 | I/II | Unknown | Unknown | SD |
| PLAC9 | SNV | Missense_Mutation | novel | c.287N>A | p.Gly96Asp | p.G96D | Q5JTB6 | protein_coding | deleterious(0.01) | benign(0.075) | TCGA-BK-A6W3-01 | Endometrium | uterine corpus endometrioid carcinoma | Female | <65 | I/II | Unknown | Unknown | SD |
| PLAC9 | SNV | Missense_Mutation | novel | c.124C>T | p.His42Tyr | p.H42Y | Q5JTB6 | protein_coding | tolerated(0.09) | benign(0) | TCGA-FI-A2D5-01 | Endometrium | uterine corpus endometrioid carcinoma | Female | <65 | III/IV | Chemotherapy | carboplatinum | PD |
| Page: 1 |
Top |
Related drugs of malignant transformation related genes |
| Identification of chemicals and drugs interact with genes involved in malignant transfromation |
| (DGIdb 4.0) |
| Entrez ID | Symbol | Category | Interaction Types | Drug Claim Name | Drug Name | PMIDs |
| Page: 1 |

Copyright 2023-Present -The University of Texas Health Science Center at Houston |