Schematic overview of the cellular and molecular mechanisms involved in the cancer progression, including the proposed cellular and molecular mechanisms in cancer cells trajectory. AT1: alveolar type 1 cells; AT2: alveolar type 2 cells; AAH: atypical adenomatous hyperplasia; AIS: adenocarcinoma in situ; MIA: minimally invasive adenocarcinoma; IA: invasive adenocarcinoma; EMT: epithelial-mesenchymal transition

Home

Download

Statistics

Help

Contact

Center for Computational Systems Medicine
leaf

Gene summary

leaf

Malignant transformation analysis

leaf

Malignant transformation related pathway analysis

leaf

Cell-cell communication analysis

leaf

Single-cell gene regulatory network inference analysis

leaf

Somatic mutation of malignant transformation related genes

leaf

Related drugs of malignant transformation related genes

Gene: PLAC8

Gene summary for PLAC8

check button Gene summary.

Gene informationSpeciesHuman
Gene symbol

PLAC8

Gene ID

51316

Gene nameplacenta associated 8
Gene AliasC15
Cytomap4q21.22
Gene Typeprotein-coding
GO ID

GO:0001659

UniProtAcc

Q9NZF1


Top

Malignant transformation analysis

check button Identification of the aberrant gene expression in precancerous and cancerous lesions by comparing the gene expression of stem-like cells in diseased tissues with normal stem cells
check button Malignant transformation involving gene list.
Entrez IDSymbolReplicatesSpeciesOrganTissueAdj P-valueLog2FCMalignancy
51316PLAC8HTA11_2487_2000001011HumanColorectumSER3.51e-221.75e+00-0.1808
51316PLAC8HTA11_347_2000001011HumanColorectumAD8.07e-118.59e-01-0.1954
51316PLAC8HTA11_411_2000001011HumanColorectumSER6.09e-062.49e+00-0.2602
51316PLAC8HTA11_2112_2000001011HumanColorectumSER2.14e-091.83e+00-0.2196
51316PLAC8HTA11_3361_2000001011HumanColorectumAD7.24e-046.39e-01-0.1207
51316PLAC8HTA11_83_2000001011HumanColorectumSER2.15e-059.15e-01-0.1526
51316PLAC8HTA11_696_2000001011HumanColorectumAD6.78e-111.10e+00-0.1464
51316PLAC8HTA11_1391_2000001011HumanColorectumAD2.77e-129.29e-01-0.059
51316PLAC8HTA11_2992_2000001011HumanColorectumSER4.67e-041.15e+00-0.1706
51316PLAC8HTA11_5212_2000001011HumanColorectumAD4.92e-121.76e+00-0.2061
51316PLAC8HTA11_99999970781_79442HumanColorectumMSS1.47e-02-1.62e-010.294
51316PLAC8HTA11_99999971662_82457HumanColorectumMSS2.70e-07-2.58e-010.3859
51316PLAC8HTA11_99999974143_84620HumanColorectumMSS5.50e-09-2.89e-010.3005
51316PLAC8A002-C-010HumanColorectumFAP4.63e-05-2.24e-010.242
51316PLAC8A015-C-203HumanColorectumFAP5.29e-06-1.96e-01-0.1294
51316PLAC8A002-C-201HumanColorectumFAP3.49e-04-2.38e-010.0324
51316PLAC8A002-C-203HumanColorectumFAP1.58e-13-2.83e-010.2786
51316PLAC8A001-C-119HumanColorectumFAP1.06e-02-2.58e-01-0.1557
51316PLAC8A001-C-108HumanColorectumFAP3.40e-02-1.12e-01-0.0272
51316PLAC8A002-C-205HumanColorectumFAP6.04e-05-2.18e-01-0.1236
Page: 1 2 3 4 5 

check button Transcriptomic changes along malignancy continuum.
TissueExpression DynamicsAbbreviation
Colorectum (GSE201348)The image shows the transcriptomic changes along malignancy continuum.log2FC in expression of this searched gene in stem-like cells from each diseased tissue sample relative to stem-like cells in normal samples in each tissue plotted against the malignancy continuum. Samples are colored based on if they are from different disease stage.FAP: Familial adenomatous polyposis
CRC: Colorectal cancer
Colorectum (HTA11)The image shows the transcriptomic changes along malignancy continuum.log2FC in expression of this searched gene in stem-like cells from each diseased tissue sample relative to stem-like cells in normal samples in each tissue plotted against the malignancy continuum. Samples are colored based on if they are from different disease stage.AD: Adenomas
SER: Sessile serrated lesions
MSI-H: Microsatellite-high colorectal cancer
MSS: Microsatellite stable colorectal cancer
EsophagusThe image shows the transcriptomic changes along malignancy continuum.log2FC in expression of this searched gene in stem-like cells from each diseased tissue sample relative to stem-like cells in normal samples in each tissue plotted against the malignancy continuum. Samples are colored based on if they are from different disease stage.
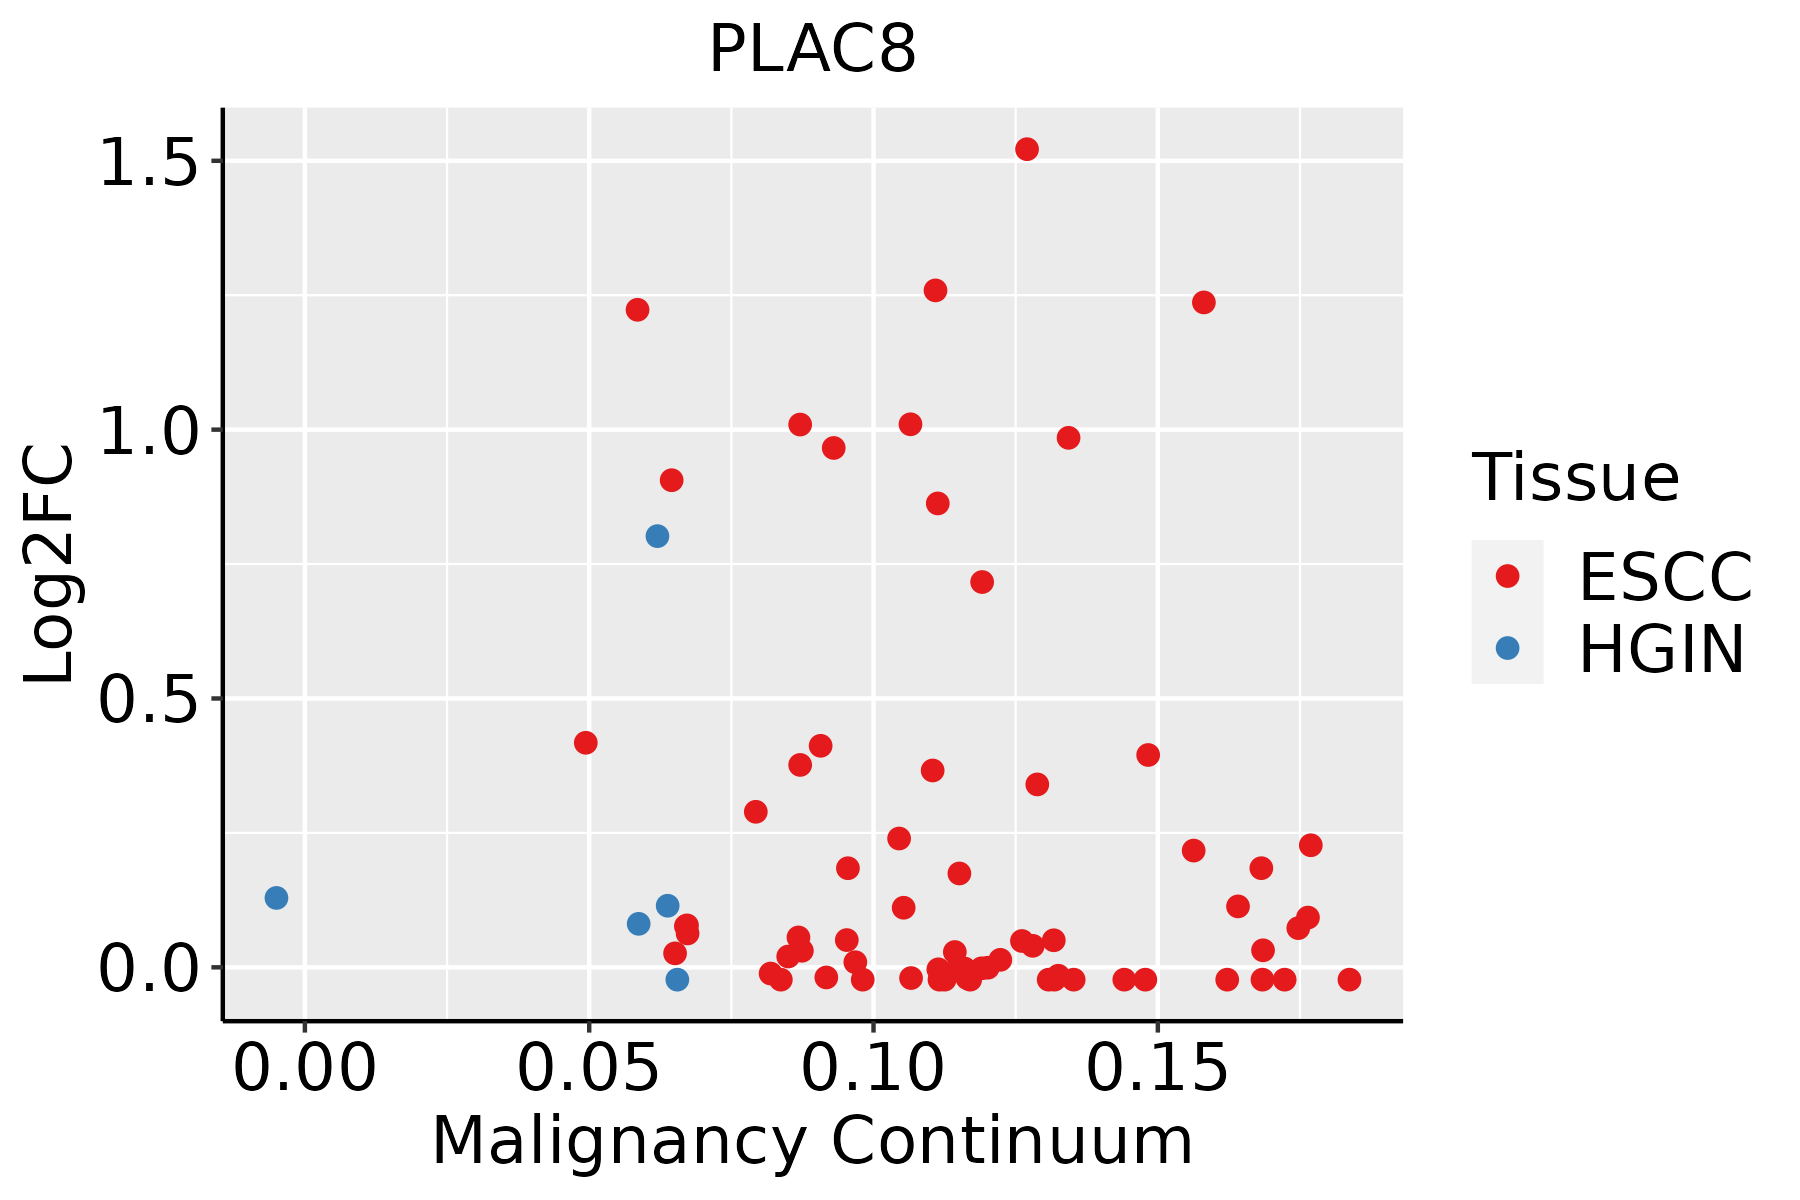
ESCC: Esophageal squamous cell carcinoma
HGIN: High-grade intraepithelial neoplasias
LGIN: Low-grade intraepithelial neoplasias
GCThe image shows the transcriptomic changes along malignancy continuum.log2FC in expression of this searched gene in stem-like cells from each diseased tissue sample relative to stem-like cells in normal samples in each tissue plotted against the malignancy continuum. Samples are colored based on if they are from different disease stage.
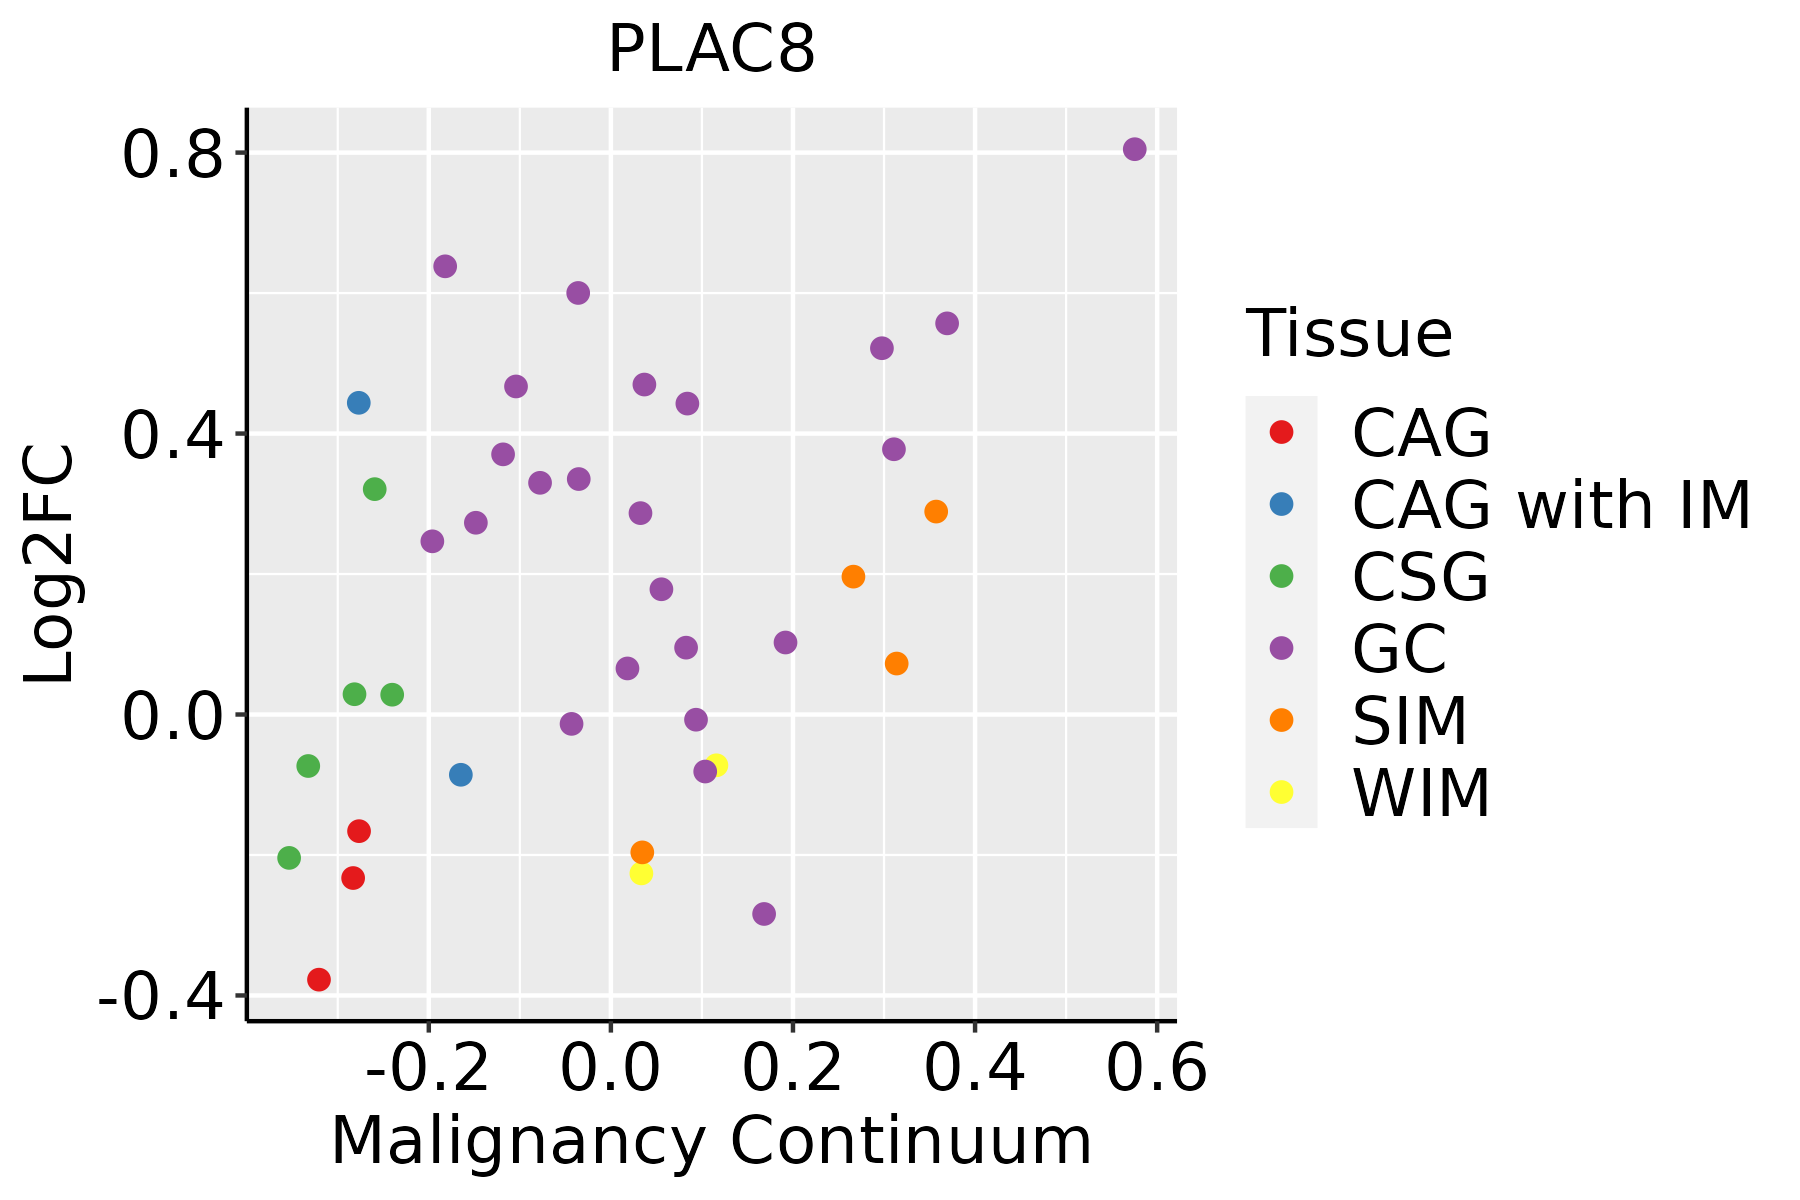
CAG: Chronic atrophic gastritis
CAG with IM: Chronic atrophic gastritis with intestinal metaplasia
CSG: Chronic superficial gastritis
GC: Gastric cancer
SIM: Severe intestinal metaplasia
WIM: Wild intestinal metaplasia
Oral CavityThe image shows the transcriptomic changes along malignancy continuum.log2FC in expression of this searched gene in stem-like cells from each diseased tissue sample relative to stem-like cells in normal samples in each tissue plotted against the malignancy continuum. Samples are colored based on if they are from different disease stage.
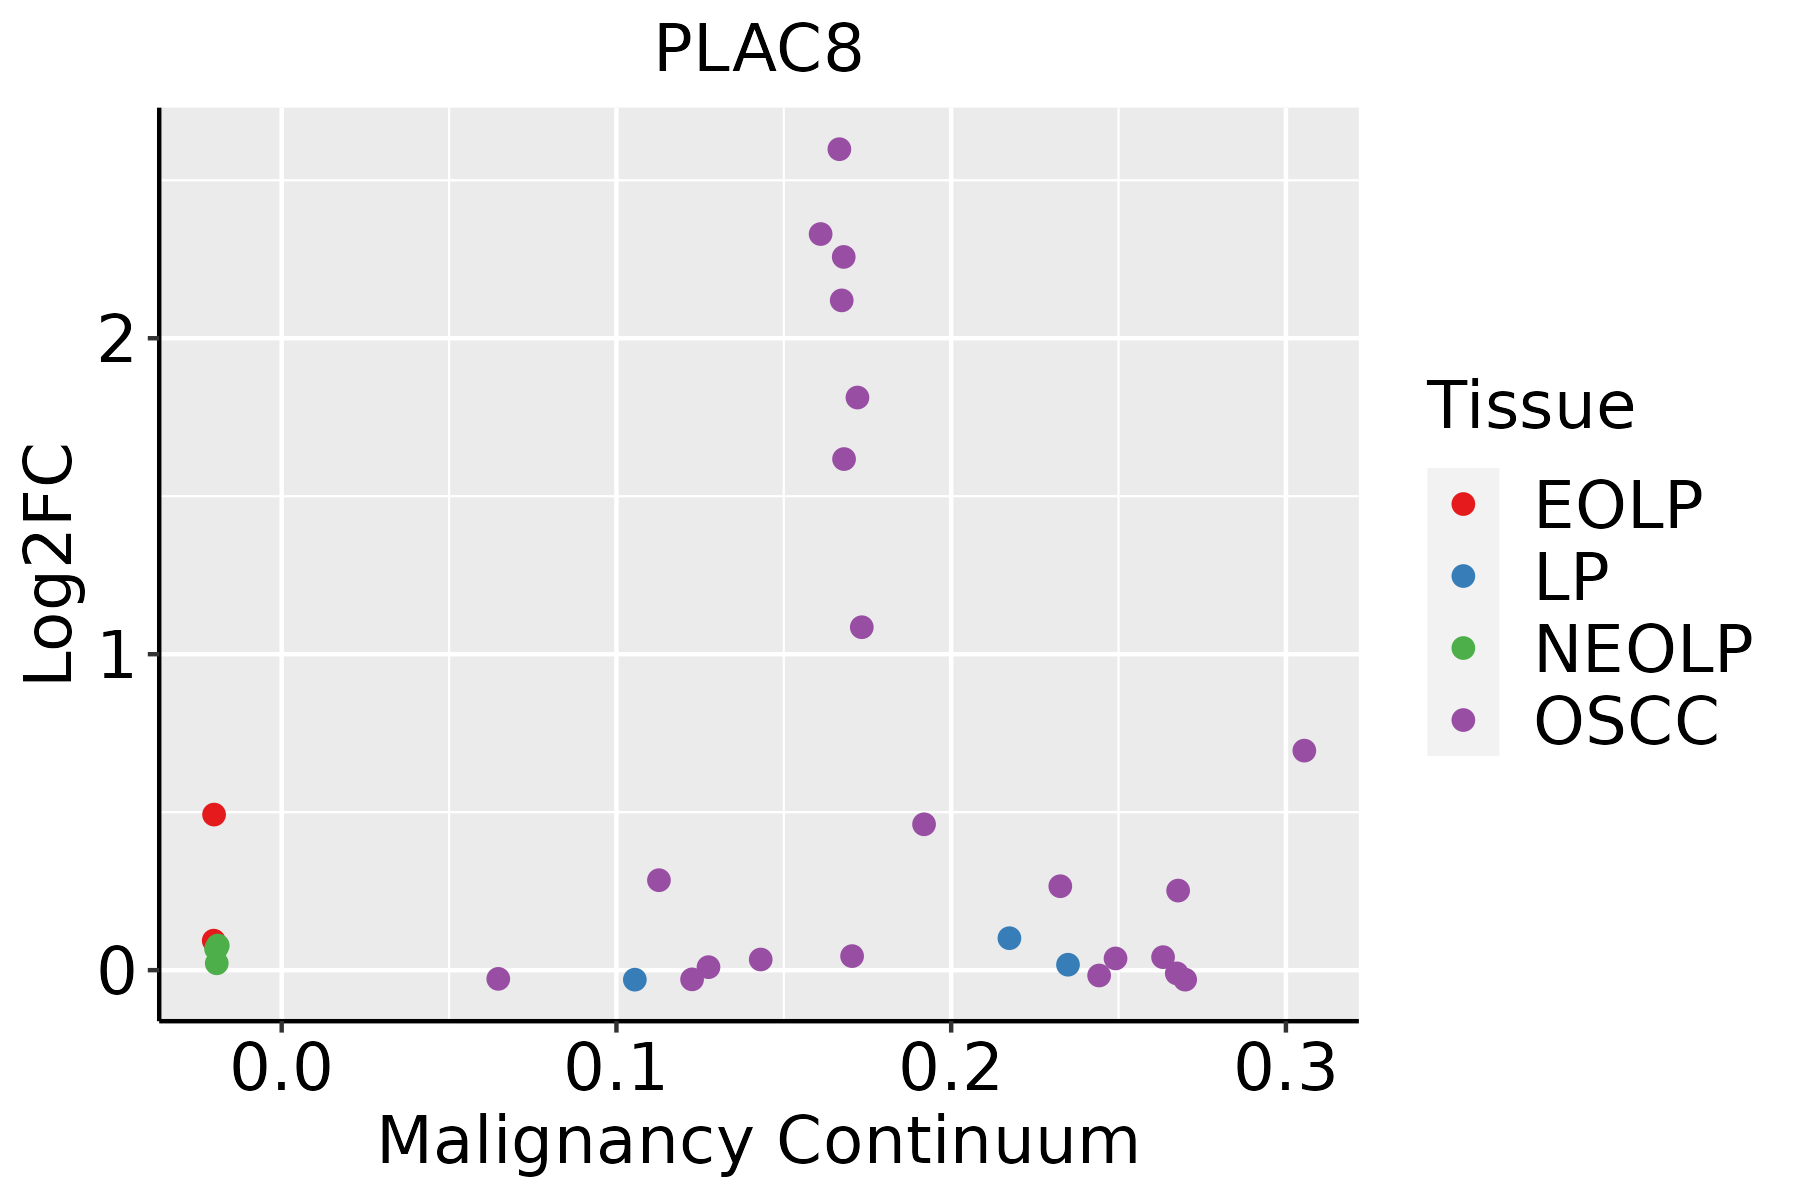
EOLP: Erosive Oral lichen planus
LP: leukoplakia
NEOLP: Non-erosive oral lichen planus
OSCC: Oral squamous cell carcinoma
∗log2FC in expression of this searched gene in stem-like cells from each diseased tissue sample relative to stem-like cells in normal samples in each tissue plotted against the malignancy continuum. Samples are colored based on if they are from different disease stage.

Top

Malignant transformation related pathway analysis

check buttonFind out the enriched GO biological processes and KEGG pathways involved in transition from healthy to precancer to cancer
check button Figure of enriched GO biological processes.
TissueDisease StageEnriched GO biological Processes
ColorectumADGO analysis - Figure of enriched GO biological processes: Top 15 enriched GO BP terms are showed in the bar plot of each disease state in each tissue. Each row represents a significant GO biological process which is colored according to the -log10(p.adjust).
ColorectumSERGO analysis - Figure of enriched GO biological processes: Top 15 enriched GO BP terms are showed in the bar plot of each disease state in each tissue. Each row represents a significant GO biological process which is colored according to the -log10(p.adjust).
ColorectumMSSGO analysis - Figure of enriched GO biological processes: Top 15 enriched GO BP terms are showed in the bar plot of each disease state in each tissue. Each row represents a significant GO biological process which is colored according to the -log10(p.adjust).
ColorectumMSI-HGO analysis - Figure of enriched GO biological processes: Top 15 enriched GO BP terms are showed in the bar plot of each disease state in each tissue. Each row represents a significant GO biological process which is colored according to the -log10(p.adjust).
ColorectumFAPGO analysis - Figure of enriched GO biological processes: Top 15 enriched GO BP terms are showed in the bar plot of each disease state in each tissue. Each row represents a significant GO biological process which is colored according to the -log10(p.adjust).
∗Top 15 enriched GO BP terms are showed in the bar plot of each disease state in each tissue. Each row represents a significant GO biological process which is colored according to the -log10(p.adjust).
Page: 1 2 3 4 5 6 7 8 9 

check button Enriched GO biological processes.
GO IDTissueDisease StageDescriptionGene RatioBg Ratiopvaluep.adjustCount
GO:0009409ColorectumADresponse to cold22/391849/187231.40e-041.98e-0322
GO:0048638ColorectumADregulation of developmental growth92/3918330/187231.48e-031.25e-0292
GO:0120162ColorectumADpositive regulation of cold-induced thermogenesis32/391897/187233.74e-032.63e-0232
GO:0045926ColorectumADnegative regulation of growth70/3918249/187234.07e-032.83e-0270
GO:0106106ColorectumADcold-induced thermogenesis43/3918144/187237.05e-034.31e-0243
GO:0120161ColorectumADregulation of cold-induced thermogenesis43/3918144/187237.05e-034.31e-0243
GO:1990845ColorectumADadaptive thermogenesis46/3918157/187237.97e-034.73e-0246
GO:00094091ColorectumSERresponse to cold16/289749/187232.11e-032.06e-0216
GO:00459261ColorectumSERnegative regulation of growth55/2897249/187233.44e-032.92e-0255
GO:0045444ColorectumSERfat cell differentiation51/2897229/187233.96e-033.26e-0251
GO:00094092ColorectumMSSresponse to cold19/346749/187237.20e-047.70e-0319
GO:00486381ColorectumMSSregulation of developmental growth84/3467330/187231.01e-031.01e-0284
GO:0035264ColorectumMSSmulticellular organism growth37/3467132/187234.77e-033.34e-0237
GO:00486382ColorectumFAPregulation of developmental growth75/2622330/187231.11e-053.10e-0475
GO:00352641ColorectumFAPmulticellular organism growth31/2622132/187232.28e-031.84e-0231
GO:0001659ColorectumFAPtemperature homeostasis38/2622174/187233.16e-032.36e-0238
GO:01061061ColorectumFAPcold-induced thermogenesis32/2622144/187234.85e-033.25e-0232
GO:01201611ColorectumFAPregulation of cold-induced thermogenesis32/2622144/187234.85e-033.25e-0232
GO:19908451ColorectumFAPadaptive thermogenesis34/2622157/187235.77e-033.69e-0234
GO:00094093ColorectumFAPresponse to cold14/262249/187235.95e-033.75e-0214
Page: 1 2 3 

check button Enriched KEGG pathways.
Pathway IDTissueDisease StageDescriptionGene RatioBg Ratiopvaluep.adjustqvalueCount
Page: 1 

Top

Cell-cell communication analysis

check buttonIdentification of potential cell-cell interactions between two cell types and their ligand-receptor pairs for different disease states
LigandReceptorLRpairPathwayTissueDisease Stage
Page: 1 

Top

Single-cell gene regulatory network inference analysis

check buttonFind out the significant the regulons (TFs) and the target genes of each regulon across cell types for different disease states
TFCell TypeTissueDisease StageTarget GeneRSSRegulon Activity
∗The dot plots of a searched regulon are shown for all cell subpopulations in each disease state of each tissue based on the regulon specific score inferred using pySCENIC and by calculating the average expression.
Page: 1 

Top

Somatic mutation of malignant transformation related genes

check buttonAnnotation of somatic variants for genes involved in malignant transformation
Hugo SymbolVariant ClassVariant ClassificationdbSNP RSHGVScHGVSpHGVSp ShortSWISSPROTBIOTYPESIFTPolyPhenTumor Sample BarcodeTissueHistologySexAgeStageTherapy TypesDrugsOutcome
PLAC8SNVMissense_Mutationc.151N>Ap.Gly51Argp.G51RQ9NZF1protein_codingdeleterious(0.01)possibly_damaging(0.711)TCGA-D8-A1XQ-01Breastbreast invasive carcinomaFemale>=65I/IIUnknownUnknownSD
PLAC8SNVMissense_Mutationc.260N>Gp.Asp87Glyp.D87GQ9NZF1protein_codingdeleterious(0)probably_damaging(1)TCGA-E2-A1LS-01Breastbreast invasive carcinomaFemale<65I/IIUnspecificCyclophosphamideSD
PLAC8insertionNonsense_Mutationnovelc.42_43insTCGTGTTGGGCAGGCCGGTCTCAAACTCCTGACATCAAGTGATCTGCCp.Gly14_Val15insSerCysTrpAlaGlyArgSerGlnThrProAspIleLysTerSerAlap.G14_V15insSCWAGRSQTPDIK*SAQ9NZF1protein_codingTCGA-A7-A0CG-01Breastbreast invasive carcinomaFemale>=65I/IIUnknownUnknownSD
PLAC8SNVMissense_Mutationc.313N>Tp.Asp105Tyrp.D105YQ9NZF1protein_codingdeleterious(0)probably_damaging(0.997)TCGA-AG-A002-01Colorectumrectum adenocarcinomaMale<65I/IIUnknownUnknownSD
PLAC8SNVMissense_Mutationnovelc.167C>Tp.Ala56Valp.A56VQ9NZF1protein_codingtolerated(0.05)benign(0.316)TCGA-A5-A2K3-01Endometriumuterine corpus endometrioid carcinomaFemale>=65I/IIChemotherapycarboplatinSD
PLAC8SNVMissense_Mutationrs144318051c.338N>Ap.Arg113Hisp.R113HQ9NZF1protein_codingtolerated(0.08)benign(0)TCGA-AP-A059-01Endometriumuterine corpus endometrioid carcinomaFemale>=65I/IIUnknownUnknownSD
PLAC8SNVMissense_Mutationc.268N>Ap.Ala90Thrp.A90TQ9NZF1protein_codingtolerated(0.46)benign(0.014)TCGA-B5-A0JY-01Endometriumuterine corpus endometrioid carcinomaFemale<65III/IVChemotherapydoxorubicinSD
PLAC8SNVMissense_Mutationc.332C>Tp.Ala111Valp.A111VQ9NZF1protein_codingtolerated(0.09)benign(0.3)TCGA-B5-A11E-01Endometriumuterine corpus endometrioid carcinomaFemale<65I/IIUnknownUnknownSD
PLAC8SNVMissense_Mutationc.109N>Ap.Cys37Serp.C37SQ9NZF1protein_codingdeleterious(0.03)possibly_damaging(0.529)TCGA-B5-A11G-01Endometriumuterine corpus endometrioid carcinomaFemale>=65I/IIUnknownUnknownSD
PLAC8SNVMissense_Mutationrs866736651c.178N>Ap.Glu60Lysp.E60KQ9NZF1protein_codingdeleterious(0)probably_damaging(0.999)TCGA-B5-A3FA-01Endometriumuterine corpus endometrioid carcinomaFemale>=65I/IIUnknownUnknownSD
Page: 1 2 

Top

Related drugs of malignant transformation related genes

check buttonIdentification of chemicals and drugs interact with genes involved in malignant transfromation
(DGIdb 4.0)
Entrez IDSymbolCategoryInteraction TypesDrug Claim NameDrug NamePMIDs
Page: 1