
|
|||||
|
 | |
| |
| |
| |
| |
| |
|
Gene: PLAC1 |
Gene summary for PLAC1 |
| Gene information | Species | Human | Gene symbol | PLAC1 | Gene ID | 10761 |
| Gene name | placenta enriched 1 | |
| Gene Alias | CT92 | |
| Cytomap | Xq26.3 | |
| Gene Type | protein-coding | GO ID | GO:0000003 | UniProtAcc | Q9HBJ0 |
Top |
Malignant transformation analysis |
| Identification of the aberrant gene expression in precancerous and cancerous lesions by comparing the gene expression of stem-like cells in diseased tissues with normal stem cells |
| Entrez ID | Symbol | Replicates | Species | Organ | Tissue | Adj P-value | Log2FC | Malignancy |
| 10761 | PLAC1 | LZE24T | Human | Esophagus | ESCC | 2.58e-18 | 5.12e-01 | 0.0596 |
| 10761 | PLAC1 | P8T-E | Human | Esophagus | ESCC | 2.05e-07 | 2.53e-01 | 0.0889 |
| 10761 | PLAC1 | P12T-E | Human | Esophagus | ESCC | 1.15e-45 | 8.05e-01 | 0.1122 |
| 10761 | PLAC1 | P23T-E | Human | Esophagus | ESCC | 2.89e-02 | 9.57e-02 | 0.108 |
| 10761 | PLAC1 | P26T-E | Human | Esophagus | ESCC | 5.88e-35 | 5.98e-01 | 0.1276 |
| 10761 | PLAC1 | P27T-E | Human | Esophagus | ESCC | 7.98e-13 | 2.55e-01 | 0.1055 |
| 10761 | PLAC1 | P37T-E | Human | Esophagus | ESCC | 2.88e-04 | 1.24e-01 | 0.1371 |
| 10761 | PLAC1 | P38T-E | Human | Esophagus | ESCC | 3.67e-05 | 2.63e-01 | 0.127 |
| 10761 | PLAC1 | P49T-E | Human | Esophagus | ESCC | 5.23e-14 | 7.68e-01 | 0.1768 |
| 10761 | PLAC1 | P54T-E | Human | Esophagus | ESCC | 7.31e-07 | 2.04e-01 | 0.0975 |
| 10761 | PLAC1 | P65T-E | Human | Esophagus | ESCC | 1.06e-02 | 1.05e-01 | 0.0978 |
| 10761 | PLAC1 | P74T-E | Human | Esophagus | ESCC | 1.08e-19 | 4.35e-01 | 0.1479 |
| 10761 | PLAC1 | P80T-E | Human | Esophagus | ESCC | 7.90e-04 | 1.42e-01 | 0.155 |
| 10761 | PLAC1 | P89T-E | Human | Esophagus | ESCC | 5.72e-07 | 4.15e-01 | 0.1752 |
| 10761 | PLAC1 | P127T-E | Human | Esophagus | ESCC | 1.65e-03 | 1.12e-01 | 0.0826 |
| 10761 | PLAC1 | P128T-E | Human | Esophagus | ESCC | 1.04e-07 | 2.59e-01 | 0.1241 |
| 10761 | PLAC1 | P130T-E | Human | Esophagus | ESCC | 1.66e-02 | 9.25e-02 | 0.1676 |
| 10761 | PLAC1 | C04 | Human | Oral cavity | OSCC | 9.09e-26 | 1.01e+00 | 0.2633 |
| 10761 | PLAC1 | C21 | Human | Oral cavity | OSCC | 7.87e-13 | 2.98e-01 | 0.2678 |
| 10761 | PLAC1 | C30 | Human | Oral cavity | OSCC | 8.42e-14 | 5.71e-01 | 0.3055 |
| Page: 1 2 |
| Tissue | Expression Dynamics | Abbreviation |
| Esophagus | 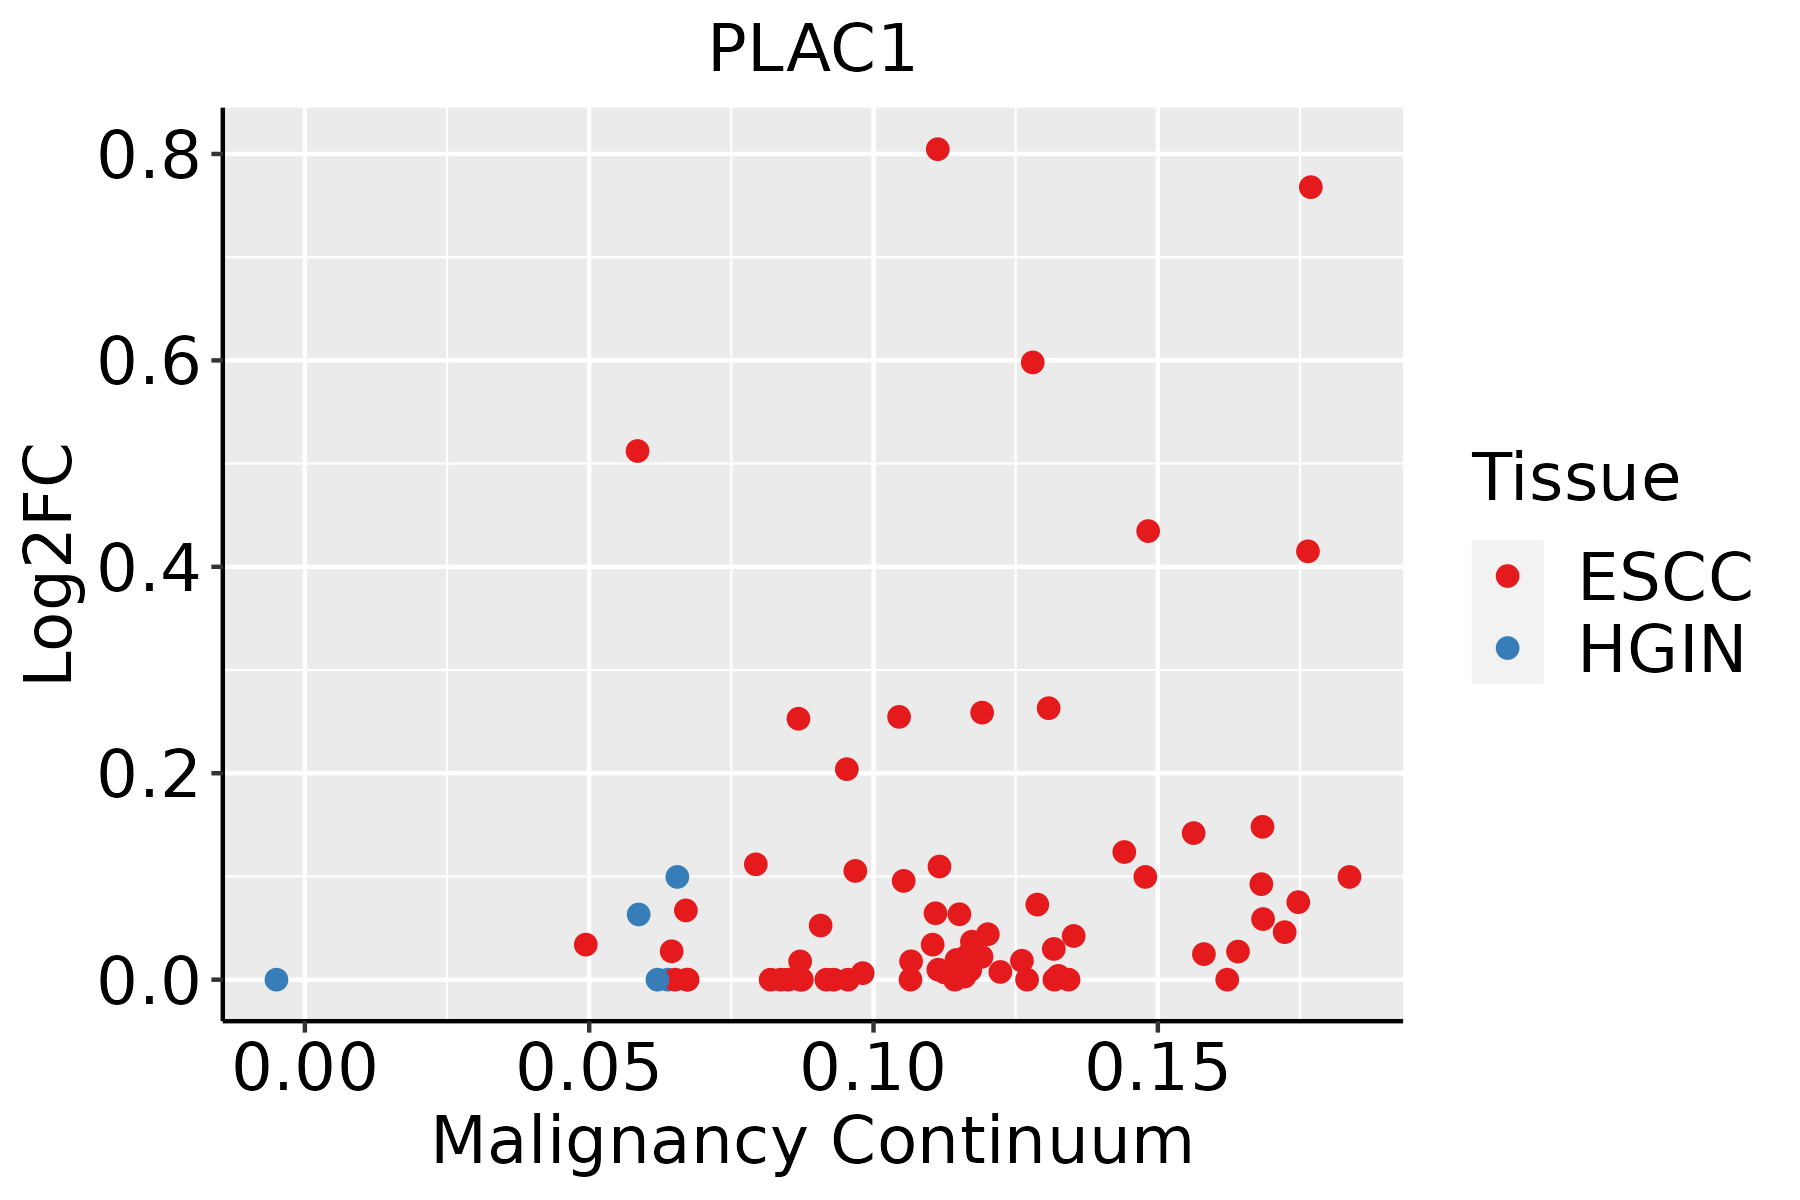 | ESCC: Esophageal squamous cell carcinoma |
| HGIN: High-grade intraepithelial neoplasias | ||
| LGIN: Low-grade intraepithelial neoplasias | ||
| Oral Cavity | 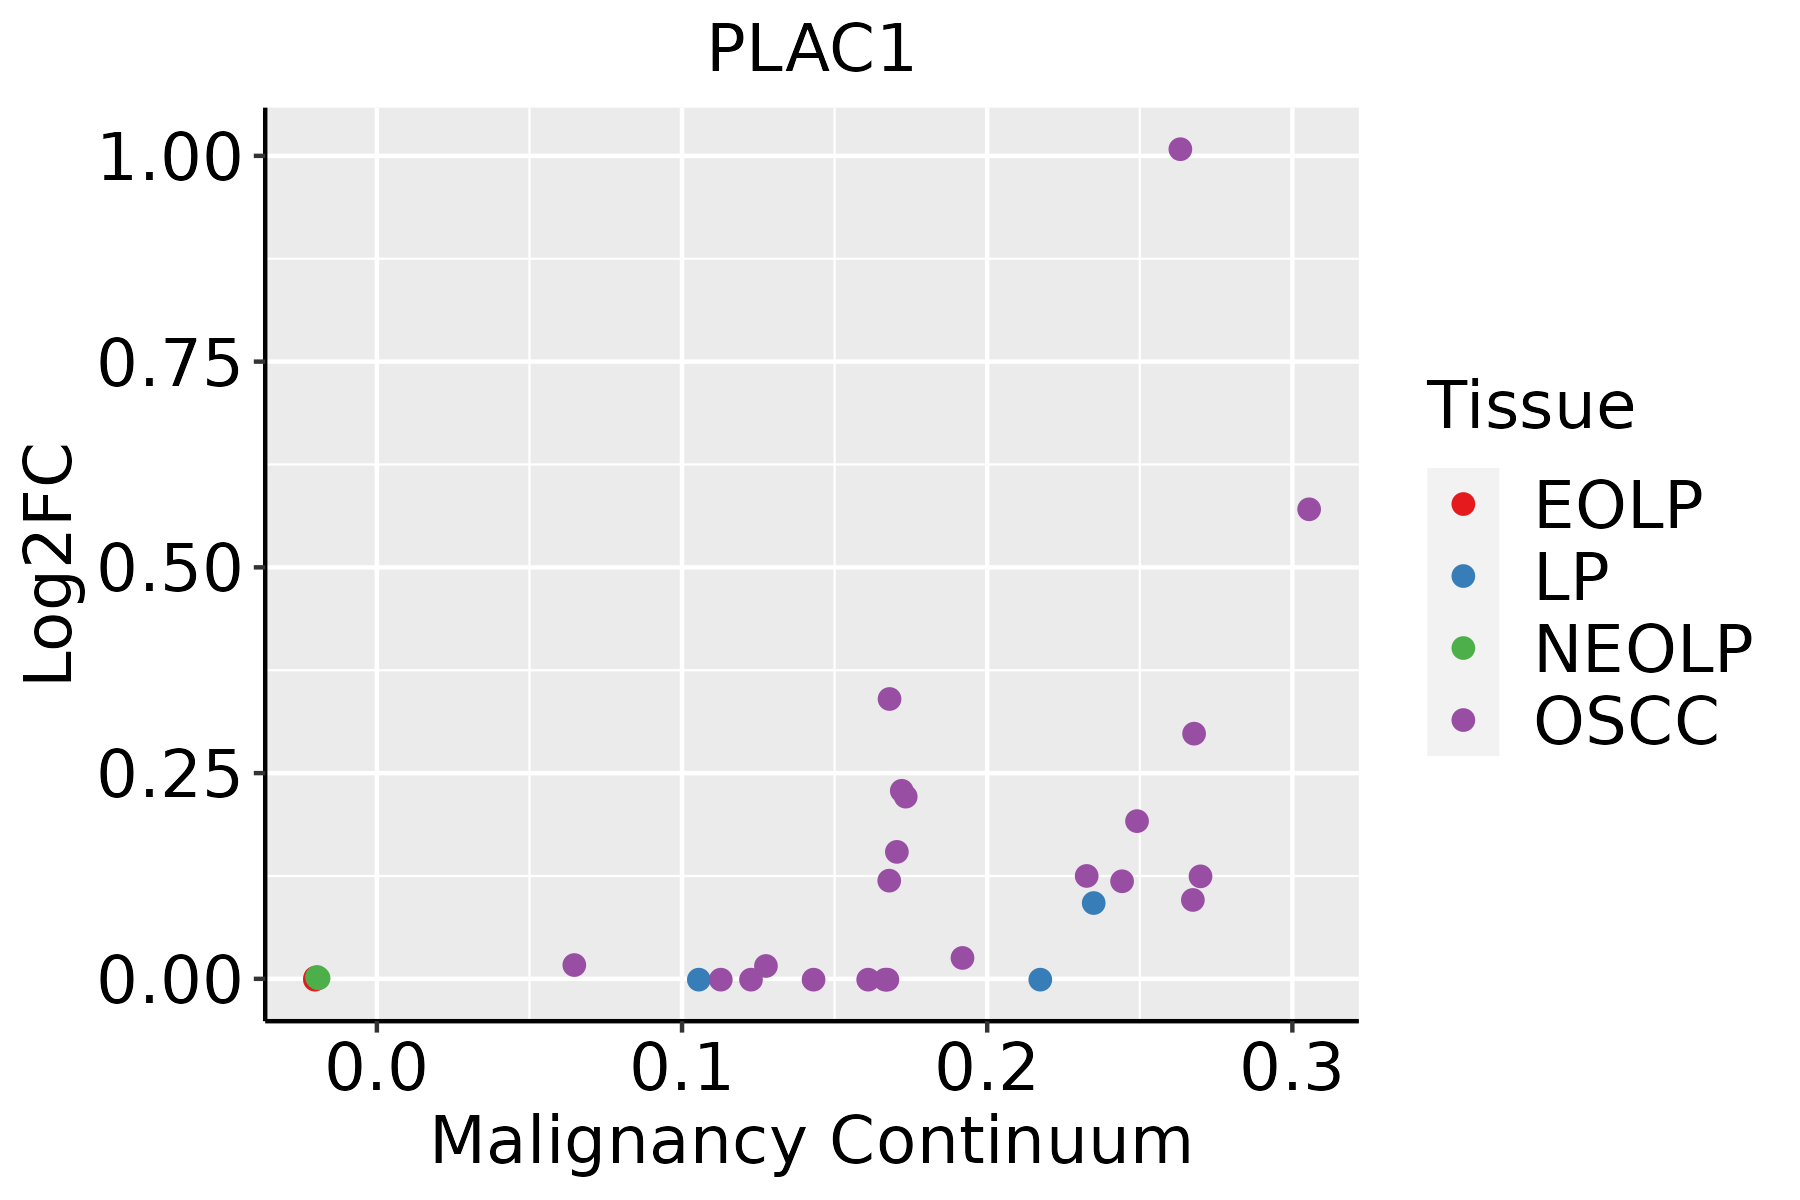 | EOLP: Erosive Oral lichen planus |
| LP: leukoplakia | ||
| NEOLP: Non-erosive oral lichen planus | ||
| OSCC: Oral squamous cell carcinoma |
| ∗log2FC in expression of this searched gene in stem-like cells from each diseased tissue sample relative to stem-like cells in normal samples in each tissue plotted against the malignancy continuum. Samples are colored based on if they are from different disease stage. |
Top |
Malignant transformation related pathway analysis |
| Find out the enriched GO biological processes and KEGG pathways involved in transition from healthy to precancer to cancer |
| Tissue | Disease Stage | Enriched GO biological Processes |
| Colorectum | AD |  |
| Colorectum | SER |  |
| Colorectum | MSS |  |
| Colorectum | MSI-H |  |
| Colorectum | FAP |  |
| ∗Top 15 enriched GO BP terms are showed in the bar plot of each disease state in each tissue. Each row represents a significant GO biological process which is colored according to the -log10(p.adjust). |
| Page: 1 2 3 4 5 6 7 8 9 |
| GO ID | Tissue | Disease Stage | Description | Gene Ratio | Bg Ratio | pvalue | p.adjust | Count |
| GO:0001890110 | Esophagus | ESCC | placenta development | 98/8552 | 144/18723 | 4.46e-08 | 8.11e-07 | 98 |
| GO:0061458110 | Esophagus | ESCC | reproductive system development | 247/8552 | 427/18723 | 2.24e-07 | 3.42e-06 | 247 |
| GO:004860818 | Esophagus | ESCC | reproductive structure development | 245/8552 | 424/18723 | 2.82e-07 | 4.14e-06 | 245 |
| GO:000189017 | Oral cavity | OSCC | placenta development | 87/7305 | 144/18723 | 1.54e-07 | 2.56e-06 | 87 |
| GO:006145817 | Oral cavity | OSCC | reproductive system development | 217/7305 | 427/18723 | 3.75e-07 | 5.63e-06 | 217 |
| GO:004860816 | Oral cavity | OSCC | reproductive structure development | 214/7305 | 424/18723 | 8.58e-07 | 1.18e-05 | 214 |
| Page: 1 |
| Pathway ID | Tissue | Disease Stage | Description | Gene Ratio | Bg Ratio | pvalue | p.adjust | qvalue | Count |
| Page: 1 |
Top |
Cell-cell communication analysis |
| Identification of potential cell-cell interactions between two cell types and their ligand-receptor pairs for different disease states |
| Ligand | Receptor | LRpair | Pathway | Tissue | Disease Stage |
| Page: 1 |
Top |
Single-cell gene regulatory network inference analysis |
| Find out the significant the regulons (TFs) and the target genes of each regulon across cell types for different disease states |
| TF | Cell Type | Tissue | Disease Stage | Target Gene | RSS | Regulon Activity |
| ∗The dot plots of a searched regulon are shown for all cell subpopulations in each disease state of each tissue based on the regulon specific score inferred using pySCENIC and by calculating the average expression. |
| Page: 1 |
Top |
Somatic mutation of malignant transformation related genes |
| Annotation of somatic variants for genes involved in malignant transformation |
| Hugo Symbol | Variant Class | Variant Classification | dbSNP RS | HGVSc | HGVSp | HGVSp Short | SWISSPROT | BIOTYPE | SIFT | PolyPhen | Tumor Sample Barcode | Tissue | Histology | Sex | Age | Stage | Therapy Types | Drugs | Outcome |
| PLAC1 | SNV | Missense_Mutation | novel | c.265N>G | p.Gln89Glu | p.Q89E | Q9HBJ0 | protein_coding | tolerated(0.74) | benign(0.005) | TCGA-AR-A2LH-01 | Breast | breast invasive carcinoma | Female | <65 | III/IV | Chemotherapy | adriamycin | PD |
| PLAC1 | SNV | Missense_Mutation | rs151135038 | c.58N>A | p.Gly20Ser | p.G20S | Q9HBJ0 | protein_coding | tolerated(0.18) | benign(0) | TCGA-LL-A50Y-01 | Breast | breast invasive carcinoma | Female | >=65 | I/II | Hormone Therapy | arimidex | CR |
| PLAC1 | SNV | Missense_Mutation | novel | c.367N>C | p.Trp123Arg | p.W123R | Q9HBJ0 | protein_coding | deleterious(0) | probably_damaging(0.932) | TCGA-2W-A8YY-01 | Cervix | cervical & endocervical cancer | Female | <65 | I/II | Chemotherapy | cisplatin | CR |
| PLAC1 | SNV | Missense_Mutation | novel | c.390G>A | p.Met130Ile | p.M130I | Q9HBJ0 | protein_coding | tolerated(0.32) | benign(0.005) | TCGA-VS-A8EH-01 | Cervix | cervical & endocervical cancer | Female | <65 | III/IV | Chemotherapy | cisplatin | CR |
| PLAC1 | SNV | Missense_Mutation | novel | c.586N>C | p.Asp196His | p.D196H | Q9HBJ0 | protein_coding | tolerated(0.08) | possibly_damaging(0.661) | TCGA-ZJ-AAXJ-01 | Cervix | cervical & endocervical cancer | Female | <65 | I/II | Unknown | Unknown | SD |
| PLAC1 | SNV | Missense_Mutation | c.124N>G | p.Phe42Val | p.F42V | Q9HBJ0 | protein_coding | tolerated(0.05) | benign(0.23) | TCGA-AG-3892-01 | Colorectum | rectum adenocarcinoma | Female | <65 | I/II | Unknown | Unknown | SD | |
| PLAC1 | SNV | Missense_Mutation | rs201999132 | c.146N>A | p.Cys49Tyr | p.C49Y | Q9HBJ0 | protein_coding | tolerated(1) | benign(0) | TCGA-AP-A059-01 | Endometrium | uterine corpus endometrioid carcinoma | Female | >=65 | I/II | Unknown | Unknown | SD |
| PLAC1 | SNV | Missense_Mutation | novel | c.467N>C | p.Ser156Thr | p.S156T | Q9HBJ0 | protein_coding | tolerated(0.14) | benign(0.013) | TCGA-AP-A0L9-01 | Endometrium | uterine corpus endometrioid carcinoma | Female | >=65 | I/II | Unknown | Unknown | SD |
| PLAC1 | SNV | Missense_Mutation | novel | c.494N>A | p.Pro165His | p.P165H | Q9HBJ0 | protein_coding | deleterious(0) | probably_damaging(0.976) | TCGA-AP-A1DV-01 | Endometrium | uterine corpus endometrioid carcinoma | Female | <65 | I/II | Unknown | Unknown | SD |
| PLAC1 | SNV | Missense_Mutation | novel | c.205N>T | p.His69Tyr | p.H69Y | Q9HBJ0 | protein_coding | tolerated(0.67) | benign(0.015) | TCGA-AX-A06F-01 | Endometrium | uterine corpus endometrioid carcinoma | Female | <65 | III/IV | Chemotherapy | carboplatin | SD |
| Page: 1 2 3 |
Top |
Related drugs of malignant transformation related genes |
| Identification of chemicals and drugs interact with genes involved in malignant transfromation |
| (DGIdb 4.0) |
| Entrez ID | Symbol | Category | Interaction Types | Drug Claim Name | Drug Name | PMIDs |
| Page: 1 |

Copyright 2023-Present -The University of Texas Health Science Center at Houston |