
|
|||||
|
 | |
| |
| |
| |
| |
| |
|
Gene: PLAA |
Gene summary for PLAA |
| Gene information | Species | Human | Gene symbol | PLAA | Gene ID | 9373 |
| Gene name | phospholipase A2 activating protein | |
| Gene Alias | DOA1 | |
| Cytomap | 9p21.2 | |
| Gene Type | protein-coding | GO ID | GO:0000209 | UniProtAcc | Q9Y263 |
Top |
Malignant transformation analysis |
| Identification of the aberrant gene expression in precancerous and cancerous lesions by comparing the gene expression of stem-like cells in diseased tissues with normal stem cells |
| Entrez ID | Symbol | Replicates | Species | Organ | Tissue | Adj P-value | Log2FC | Malignancy |
| 9373 | PLAA | LZE4T | Human | Esophagus | ESCC | 1.36e-12 | 3.26e-01 | 0.0811 |
| 9373 | PLAA | LZE7T | Human | Esophagus | ESCC | 1.71e-16 | 5.27e-01 | 0.0667 |
| 9373 | PLAA | LZE8T | Human | Esophagus | ESCC | 4.12e-05 | 1.69e-01 | 0.067 |
| 9373 | PLAA | LZE20T | Human | Esophagus | ESCC | 7.77e-06 | 9.11e-02 | 0.0662 |
| 9373 | PLAA | LZE24T | Human | Esophagus | ESCC | 7.87e-16 | 3.26e-01 | 0.0596 |
| 9373 | PLAA | LZE6T | Human | Esophagus | ESCC | 1.50e-02 | 4.94e-02 | 0.0845 |
| 9373 | PLAA | P1T-E | Human | Esophagus | ESCC | 2.57e-03 | 1.16e-01 | 0.0875 |
| 9373 | PLAA | P2T-E | Human | Esophagus | ESCC | 1.02e-42 | 7.54e-01 | 0.1177 |
| 9373 | PLAA | P4T-E | Human | Esophagus | ESCC | 2.16e-13 | 2.34e-01 | 0.1323 |
| 9373 | PLAA | P5T-E | Human | Esophagus | ESCC | 1.12e-32 | 5.31e-01 | 0.1327 |
| 9373 | PLAA | P8T-E | Human | Esophagus | ESCC | 3.75e-12 | 1.61e-01 | 0.0889 |
| 9373 | PLAA | P9T-E | Human | Esophagus | ESCC | 2.81e-18 | 4.15e-01 | 0.1131 |
| 9373 | PLAA | P10T-E | Human | Esophagus | ESCC | 5.29e-20 | 2.85e-01 | 0.116 |
| 9373 | PLAA | P11T-E | Human | Esophagus | ESCC | 1.22e-16 | 6.20e-01 | 0.1426 |
| 9373 | PLAA | P12T-E | Human | Esophagus | ESCC | 6.49e-15 | 2.44e-01 | 0.1122 |
| 9373 | PLAA | P15T-E | Human | Esophagus | ESCC | 4.91e-18 | 3.28e-01 | 0.1149 |
| 9373 | PLAA | P16T-E | Human | Esophagus | ESCC | 1.47e-15 | 2.52e-01 | 0.1153 |
| 9373 | PLAA | P17T-E | Human | Esophagus | ESCC | 2.19e-05 | 2.23e-01 | 0.1278 |
| 9373 | PLAA | P19T-E | Human | Esophagus | ESCC | 1.12e-11 | 5.42e-01 | 0.1662 |
| 9373 | PLAA | P20T-E | Human | Esophagus | ESCC | 3.26e-17 | 2.18e-01 | 0.1124 |
| Page: 1 2 3 4 5 |
| Tissue | Expression Dynamics | Abbreviation |
| Esophagus | 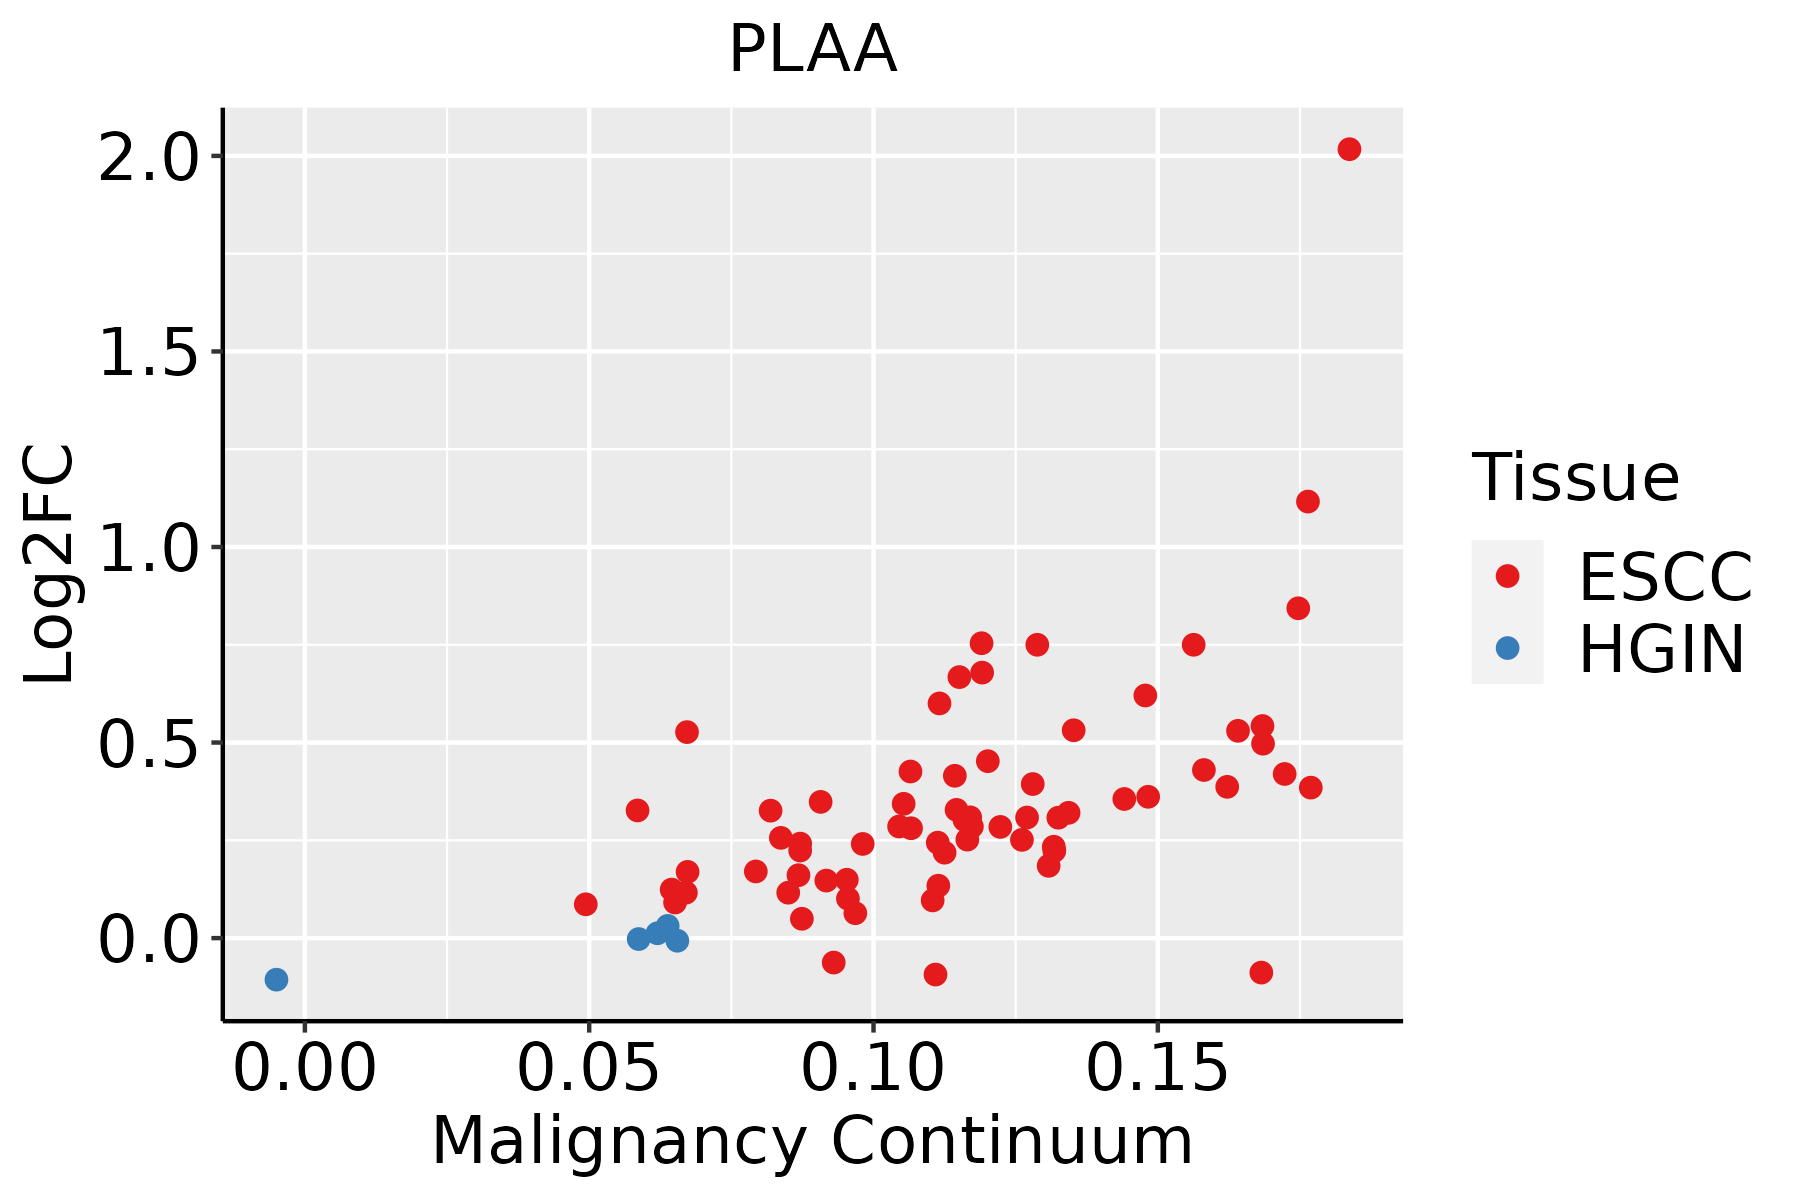 | ESCC: Esophageal squamous cell carcinoma |
| HGIN: High-grade intraepithelial neoplasias | ||
| LGIN: Low-grade intraepithelial neoplasias | ||
| Liver |  | HCC: Hepatocellular carcinoma |
| NAFLD: Non-alcoholic fatty liver disease | ||
| Oral Cavity | 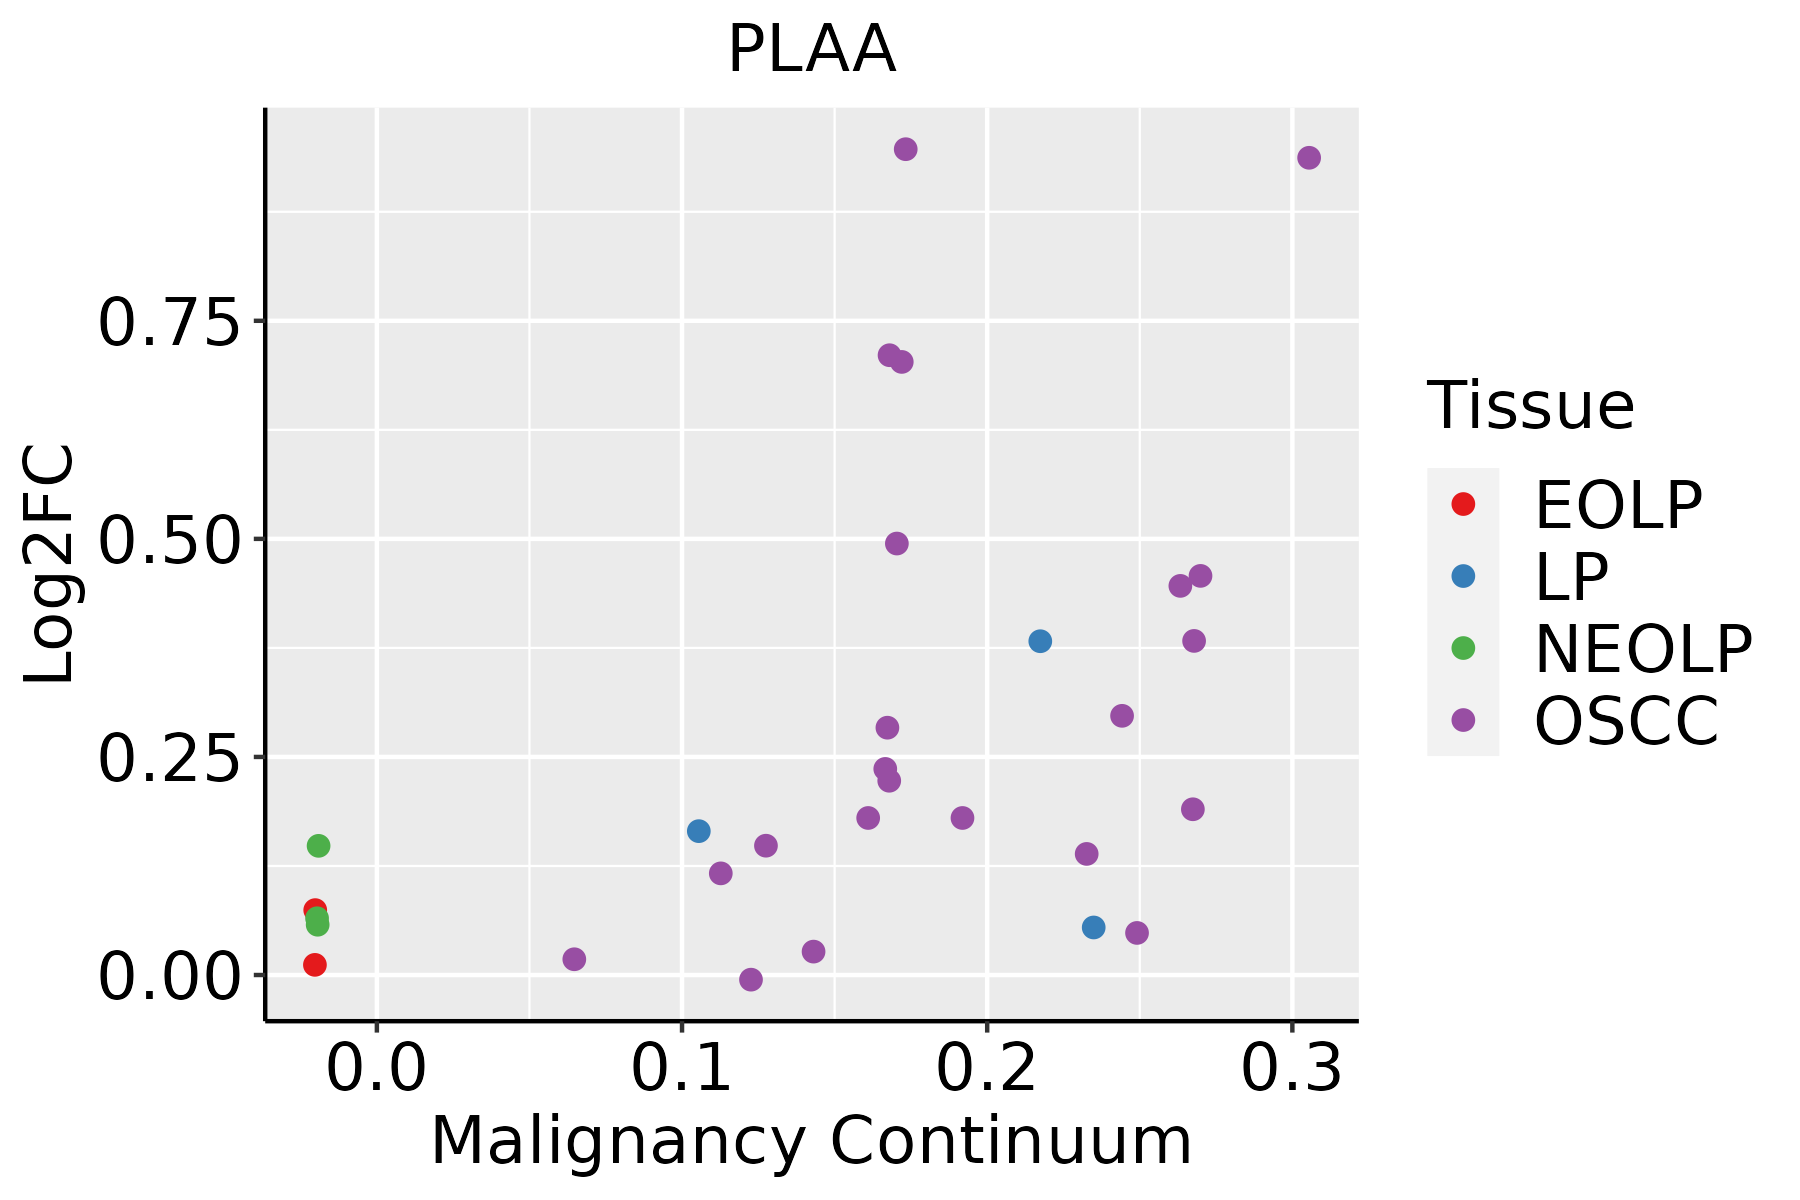 | EOLP: Erosive Oral lichen planus |
| LP: leukoplakia | ||
| NEOLP: Non-erosive oral lichen planus | ||
| OSCC: Oral squamous cell carcinoma |
| ∗log2FC in expression of this searched gene in stem-like cells from each diseased tissue sample relative to stem-like cells in normal samples in each tissue plotted against the malignancy continuum. Samples are colored based on if they are from different disease stage. |
Top |
Malignant transformation related pathway analysis |
| Find out the enriched GO biological processes and KEGG pathways involved in transition from healthy to precancer to cancer |
| Tissue | Disease Stage | Enriched GO biological Processes |
| Colorectum | AD |  |
| Colorectum | SER |  |
| Colorectum | MSS |  |
| Colorectum | MSI-H |  |
| Colorectum | FAP |  |
| ∗Top 15 enriched GO BP terms are showed in the bar plot of each disease state in each tissue. Each row represents a significant GO biological process which is colored according to the -log10(p.adjust). |
| Page: 1 2 3 4 5 6 7 8 9 |
| GO ID | Tissue | Disease Stage | Description | Gene Ratio | Bg Ratio | pvalue | p.adjust | Count |
| GO:0022411 | Colorectum | AD | cellular component disassembly | 147/3918 | 443/18723 | 8.53e-10 | 6.76e-08 | 147 |
| GO:1903008 | Colorectum | AD | organelle disassembly | 46/3918 | 114/18723 | 1.81e-06 | 5.48e-05 | 46 |
| GO:0016042 | Colorectum | AD | lipid catabolic process | 97/3918 | 320/18723 | 4.31e-05 | 7.56e-04 | 97 |
| GO:0018904 | Colorectum | AD | ether metabolic process | 14/3918 | 27/18723 | 3.72e-04 | 4.29e-03 | 14 |
| GO:0006662 | Colorectum | AD | glycerol ether metabolic process | 12/3918 | 22/18723 | 5.38e-04 | 5.74e-03 | 12 |
| GO:0046485 | Colorectum | AD | ether lipid metabolic process | 10/3918 | 20/18723 | 3.67e-03 | 2.60e-02 | 10 |
| GO:0009913 | Colorectum | AD | epidermal cell differentiation | 58/3918 | 202/18723 | 5.16e-03 | 3.42e-02 | 58 |
| GO:0006650 | Colorectum | AD | glycerophospholipid metabolic process | 83/3918 | 306/18723 | 5.40e-03 | 3.55e-02 | 83 |
| GO:0006644 | Colorectum | AD | phospholipid metabolic process | 101/3918 | 383/18723 | 5.80e-03 | 3.67e-02 | 101 |
| GO:0008544 | Colorectum | AD | epidermis development | 87/3918 | 324/18723 | 5.99e-03 | 3.76e-02 | 87 |
| GO:00224111 | Colorectum | SER | cellular component disassembly | 114/2897 | 443/18723 | 1.17e-08 | 9.59e-07 | 114 |
| GO:19030081 | Colorectum | SER | organelle disassembly | 36/2897 | 114/18723 | 1.22e-05 | 3.89e-04 | 36 |
| GO:00160421 | Colorectum | SER | lipid catabolic process | 77/2897 | 320/18723 | 3.52e-05 | 9.18e-04 | 77 |
| GO:0046486 | Colorectum | SER | glycerolipid metabolic process | 82/2897 | 392/18723 | 2.26e-03 | 2.17e-02 | 82 |
| GO:00066621 | Colorectum | SER | glycerol ether metabolic process | 9/2897 | 22/18723 | 3.66e-03 | 3.06e-02 | 9 |
| GO:00066441 | Colorectum | SER | phospholipid metabolic process | 79/2897 | 383/18723 | 3.94e-03 | 3.24e-02 | 79 |
| GO:00189041 | Colorectum | SER | ether metabolic process | 10/2897 | 27/18723 | 5.18e-03 | 3.95e-02 | 10 |
| GO:00066501 | Colorectum | SER | glycerophospholipid metabolic process | 64/2897 | 306/18723 | 6.41e-03 | 4.60e-02 | 64 |
| GO:00308564 | Endometrium | AEH | regulation of epithelial cell differentiation | 33/2100 | 154/18723 | 1.81e-04 | 2.32e-03 | 33 |
| GO:00456823 | Endometrium | AEH | regulation of epidermis development | 16/2100 | 65/18723 | 1.81e-03 | 1.44e-02 | 16 |
| Page: 1 2 3 4 5 6 7 8 9 |
| Pathway ID | Tissue | Disease Stage | Description | Gene Ratio | Bg Ratio | pvalue | p.adjust | qvalue | Count |
| hsa04141211 | Esophagus | ESCC | Protein processing in endoplasmic reticulum | 147/4205 | 174/8465 | 3.29e-22 | 1.10e-19 | 5.64e-20 | 147 |
| hsa04141310 | Esophagus | ESCC | Protein processing in endoplasmic reticulum | 147/4205 | 174/8465 | 3.29e-22 | 1.10e-19 | 5.64e-20 | 147 |
| hsa0414122 | Liver | HCC | Protein processing in endoplasmic reticulum | 146/4020 | 174/8465 | 7.34e-24 | 2.46e-21 | 1.37e-21 | 146 |
| hsa0414132 | Liver | HCC | Protein processing in endoplasmic reticulum | 146/4020 | 174/8465 | 7.34e-24 | 2.46e-21 | 1.37e-21 | 146 |
| hsa0414130 | Oral cavity | OSCC | Protein processing in endoplasmic reticulum | 143/3704 | 174/8465 | 6.82e-26 | 2.28e-23 | 1.16e-23 | 143 |
| hsa04141113 | Oral cavity | OSCC | Protein processing in endoplasmic reticulum | 143/3704 | 174/8465 | 6.82e-26 | 2.28e-23 | 1.16e-23 | 143 |
| Page: 1 |
Top |
Cell-cell communication analysis |
| Identification of potential cell-cell interactions between two cell types and their ligand-receptor pairs for different disease states |
| Ligand | Receptor | LRpair | Pathway | Tissue | Disease Stage |
| Page: 1 |
Top |
Single-cell gene regulatory network inference analysis |
| Find out the significant the regulons (TFs) and the target genes of each regulon across cell types for different disease states |
| TF | Cell Type | Tissue | Disease Stage | Target Gene | RSS | Regulon Activity |
| ∗The dot plots of a searched regulon are shown for all cell subpopulations in each disease state of each tissue based on the regulon specific score inferred using pySCENIC and by calculating the average expression. |
| Page: 1 |
Top |
Somatic mutation of malignant transformation related genes |
| Annotation of somatic variants for genes involved in malignant transformation |
| Hugo Symbol | Variant Class | Variant Classification | dbSNP RS | HGVSc | HGVSp | HGVSp Short | SWISSPROT | BIOTYPE | SIFT | PolyPhen | Tumor Sample Barcode | Tissue | Histology | Sex | Age | Stage | Therapy Types | Drugs | Outcome |
| PLAA | SNV | Missense_Mutation | c.2294N>G | p.Ser765Cys | p.S765C | Q9Y263 | protein_coding | deleterious(0) | probably_damaging(0.972) | TCGA-AC-A23H-01 | Breast | breast invasive carcinoma | Female | >=65 | I/II | Unknown | Unknown | PD | |
| PLAA | SNV | Missense_Mutation | rs769694733 | c.1919N>T | p.Ser640Ile | p.S640I | Q9Y263 | protein_coding | tolerated(0.67) | benign(0.021) | TCGA-AR-A0TU-01 | Breast | breast invasive carcinoma | Female | <65 | I/II | Unspecific | Doxorubicin | SD |
| PLAA | SNV | Missense_Mutation | c.1475N>G | p.Asp492Gly | p.D492G | Q9Y263 | protein_coding | deleterious(0.01) | probably_damaging(0.989) | TCGA-D8-A1XK-01 | Breast | breast invasive carcinoma | Female | <65 | I/II | Chemotherapy | doxorubicine+cyclophosphamide | SD | |
| PLAA | insertion | Nonsense_Mutation | novel | c.1905_1906insTGATACCCTGGTGGCCCCAATCCTCTACGCT | p.Gly636Ter | p.G636* | Q9Y263 | protein_coding | TCGA-A2-A0EO-01 | Breast | breast invasive carcinoma | Female | <65 | I/II | Hormone Therapy | tamoxiphen | SD | ||
| PLAA | deletion | Frame_Shift_Del | novel | c.1917delN | p.Phe639LeufsTer9 | p.F639Lfs*9 | Q9Y263 | protein_coding | TCGA-AR-A0TU-01 | Breast | breast invasive carcinoma | Female | <65 | I/II | Unspecific | Doxorubicin | SD | ||
| PLAA | insertion | Frame_Shift_Ins | novel | c.1578_1579insTCAGATTTTGTGGAAA | p.Ala527SerfsTer8 | p.A527Sfs*8 | Q9Y263 | protein_coding | TCGA-B6-A0RE-01 | Breast | breast invasive carcinoma | Female | <65 | I/II | Unknown | Unknown | SD | ||
| PLAA | deletion | Frame_Shift_Del | c.1689delN | p.Glu564LysfsTer5 | p.E564Kfs*5 | Q9Y263 | protein_coding | TCGA-E2-A1II-01 | Breast | breast invasive carcinoma | Female | <65 | I/II | Chemotherapy | doxorubicin | SD | |||
| PLAA | SNV | Missense_Mutation | rs760173766 | c.1087N>A | p.Glu363Lys | p.E363K | Q9Y263 | protein_coding | tolerated(0.09) | probably_damaging(0.986) | TCGA-C5-A2LV-01 | Cervix | cervical & endocervical cancer | Female | <65 | I/II | Unknown | Unknown | SD |
| PLAA | SNV | Missense_Mutation | novel | c.1255N>A | p.Pro419Thr | p.P419T | Q9Y263 | protein_coding | deleterious(0) | probably_damaging(0.995) | TCGA-DS-A1OB-01 | Cervix | cervical & endocervical cancer | Female | <65 | I/II | Chemotherapy | carboplatin | PD |
| PLAA | SNV | Missense_Mutation | novel | c.996C>G | p.Ile332Met | p.I332M | Q9Y263 | protein_coding | deleterious(0) | benign(0.418) | TCGA-VS-A9V4-01 | Cervix | cervical & endocervical cancer | Female | <65 | I/II | Chemotherapy | cisplatin | PD |
| Page: 1 2 3 4 5 6 7 8 |
Top |
Related drugs of malignant transformation related genes |
| Identification of chemicals and drugs interact with genes involved in malignant transfromation |
| (DGIdb 4.0) |
| Entrez ID | Symbol | Category | Interaction Types | Drug Claim Name | Drug Name | PMIDs |
| Page: 1 |

Copyright 2023-Present -The University of Texas Health Science Center at Houston |