
|
|||||
|
 | |
| |
| |
| |
| |
| |
|
Gene: PLA2G7 |
Gene summary for PLA2G7 |
| Gene information | Species | Human | Gene symbol | PLA2G7 | Gene ID | 7941 |
| Gene name | phospholipase A2 group VII | |
| Gene Alias | LDL-PLA2 | |
| Cytomap | 6p12.3 | |
| Gene Type | protein-coding | GO ID | GO:0002376 | UniProtAcc | Q13093 |
Top |
Malignant transformation analysis |
| Identification of the aberrant gene expression in precancerous and cancerous lesions by comparing the gene expression of stem-like cells in diseased tissues with normal stem cells |
| Entrez ID | Symbol | Replicates | Species | Organ | Tissue | Adj P-value | Log2FC | Malignancy |
| 7941 | PLA2G7 | HCC2 | Human | Liver | HCC | 5.82e-05 | 6.14e-01 | 0.5341 |
| 7941 | PLA2G7 | HCC5 | Human | Liver | HCC | 2.57e-02 | 3.37e-01 | 0.4932 |
| 7941 | PLA2G7 | Pt13.a | Human | Liver | HCC | 1.41e-07 | 3.20e-01 | 0.021 |
| 7941 | PLA2G7 | Pt13.c | Human | Liver | HCC | 2.85e-03 | 2.54e-01 | 0.0076 |
| 7941 | PLA2G7 | Pt14.d | Human | Liver | HCC | 3.05e-02 | 1.54e-01 | 0.0143 |
| 7941 | PLA2G7 | S014 | Human | Liver | HCC | 2.66e-13 | 5.20e-01 | 0.2254 |
| 7941 | PLA2G7 | S015 | Human | Liver | HCC | 4.55e-16 | 8.53e-01 | 0.2375 |
| 7941 | PLA2G7 | S016 | Human | Liver | HCC | 1.18e-15 | 8.02e-01 | 0.2243 |
| Page: 1 |
| Tissue | Expression Dynamics | Abbreviation |
| Liver | 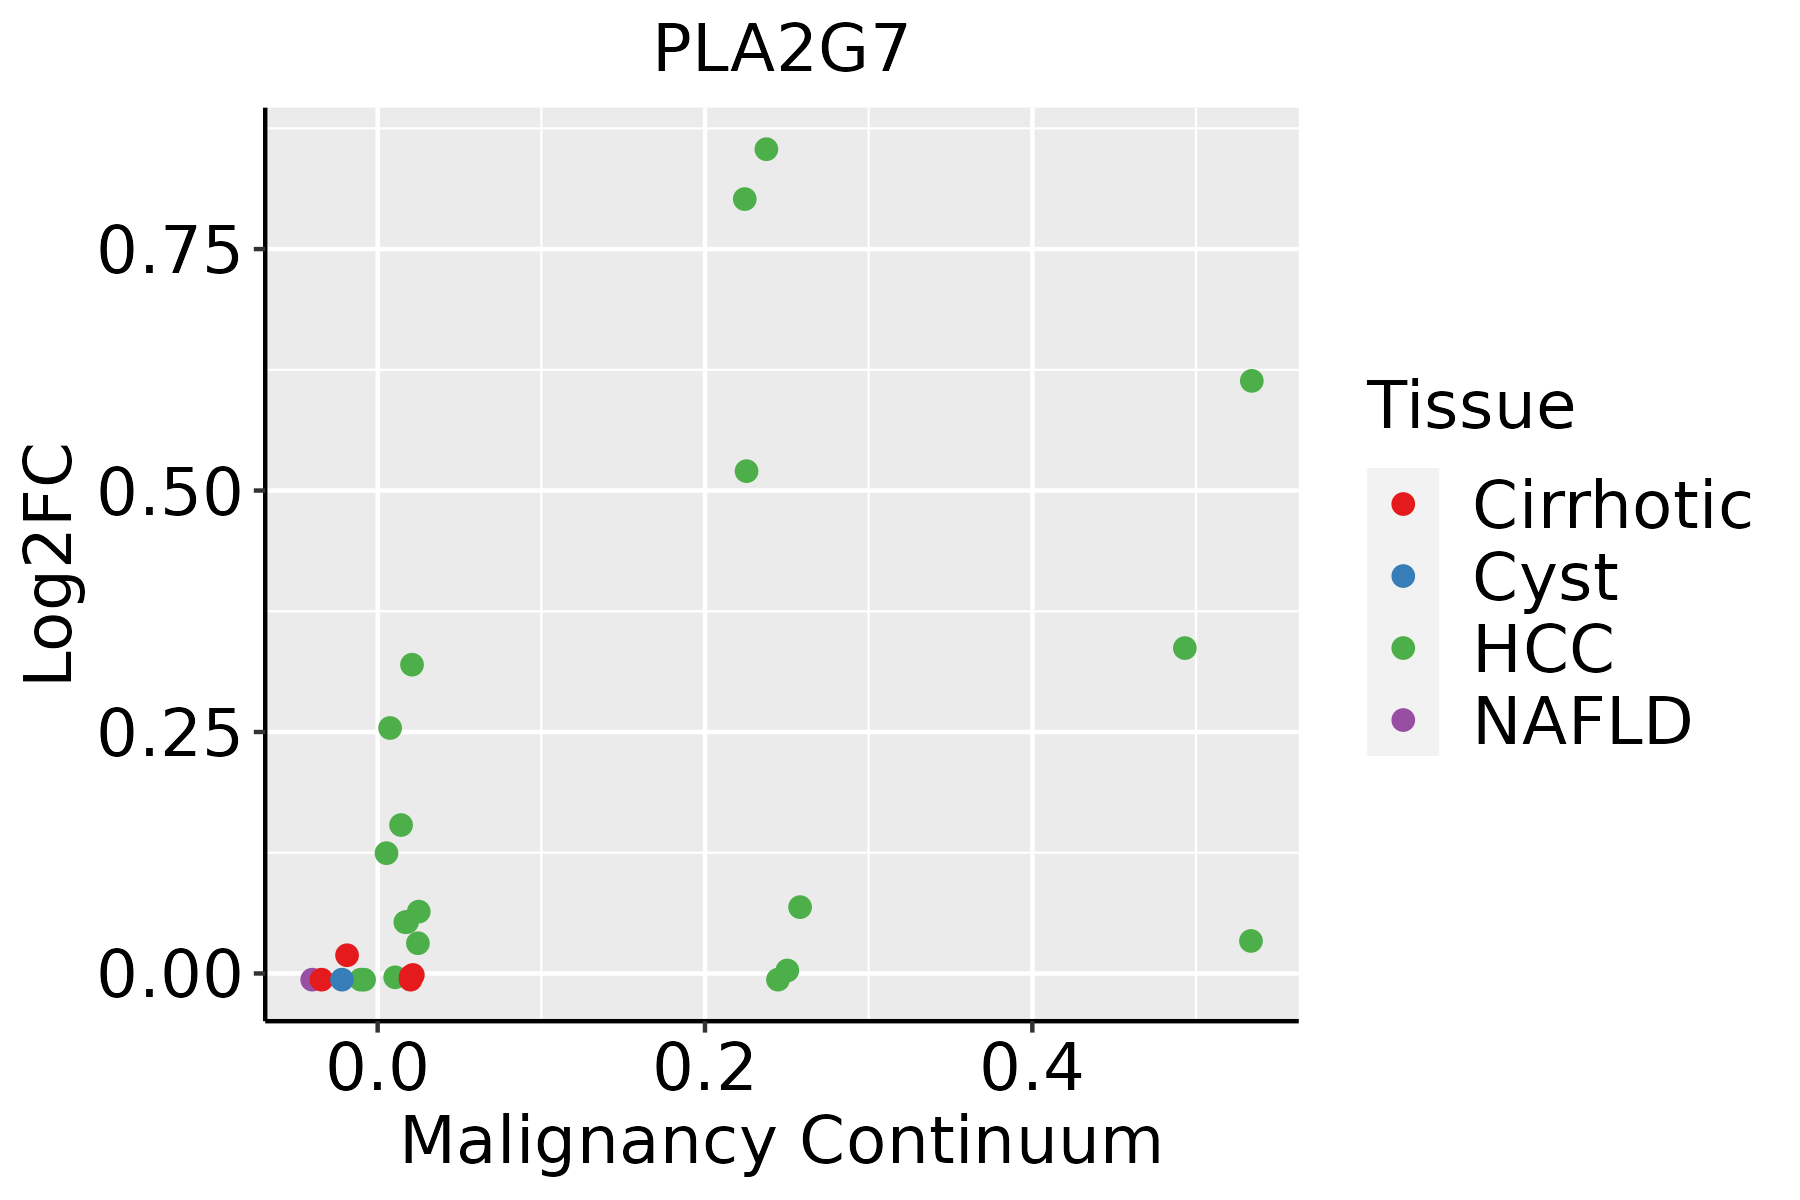 | HCC: Hepatocellular carcinoma |
| NAFLD: Non-alcoholic fatty liver disease |
| ∗log2FC in expression of this searched gene in stem-like cells from each diseased tissue sample relative to stem-like cells in normal samples in each tissue plotted against the malignancy continuum. Samples are colored based on if they are from different disease stage. |
Top |
Malignant transformation related pathway analysis |
| Find out the enriched GO biological processes and KEGG pathways involved in transition from healthy to precancer to cancer |
| Tissue | Disease Stage | Enriched GO biological Processes |
| Colorectum | AD |  |
| Colorectum | SER |  |
| Colorectum | MSS |  |
| Colorectum | MSI-H |  |
| Colorectum | FAP |  |
| ∗Top 15 enriched GO BP terms are showed in the bar plot of each disease state in each tissue. Each row represents a significant GO biological process which is colored according to the -log10(p.adjust). |
| Page: 1 2 3 4 5 6 7 8 9 |
| GO ID | Tissue | Disease Stage | Description | Gene Ratio | Bg Ratio | pvalue | p.adjust | Count |
| GO:004424222 | Liver | HCC | cellular lipid catabolic process | 134/7958 | 214/18723 | 2.07e-09 | 5.79e-08 | 134 |
| GO:00066444 | Liver | HCC | phospholipid metabolic process | 214/7958 | 383/18723 | 7.25e-08 | 1.48e-06 | 214 |
| GO:003444021 | Liver | HCC | lipid oxidation | 73/7958 | 108/18723 | 1.17e-07 | 2.25e-06 | 73 |
| GO:004648611 | Liver | HCC | glycerolipid metabolic process | 215/7958 | 392/18723 | 4.54e-07 | 7.49e-06 | 215 |
| GO:003025821 | Liver | HCC | lipid modification | 123/7958 | 212/18723 | 3.50e-06 | 4.58e-05 | 123 |
| GO:001604221 | Liver | HCC | lipid catabolic process | 175/7958 | 320/18723 | 6.50e-06 | 7.88e-05 | 175 |
| GO:00066504 | Liver | HCC | glycerophospholipid metabolic process | 168/7958 | 306/18723 | 7.27e-06 | 8.62e-05 | 168 |
| GO:00464342 | Liver | HCC | organophosphate catabolic process | 89/7958 | 155/18723 | 1.24e-04 | 1.03e-03 | 89 |
| Page: 1 |
| Pathway ID | Tissue | Disease Stage | Description | Gene Ratio | Bg Ratio | pvalue | p.adjust | qvalue | Count |
| Page: 1 |
Top |
Cell-cell communication analysis |
| Identification of potential cell-cell interactions between two cell types and their ligand-receptor pairs for different disease states |
| Ligand | Receptor | LRpair | Pathway | Tissue | Disease Stage |
| Page: 1 |
Top |
Single-cell gene regulatory network inference analysis |
| Find out the significant the regulons (TFs) and the target genes of each regulon across cell types for different disease states |
| TF | Cell Type | Tissue | Disease Stage | Target Gene | RSS | Regulon Activity |
| ∗The dot plots of a searched regulon are shown for all cell subpopulations in each disease state of each tissue based on the regulon specific score inferred using pySCENIC and by calculating the average expression. |
| Page: 1 |
Top |
Somatic mutation of malignant transformation related genes |
| Annotation of somatic variants for genes involved in malignant transformation |
| Hugo Symbol | Variant Class | Variant Classification | dbSNP RS | HGVSc | HGVSp | HGVSp Short | SWISSPROT | BIOTYPE | SIFT | PolyPhen | Tumor Sample Barcode | Tissue | Histology | Sex | Age | Stage | Therapy Types | Drugs | Outcome |
| PLA2G7 | SNV | Missense_Mutation | rs201567357 | c.653G>A | p.Arg218Gln | p.R218Q | Q13093 | protein_coding | deleterious(0) | probably_damaging(1) | TCGA-AN-A046-01 | Breast | breast invasive carcinoma | Female | >=65 | I/II | Unknown | Unknown | SD |
| PLA2G7 | SNV | Missense_Mutation | c.187T>A | p.Tyr63Asn | p.Y63N | Q13093 | protein_coding | tolerated(0.21) | possibly_damaging(0.47) | TCGA-AN-A0FL-01 | Breast | breast invasive carcinoma | Female | <65 | I/II | Unknown | Unknown | SD | |
| PLA2G7 | SNV | Missense_Mutation | c.782N>G | p.Ser261Cys | p.S261C | Q13093 | protein_coding | deleterious(0.01) | probably_damaging(0.983) | TCGA-BH-A2L8-01 | Breast | breast invasive carcinoma | Female | <65 | I/II | Chemotherapy | cytoxan | CR | |
| PLA2G7 | SNV | Missense_Mutation | novel | c.1237N>A | p.Asp413Asn | p.D413N | Q13093 | protein_coding | tolerated(0.23) | benign(0.028) | TCGA-E9-A1NF-01 | Breast | breast invasive carcinoma | Female | <65 | I/II | Chemotherapy | doxorubicin | PD |
| PLA2G7 | deletion | Frame_Shift_Del | c.948delN | p.Phe316LeufsTer14 | p.F316Lfs*14 | Q13093 | protein_coding | TCGA-AN-A0AK-01 | Breast | breast invasive carcinoma | Female | >=65 | I/II | Unknown | Unknown | SD | |||
| PLA2G7 | SNV | Missense_Mutation | novel | c.1029N>A | p.Met343Ile | p.M343I | Q13093 | protein_coding | tolerated(0.58) | possibly_damaging(0.902) | TCGA-C5-A1BQ-01 | Cervix | cervical & endocervical cancer | Female | >=65 | III/IV | Chemotherapy | cisplatin | CR |
| PLA2G7 | SNV | Missense_Mutation | c.946N>G | p.Phe316Val | p.F316V | Q13093 | protein_coding | deleterious(0) | probably_damaging(1) | TCGA-FU-A3HZ-01 | Cervix | cervical & endocervical cancer | Female | <65 | I/II | Chemotherapy | cisplatin | CR | |
| PLA2G7 | SNV | Missense_Mutation | c.271N>A | p.Asp91Asn | p.D91N | Q13093 | protein_coding | tolerated(0.13) | benign(0.176) | TCGA-A6-2686-01 | Colorectum | colon adenocarcinoma | Female | >=65 | I/II | Unknown | Unknown | SD | |
| PLA2G7 | SNV | Missense_Mutation | c.1139N>A | p.Ala380Asp | p.A380D | Q13093 | protein_coding | deleterious(0) | probably_damaging(1) | TCGA-AA-3510-01 | Colorectum | colon adenocarcinoma | Male | >=65 | I/II | Unknown | Unknown | SD | |
| PLA2G7 | SNV | Missense_Mutation | c.761A>G | p.Asp254Gly | p.D254G | Q13093 | protein_coding | deleterious(0.02) | benign(0.127) | TCGA-AA-3977-01 | Colorectum | colon adenocarcinoma | Male | >=65 | I/II | Unknown | Unknown | SD |
| Page: 1 2 3 4 5 |
Top |
Related drugs of malignant transformation related genes |
| Identification of chemicals and drugs interact with genes involved in malignant transfromation |
| (DGIdb 4.0) |
| Entrez ID | Symbol | Category | Interaction Types | Drug Claim Name | Drug Name | PMIDs |
| 7941 | PLA2G7 | DRUGGABLE GENOME, ENZYME | inhibitor | 178103948 | RILAPLADIB | |
| 7941 | PLA2G7 | DRUGGABLE GENOME, ENZYME | inhibitor | CHEMBL2104981 | RILAPLADIB | |
| 7941 | PLA2G7 | DRUGGABLE GENOME, ENZYME | Rilapladib | RILAPLADIB | ||
| 7941 | PLA2G7 | DRUGGABLE GENOME, ENZYME | DARAPLADIB | DARAPLADIB | ||
| 7941 | PLA2G7 | DRUGGABLE GENOME, ENZYME | inhibitor | 354702268 | ||
| 7941 | PLA2G7 | DRUGGABLE GENOME, ENZYME | Indolizine derivative 1 | |||
| 7941 | PLA2G7 | DRUGGABLE GENOME, ENZYME | inhibitor | 354702269 | ||
| 7941 | PLA2G7 | DRUGGABLE GENOME, ENZYME | inhibitor | 375973250 | ||
| 7941 | PLA2G7 | DRUGGABLE GENOME, ENZYME | ERYTHROPOIETIN | EPOETIN BETA | 16421163 | |
| 7941 | PLA2G7 | DRUGGABLE GENOME, ENZYME | GSK2647544 |
| Page: 1 2 |

Copyright 2023-Present -The University of Texas Health Science Center at Houston |