
|
|||||
|
 | |
| |
| |
| |
| |
| |
|
Gene: PLA2G4A |
Gene summary for PLA2G4A |
| Gene information | Species | Human | Gene symbol | PLA2G4A | Gene ID | 5321 |
| Gene name | phospholipase A2 group IVA | |
| Gene Alias | GURDP | |
| Cytomap | 1q31.1 | |
| Gene Type | protein-coding | GO ID | GO:0001516 | UniProtAcc | B4DZI4 |
Top |
Malignant transformation analysis |
| Identification of the aberrant gene expression in precancerous and cancerous lesions by comparing the gene expression of stem-like cells in diseased tissues with normal stem cells |
| Entrez ID | Symbol | Replicates | Species | Organ | Tissue | Adj P-value | Log2FC | Malignancy |
| 5321 | PLA2G4A | AEH-subject1 | Human | Endometrium | AEH | 2.48e-11 | 4.12e-01 | -0.3059 |
| 5321 | PLA2G4A | EEC-subject3 | Human | Endometrium | EEC | 1.41e-21 | 8.17e-01 | -0.2525 |
| 5321 | PLA2G4A | GSM6177622_NYU_UCEC3_lib1_lib1 | Human | Endometrium | EEC | 1.12e-03 | -4.38e-02 | -0.1917 |
| 5321 | PLA2G4A | P9T-E | Human | Esophagus | ESCC | 1.64e-23 | 5.21e-01 | 0.1131 |
| 5321 | PLA2G4A | P10T-E | Human | Esophagus | ESCC | 4.71e-04 | 1.82e-02 | 0.116 |
| 5321 | PLA2G4A | P11T-E | Human | Esophagus | ESCC | 3.52e-06 | 3.34e-01 | 0.1426 |
| 5321 | PLA2G4A | P16T-E | Human | Esophagus | ESCC | 1.29e-06 | 8.82e-02 | 0.1153 |
| 5321 | PLA2G4A | P19T-E | Human | Esophagus | ESCC | 1.08e-07 | 4.21e-01 | 0.1662 |
| 5321 | PLA2G4A | P22T-E | Human | Esophagus | ESCC | 1.55e-10 | 7.76e-02 | 0.1236 |
| 5321 | PLA2G4A | P23T-E | Human | Esophagus | ESCC | 2.68e-05 | 2.14e-01 | 0.108 |
| 5321 | PLA2G4A | P26T-E | Human | Esophagus | ESCC | 6.03e-07 | 6.04e-02 | 0.1276 |
| 5321 | PLA2G4A | P30T-E | Human | Esophagus | ESCC | 1.97e-17 | 7.59e-01 | 0.137 |
| 5321 | PLA2G4A | P31T-E | Human | Esophagus | ESCC | 7.57e-20 | 4.55e-01 | 0.1251 |
| 5321 | PLA2G4A | P32T-E | Human | Esophagus | ESCC | 9.41e-06 | 1.09e-01 | 0.1666 |
| 5321 | PLA2G4A | P39T-E | Human | Esophagus | ESCC | 1.35e-02 | 1.93e-02 | 0.0894 |
| 5321 | PLA2G4A | P42T-E | Human | Esophagus | ESCC | 2.63e-05 | 1.93e-01 | 0.1175 |
| 5321 | PLA2G4A | P52T-E | Human | Esophagus | ESCC | 7.51e-05 | 1.54e-02 | 0.1555 |
| 5321 | PLA2G4A | P54T-E | Human | Esophagus | ESCC | 5.95e-04 | 1.22e-01 | 0.0975 |
| 5321 | PLA2G4A | P57T-E | Human | Esophagus | ESCC | 2.67e-02 | 8.10e-02 | 0.0926 |
| 5321 | PLA2G4A | P62T-E | Human | Esophagus | ESCC | 3.86e-10 | 8.21e-02 | 0.1302 |
| Page: 1 2 |
| Tissue | Expression Dynamics | Abbreviation |
| Endometrium |  | AEH: Atypical endometrial hyperplasia |
| EEC: Endometrioid Cancer | ||
| Esophagus | 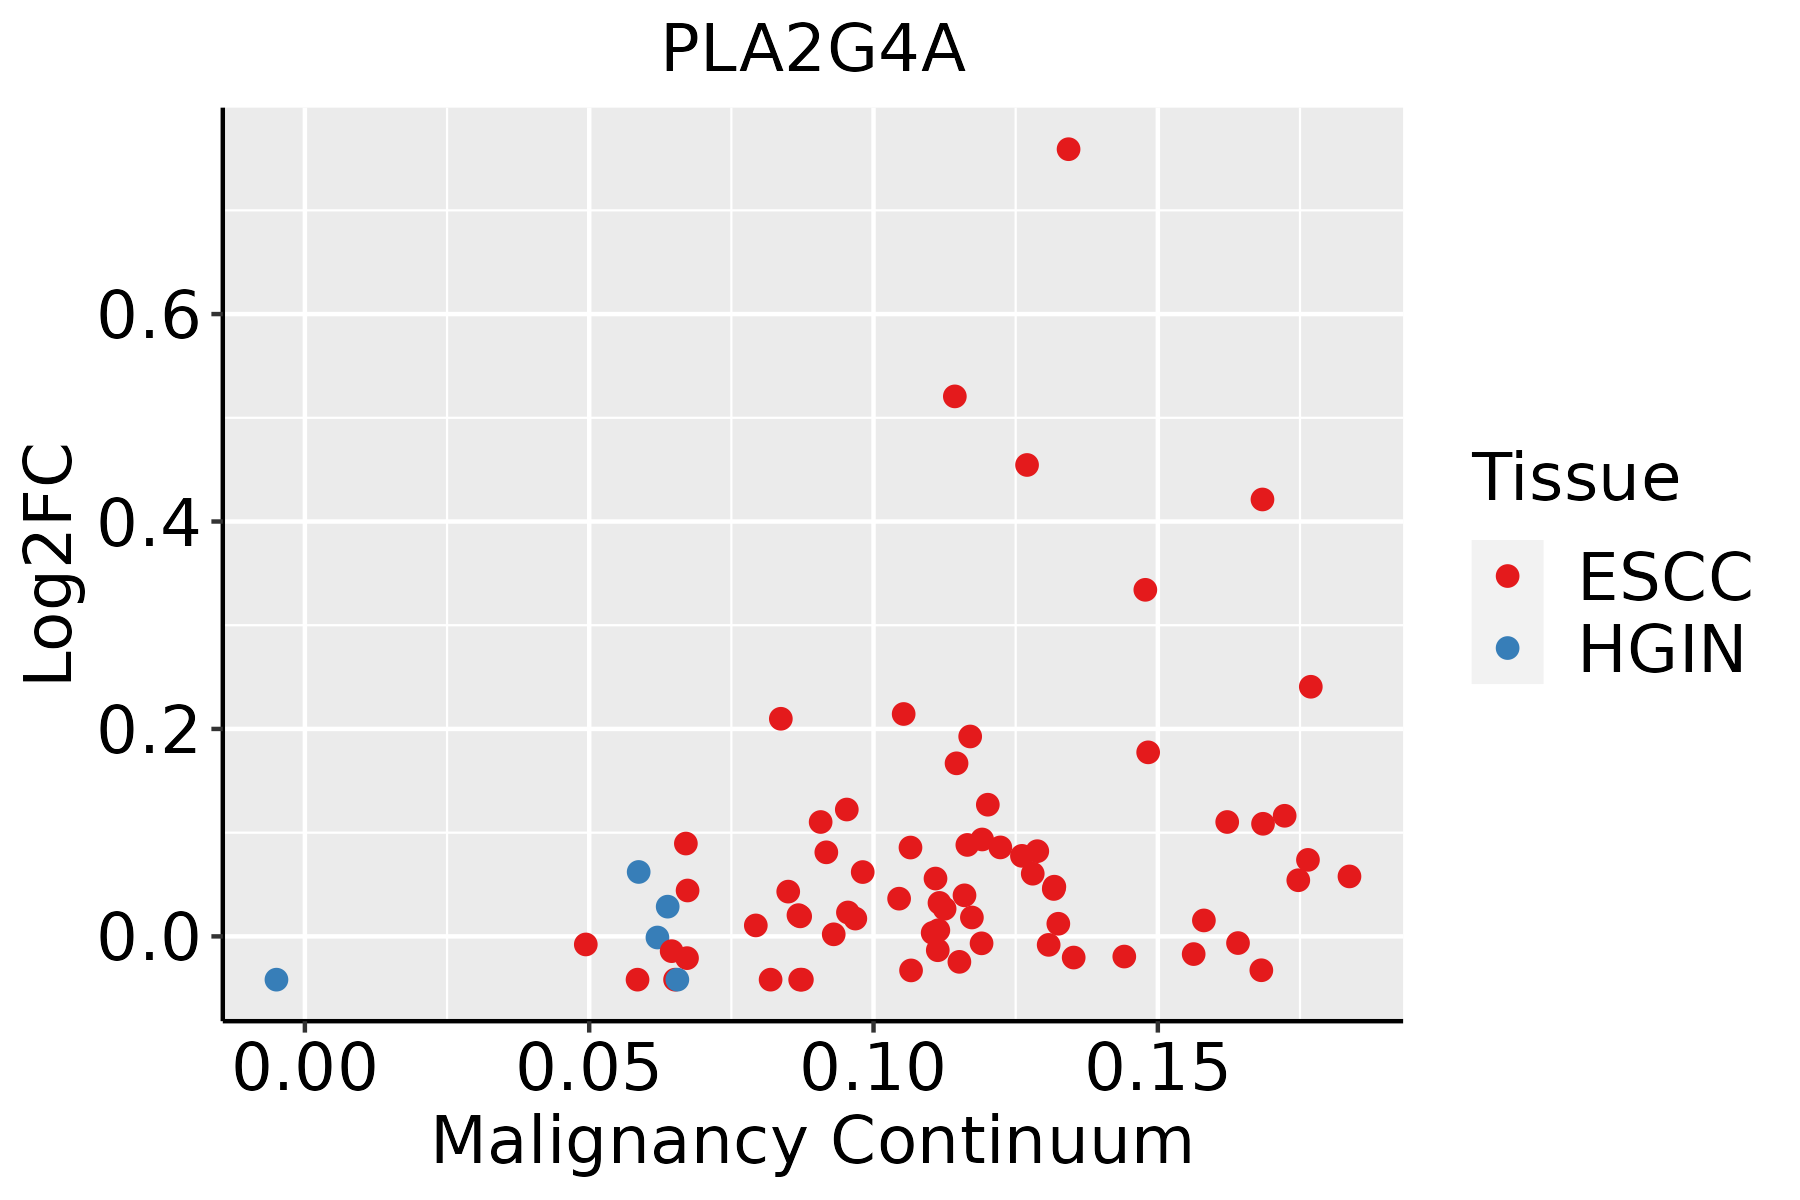 | ESCC: Esophageal squamous cell carcinoma |
| HGIN: High-grade intraepithelial neoplasias | ||
| LGIN: Low-grade intraepithelial neoplasias |
| ∗log2FC in expression of this searched gene in stem-like cells from each diseased tissue sample relative to stem-like cells in normal samples in each tissue plotted against the malignancy continuum. Samples are colored based on if they are from different disease stage. |
Top |
Malignant transformation related pathway analysis |
| Find out the enriched GO biological processes and KEGG pathways involved in transition from healthy to precancer to cancer |
| Tissue | Disease Stage | Enriched GO biological Processes |
| Colorectum | AD |  |
| Colorectum | SER |  |
| Colorectum | MSS |  |
| Colorectum | MSI-H |  |
| Colorectum | FAP |  |
| ∗Top 15 enriched GO BP terms are showed in the bar plot of each disease state in each tissue. Each row represents a significant GO biological process which is colored according to the -log10(p.adjust). |
| Page: 1 2 3 4 5 6 7 8 9 |
| GO ID | Tissue | Disease Stage | Description | Gene Ratio | Bg Ratio | pvalue | p.adjust | Count |
| GO:004206016 | Endometrium | AEH | wound healing | 91/2100 | 422/18723 | 4.85e-10 | 4.61e-08 | 91 |
| GO:00075967 | Endometrium | AEH | blood coagulation | 43/2100 | 217/18723 | 1.42e-04 | 1.89e-03 | 43 |
| GO:00075997 | Endometrium | AEH | hemostasis | 43/2100 | 222/18723 | 2.39e-04 | 2.86e-03 | 43 |
| GO:00508177 | Endometrium | AEH | coagulation | 43/2100 | 222/18723 | 2.39e-04 | 2.86e-03 | 43 |
| GO:005087815 | Endometrium | AEH | regulation of body fluid levels | 64/2100 | 379/18723 | 5.40e-04 | 5.44e-03 | 64 |
| GO:00301683 | Endometrium | AEH | platelet activation | 25/2100 | 123/18723 | 2.26e-03 | 1.74e-02 | 25 |
| GO:00712364 | Endometrium | AEH | cellular response to antibiotic | 6/2100 | 14/18723 | 2.67e-03 | 1.94e-02 | 6 |
| GO:00466772 | Endometrium | AEH | response to antibiotic | 12/2100 | 47/18723 | 4.72e-03 | 3.00e-02 | 12 |
| GO:004206017 | Endometrium | EEC | wound healing | 92/2168 | 422/18723 | 1.12e-09 | 9.58e-08 | 92 |
| GO:000759613 | Endometrium | EEC | blood coagulation | 44/2168 | 217/18723 | 1.42e-04 | 1.84e-03 | 44 |
| GO:000759913 | Endometrium | EEC | hemostasis | 44/2168 | 222/18723 | 2.43e-04 | 2.85e-03 | 44 |
| GO:005081713 | Endometrium | EEC | coagulation | 44/2168 | 222/18723 | 2.43e-04 | 2.85e-03 | 44 |
| GO:005087816 | Endometrium | EEC | regulation of body fluid levels | 65/2168 | 379/18723 | 7.48e-04 | 7.05e-03 | 65 |
| GO:007123611 | Endometrium | EEC | cellular response to antibiotic | 6/2168 | 14/18723 | 3.15e-03 | 2.16e-02 | 6 |
| GO:003016811 | Endometrium | EEC | platelet activation | 25/2168 | 123/18723 | 3.47e-03 | 2.35e-02 | 25 |
| GO:004667711 | Endometrium | EEC | response to antibiotic | 12/2168 | 47/18723 | 6.10e-03 | 3.60e-02 | 12 |
| GO:00086544 | Esophagus | ESCC | phospholipid biosynthetic process | 162/8552 | 253/18723 | 2.59e-09 | 5.73e-08 | 162 |
| GO:00464744 | Esophagus | ESCC | glycerophospholipid biosynthetic process | 135/8552 | 211/18723 | 5.75e-08 | 1.02e-06 | 135 |
| GO:004206027 | Esophagus | ESCC | wound healing | 243/8552 | 422/18723 | 4.62e-07 | 6.25e-06 | 243 |
| GO:00450175 | Esophagus | ESCC | glycerolipid biosynthetic process | 154/8552 | 252/18723 | 5.20e-07 | 6.96e-06 | 154 |
| Page: 1 2 |
| Pathway ID | Tissue | Disease Stage | Description | Gene Ratio | Bg Ratio | pvalue | p.adjust | qvalue | Count |
| hsa0466614 | Endometrium | AEH | Fc gamma R-mediated phagocytosis | 27/1197 | 97/8465 | 3.02e-04 | 2.39e-03 | 1.75e-03 | 27 |
| hsa0466615 | Endometrium | AEH | Fc gamma R-mediated phagocytosis | 27/1197 | 97/8465 | 3.02e-04 | 2.39e-03 | 1.75e-03 | 27 |
| hsa0466621 | Endometrium | EEC | Fc gamma R-mediated phagocytosis | 27/1237 | 97/8465 | 5.15e-04 | 3.83e-03 | 2.85e-03 | 27 |
| hsa0466631 | Endometrium | EEC | Fc gamma R-mediated phagocytosis | 27/1237 | 97/8465 | 5.15e-04 | 3.83e-03 | 2.85e-03 | 27 |
| Page: 1 |
Top |
Cell-cell communication analysis |
| Identification of potential cell-cell interactions between two cell types and their ligand-receptor pairs for different disease states |
| Ligand | Receptor | LRpair | Pathway | Tissue | Disease Stage |
| Page: 1 |
Top |
Single-cell gene regulatory network inference analysis |
| Find out the significant the regulons (TFs) and the target genes of each regulon across cell types for different disease states |
| TF | Cell Type | Tissue | Disease Stage | Target Gene | RSS | Regulon Activity |
| ∗The dot plots of a searched regulon are shown for all cell subpopulations in each disease state of each tissue based on the regulon specific score inferred using pySCENIC and by calculating the average expression. |
| Page: 1 |
Top |
Somatic mutation of malignant transformation related genes |
| Annotation of somatic variants for genes involved in malignant transformation |
| Hugo Symbol | Variant Class | Variant Classification | dbSNP RS | HGVSc | HGVSp | HGVSp Short | SWISSPROT | BIOTYPE | SIFT | PolyPhen | Tumor Sample Barcode | Tissue | Histology | Sex | Age | Stage | Therapy Types | Drugs | Outcome |
| PLA2G4A | SNV | Missense_Mutation | novel | c.1837N>C | p.Asp613His | p.D613H | P47712 | protein_coding | deleterious(0) | probably_damaging(0.995) | TCGA-5L-AAT1-01 | Breast | breast invasive carcinoma | Female | <65 | III/IV | Hormone Therapy | letrozol | SD |
| PLA2G4A | SNV | Missense_Mutation | c.704N>T | p.Ser235Leu | p.S235L | P47712 | protein_coding | deleterious(0) | probably_damaging(0.999) | TCGA-A1-A0SI-01 | Breast | breast invasive carcinoma | Female | <65 | I/II | Unknown | Unknown | SD | |
| PLA2G4A | SNV | Missense_Mutation | novel | c.424N>T | p.Pro142Ser | p.P142S | P47712 | protein_coding | tolerated(0.56) | benign(0.003) | TCGA-A7-A6VY-01 | Breast | breast invasive carcinoma | Female | <65 | I/II | Chemotherapy | cyclophosphamide | CR |
| PLA2G4A | SNV | Missense_Mutation | c.1430N>G | p.Ala477Gly | p.A477G | P47712 | protein_coding | tolerated(0.12) | benign(0.075) | TCGA-A8-A07G-01 | Breast | breast invasive carcinoma | Female | >=65 | I/II | Chemotherapy | 5-fluorouracil | CR | |
| PLA2G4A | SNV | Missense_Mutation | c.1893G>C | p.Glu631Asp | p.E631D | P47712 | protein_coding | tolerated(0.3) | benign(0.003) | TCGA-AC-A23H-01 | Breast | breast invasive carcinoma | Female | >=65 | I/II | Unknown | Unknown | PD | |
| PLA2G4A | SNV | Missense_Mutation | novel | c.841N>G | p.Lys281Glu | p.K281E | P47712 | protein_coding | tolerated(0.72) | benign(0.007) | TCGA-AC-A8OP-01 | Breast | breast invasive carcinoma | Female | >=65 | I/II | Unknown | Unknown | SD |
| PLA2G4A | SNV | Missense_Mutation | c.1118T>G | p.Phe373Cys | p.F373C | P47712 | protein_coding | deleterious(0) | probably_damaging(0.995) | TCGA-AN-A046-01 | Breast | breast invasive carcinoma | Female | >=65 | I/II | Unknown | Unknown | SD | |
| PLA2G4A | SNV | Missense_Mutation | c.1757N>T | p.Pro586Leu | p.P586L | P47712 | protein_coding | deleterious(0) | probably_damaging(1) | TCGA-AO-A1KS-01 | Breast | breast invasive carcinoma | Female | >=65 | I/II | Hormone Therapy | arimidex | SD | |
| PLA2G4A | SNV | Missense_Mutation | c.768G>T | p.Met256Ile | p.M256I | P47712 | protein_coding | tolerated(0.06) | benign(0.38) | TCGA-C8-A1HM-01 | Breast | breast invasive carcinoma | Female | >=65 | I/II | Chemotherapy | doxorubicin | CR | |
| PLA2G4A | SNV | Missense_Mutation | c.1445G>C | p.Arg482Thr | p.R482T | P47712 | protein_coding | deleterious(0.01) | probably_damaging(0.999) | TCGA-C8-A1HM-01 | Breast | breast invasive carcinoma | Female | >=65 | I/II | Chemotherapy | doxorubicin | CR |
| Page: 1 2 3 4 5 6 7 8 9 10 11 12 13 |
Top |
Related drugs of malignant transformation related genes |
| Identification of chemicals and drugs interact with genes involved in malignant transfromation |
| (DGIdb 4.0) |
| Entrez ID | Symbol | Category | Interaction Types | Drug Claim Name | Drug Name | PMIDs |
| 5321 | PLA2G4A | ENZYME, DRUGGABLE GENOME | FLUOROMETHOLONE | FLUOROMETHOLONE | ||
| 5321 | PLA2G4A | ENZYME, DRUGGABLE GENOME | FLURANDRENOLIDE | FLURANDRENOLIDE | ||
| 5321 | PLA2G4A | ENZYME, DRUGGABLE GENOME | MEDRYSONE | MEDRYSONE | ||
| 5321 | PLA2G4A | ENZYME, DRUGGABLE GENOME | FLUTICASONE PROPIONATE | |||
| 5321 | PLA2G4A | ENZYME, DRUGGABLE GENOME | FLUNISOLIDE | FLUNISOLIDE | ||
| 5321 | PLA2G4A | ENZYME, DRUGGABLE GENOME | Pyrazolones | 26398624 | ||
| 5321 | PLA2G4A | ENZYME, DRUGGABLE GENOME | propionic acid derivatives | 26398624 | ||
| 5321 | PLA2G4A | ENZYME, DRUGGABLE GENOME | diclofenac | DICLOFENAC | 26398624 | |
| 5321 | PLA2G4A | ENZYME, DRUGGABLE GENOME | atenolol | ATENOLOL | ||
| 5321 | PLA2G4A | ENZYME, DRUGGABLE GENOME | FLUOCINOLONE ACETONIDE |
| Page: 1 2 |

Copyright 2023-Present -The University of Texas Health Science Center at Houston |