
|
|||||
|
 | |
| |
| |
| |
| |
| |
|
Gene: PLA2G2A |
Gene summary for PLA2G2A |
| Gene information | Species | Human | Gene symbol | PLA2G2A | Gene ID | 5320 |
| Gene name | phospholipase A2 group IIA | |
| Gene Alias | MOM1 | |
| Cytomap | 1p36.13 | |
| Gene Type | protein-coding | GO ID | GO:0000165 | UniProtAcc | A0A024RA96 |
Top |
Malignant transformation analysis |
| Identification of the aberrant gene expression in precancerous and cancerous lesions by comparing the gene expression of stem-like cells in diseased tissues with normal stem cells |
| Entrez ID | Symbol | Replicates | Species | Organ | Tissue | Adj P-value | Log2FC | Malignancy |
| 5320 | PLA2G2A | HTA11_2487_2000001011 | Human | Colorectum | SER | 1.06e-03 | 8.13e-01 | -0.1808 |
| 5320 | PLA2G2A | HTA11_347_2000001011 | Human | Colorectum | AD | 1.33e-71 | 2.74e+00 | -0.1954 |
| 5320 | PLA2G2A | HTA11_411_2000001011 | Human | Colorectum | SER | 5.38e-11 | 1.92e+00 | -0.2602 |
| 5320 | PLA2G2A | HTA11_2112_2000001011 | Human | Colorectum | SER | 3.16e-10 | 1.96e+00 | -0.2196 |
| 5320 | PLA2G2A | HTA11_3361_2000001011 | Human | Colorectum | AD | 4.67e-08 | 1.18e+00 | -0.1207 |
| 5320 | PLA2G2A | HTA11_83_2000001011 | Human | Colorectum | SER | 1.92e-18 | 1.59e+00 | -0.1526 |
| 5320 | PLA2G2A | HTA11_696_2000001011 | Human | Colorectum | AD | 5.14e-100 | 4.18e+00 | -0.1464 |
| 5320 | PLA2G2A | HTA11_1391_2000001011 | Human | Colorectum | AD | 4.58e-34 | 2.53e+00 | -0.059 |
| 5320 | PLA2G2A | HTA11_2992_2000001011 | Human | Colorectum | SER | 8.87e-06 | 1.36e+00 | -0.1706 |
| 5320 | PLA2G2A | HTA11_5212_2000001011 | Human | Colorectum | AD | 4.79e-20 | 2.32e+00 | -0.2061 |
| 5320 | PLA2G2A | HTA11_5216_2000001011 | Human | Colorectum | SER | 9.62e-08 | 1.42e+00 | -0.1462 |
| 5320 | PLA2G2A | HTA11_546_2000001011 | Human | Colorectum | AD | 3.15e-17 | 2.24e+00 | -0.0842 |
| 5320 | PLA2G2A | HTA11_7862_2000001011 | Human | Colorectum | AD | 1.74e-23 | 1.61e+00 | -0.0179 |
| 5320 | PLA2G2A | HTA11_866_3004761011 | Human | Colorectum | AD | 1.14e-03 | 9.06e-01 | 0.096 |
| 5320 | PLA2G2A | HTA11_11156_2000001011 | Human | Colorectum | AD | 2.26e-05 | 1.45e+00 | 0.0397 |
| 5320 | PLA2G2A | HTA11_6818_2000001021 | Human | Colorectum | AD | 3.88e-02 | -2.65e-01 | 0.0588 |
| 5320 | PLA2G2A | HTA11_99999970781_79442 | Human | Colorectum | MSS | 7.56e-13 | 9.99e-01 | 0.294 |
| 5320 | PLA2G2A | HTA11_99999965062_69753 | Human | Colorectum | MSI-H | 1.33e-03 | 3.67e+00 | 0.3487 |
| 5320 | PLA2G2A | HTA11_99999971662_82457 | Human | Colorectum | MSS | 8.94e-11 | -2.65e-01 | 0.3859 |
| 5320 | PLA2G2A | HTA11_99999974143_84620 | Human | Colorectum | MSS | 4.12e-07 | -2.61e-01 | 0.3005 |
| Page: 1 2 3 |
| Tissue | Expression Dynamics | Abbreviation |
| Colorectum (GSE201348) |  | FAP: Familial adenomatous polyposis |
| CRC: Colorectal cancer | ||
| Colorectum (HTA11) |  | AD: Adenomas |
| SER: Sessile serrated lesions | ||
| MSI-H: Microsatellite-high colorectal cancer | ||
| MSS: Microsatellite stable colorectal cancer | ||
| Esophagus | 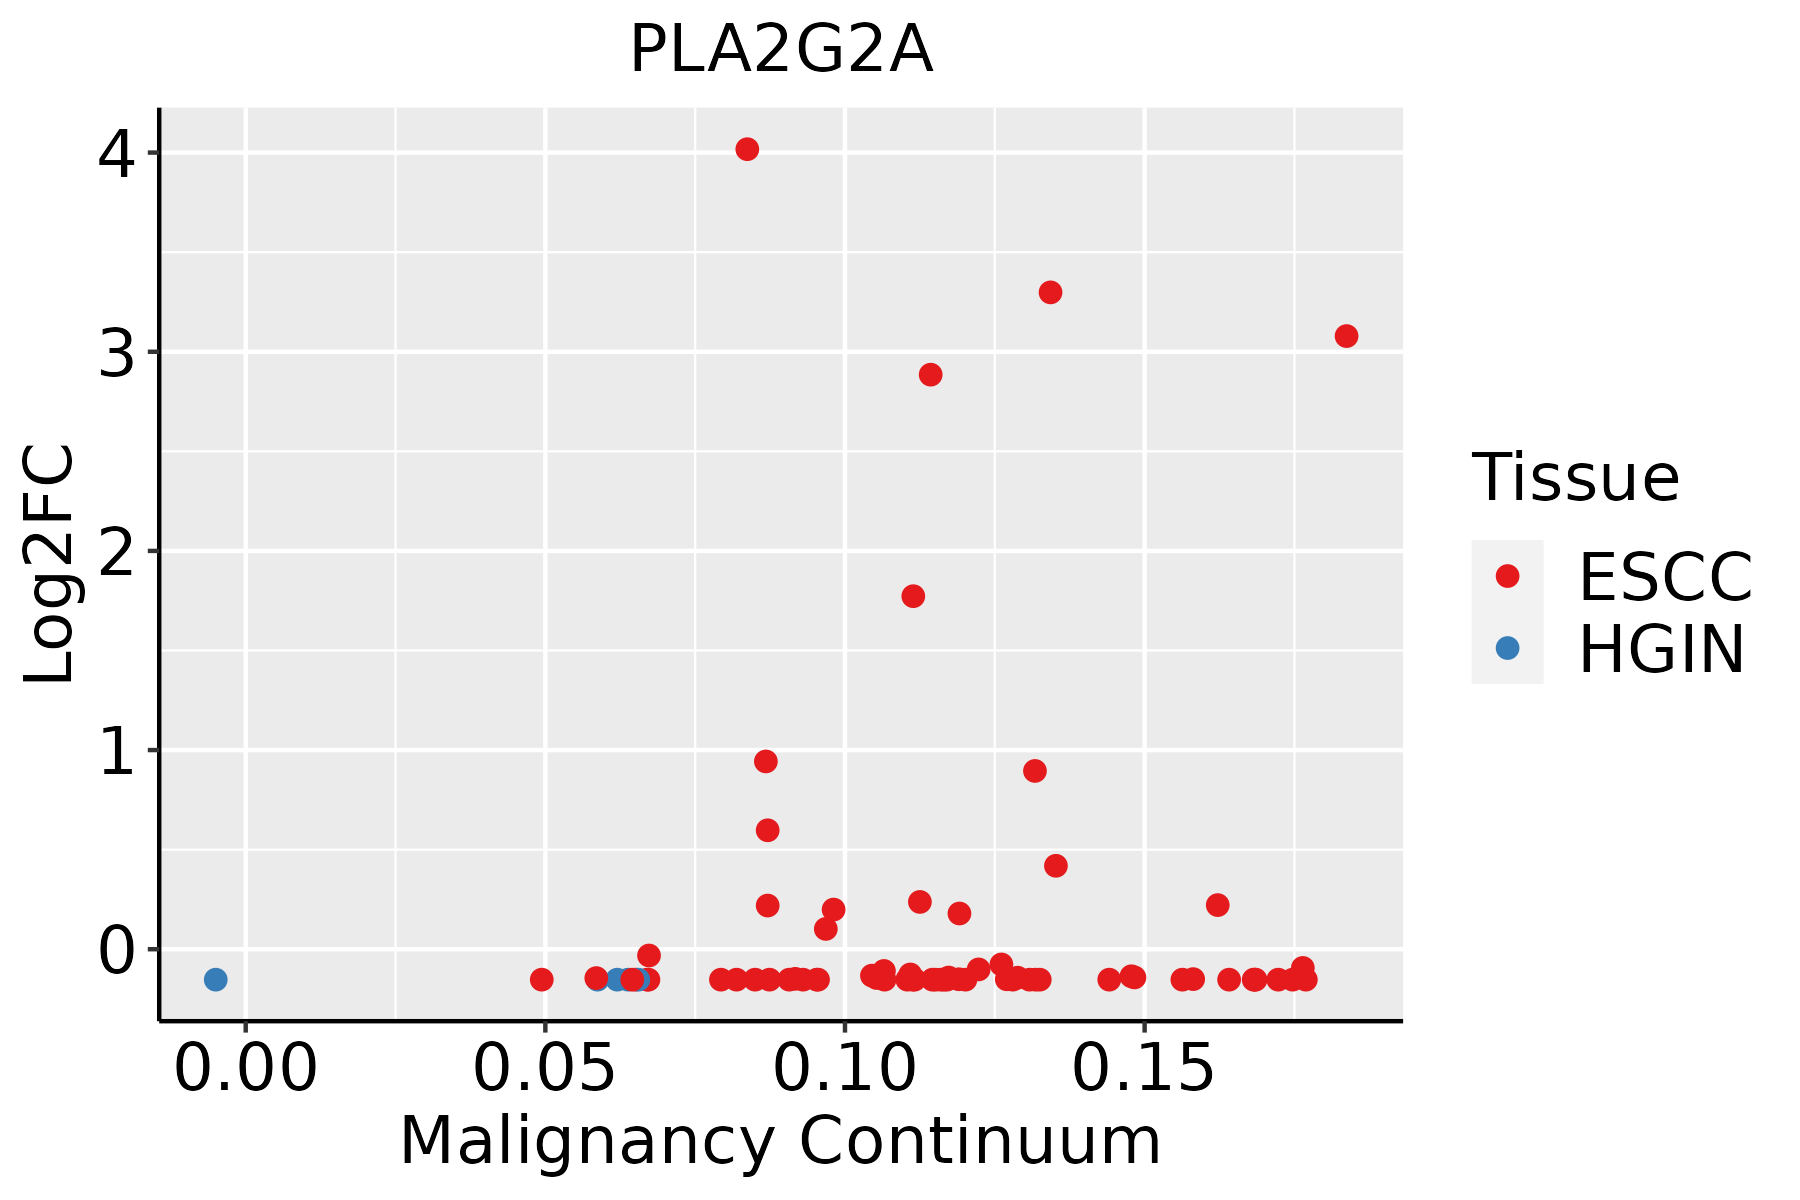 | ESCC: Esophageal squamous cell carcinoma |
| HGIN: High-grade intraepithelial neoplasias | ||
| LGIN: Low-grade intraepithelial neoplasias | ||
| Liver | 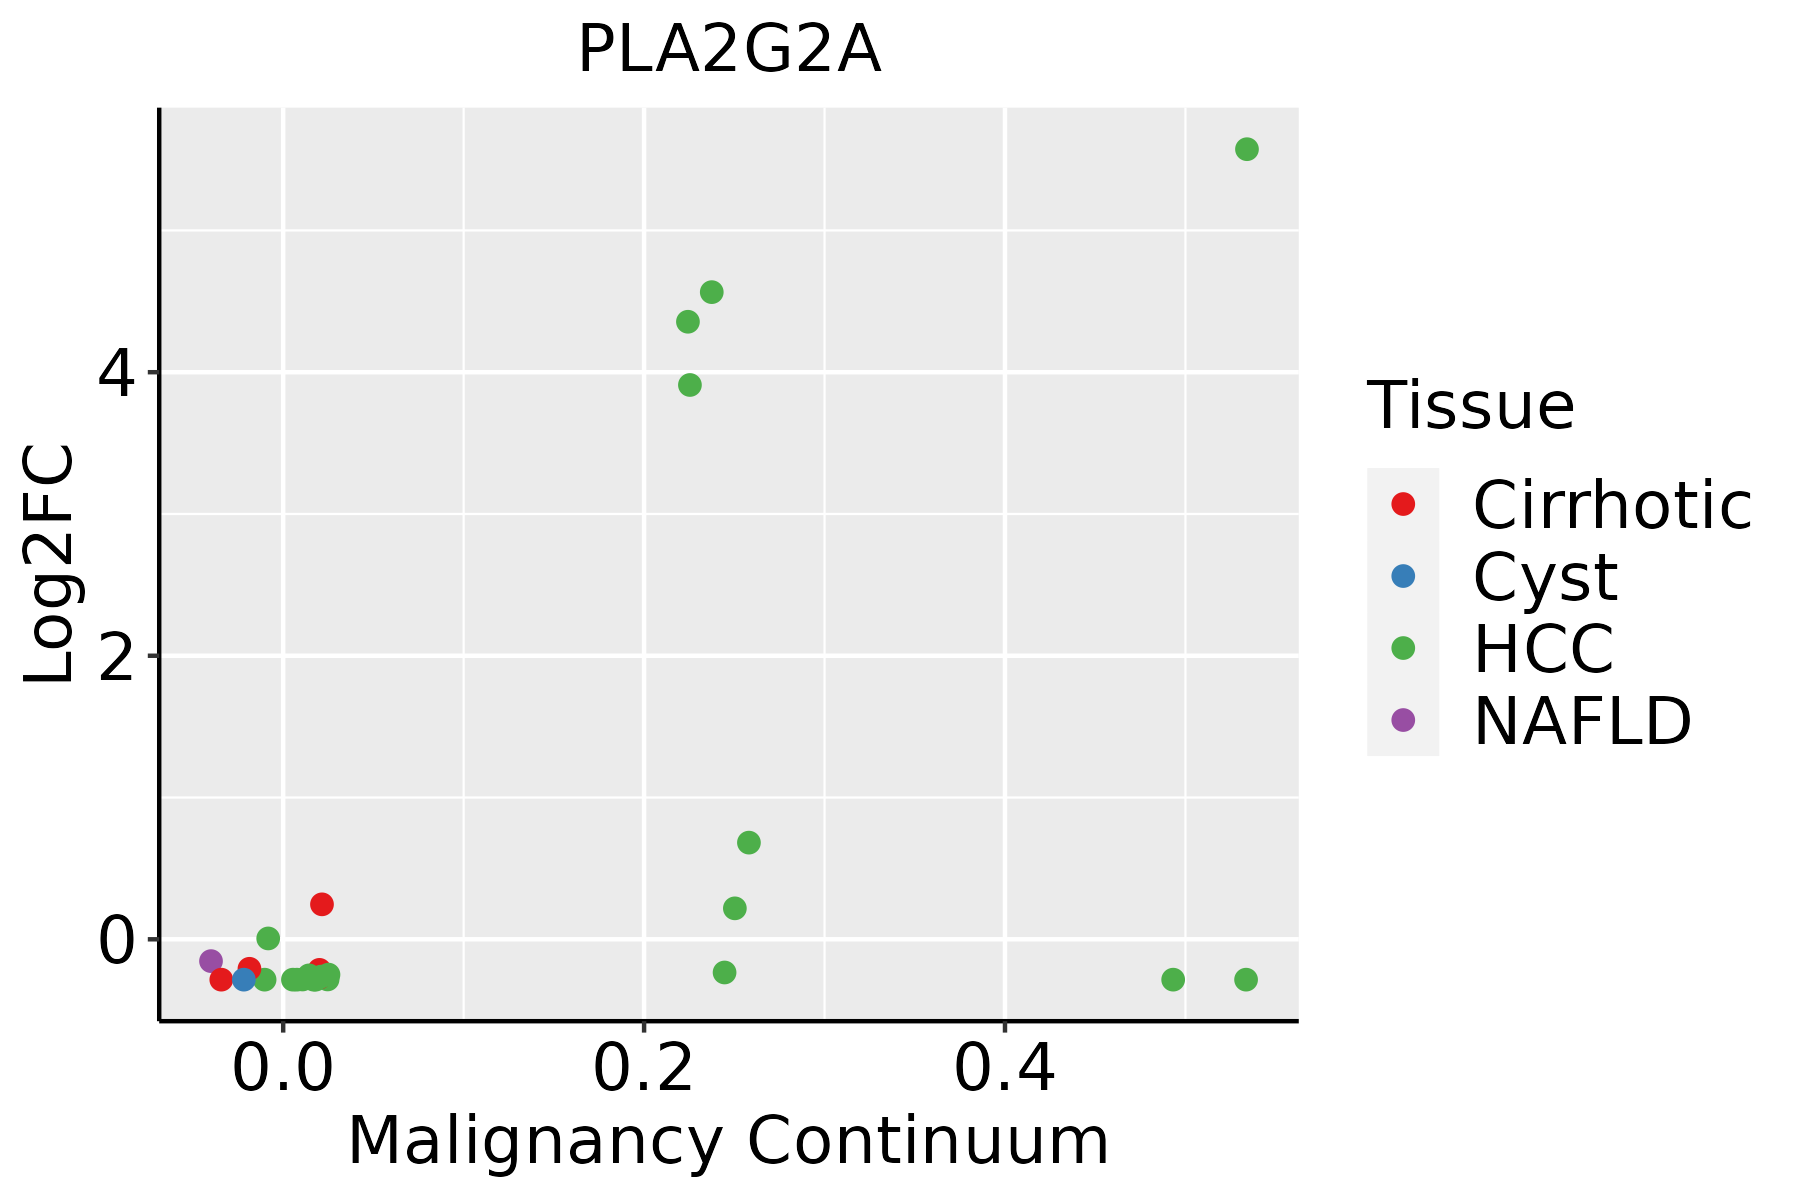 | HCC: Hepatocellular carcinoma |
| NAFLD: Non-alcoholic fatty liver disease | ||
| Oral Cavity | 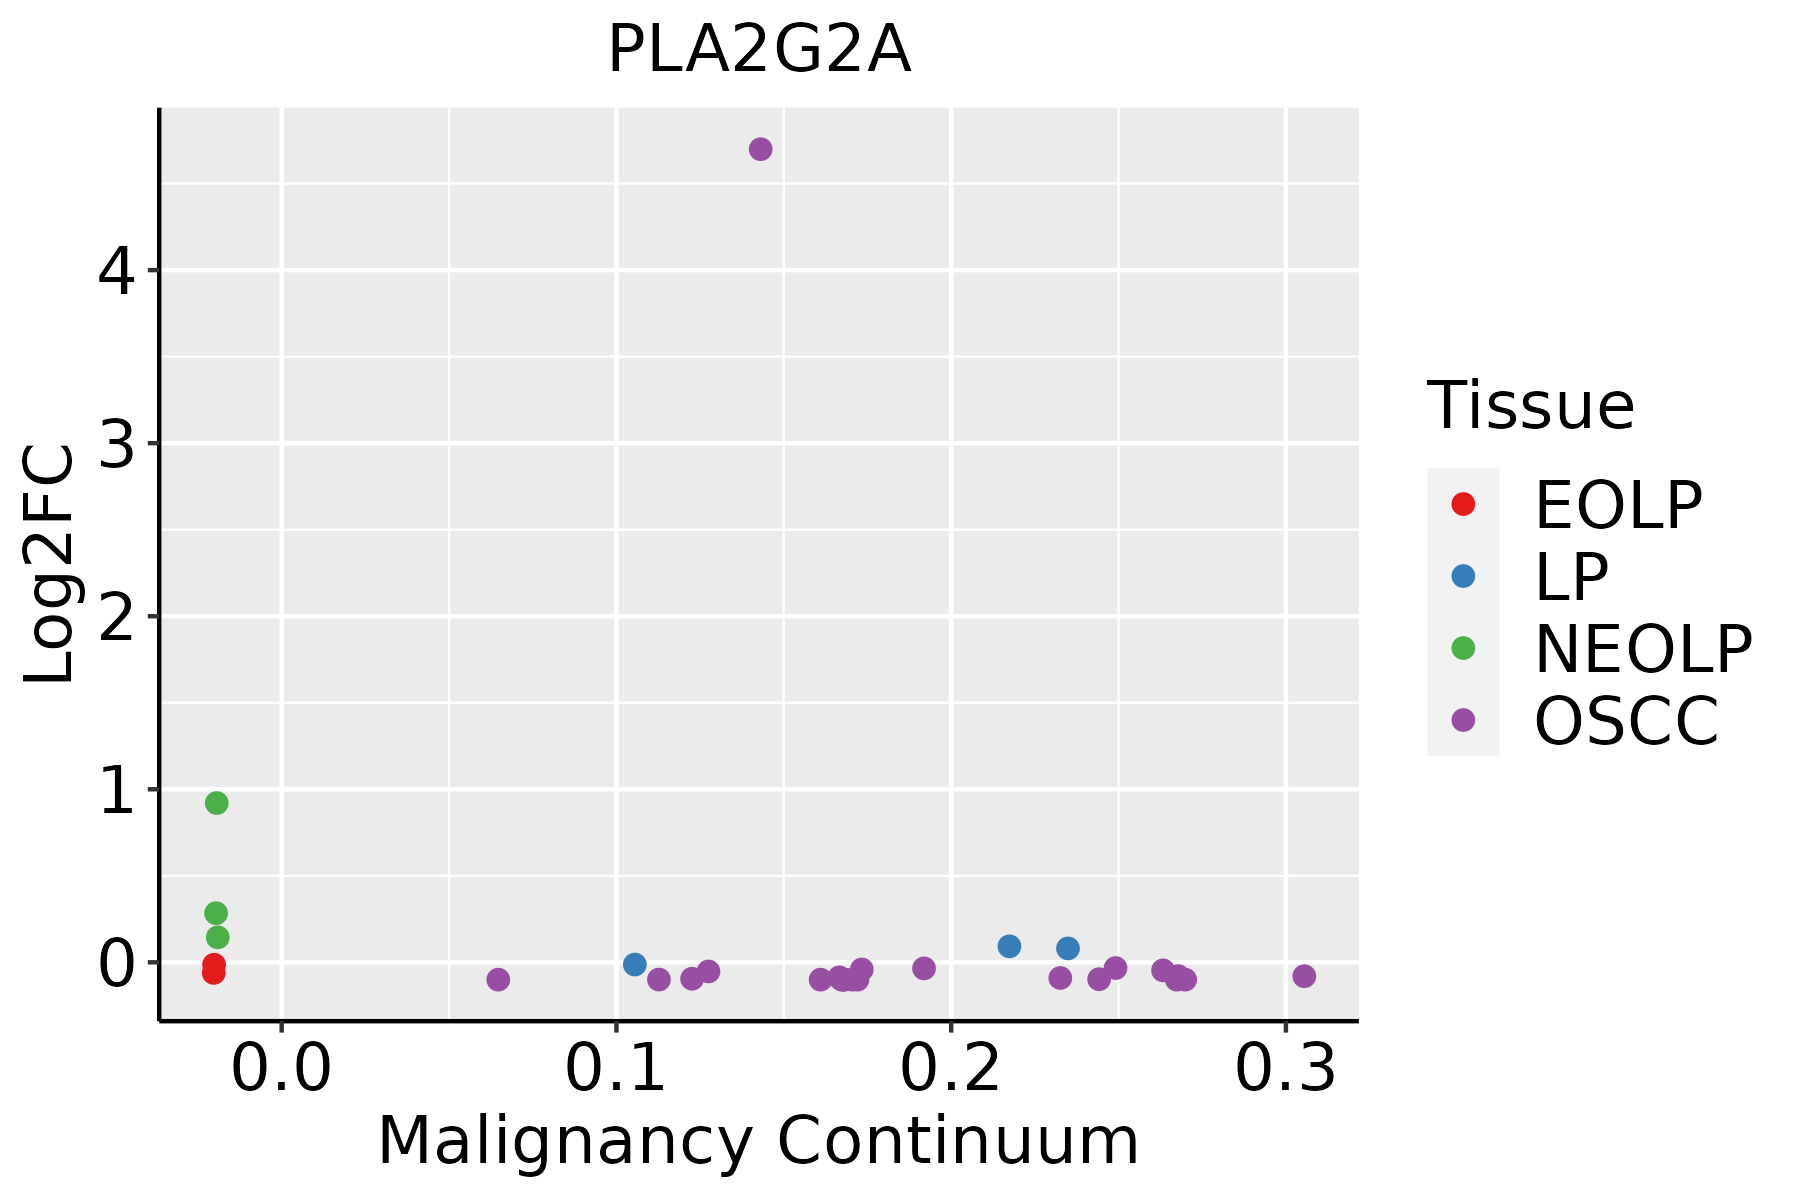 | EOLP: Erosive Oral lichen planus |
| LP: leukoplakia | ||
| NEOLP: Non-erosive oral lichen planus | ||
| OSCC: Oral squamous cell carcinoma |
| ∗log2FC in expression of this searched gene in stem-like cells from each diseased tissue sample relative to stem-like cells in normal samples in each tissue plotted against the malignancy continuum. Samples are colored based on if they are from different disease stage. |
Top |
Malignant transformation related pathway analysis |
| Find out the enriched GO biological processes and KEGG pathways involved in transition from healthy to precancer to cancer |
| Tissue | Disease Stage | Enriched GO biological Processes |
| Colorectum | AD |  |
| Colorectum | SER |  |
| Colorectum | MSS |  |
| Colorectum | MSI-H |  |
| Colorectum | FAP |  |
| ∗Top 15 enriched GO BP terms are showed in the bar plot of each disease state in each tissue. Each row represents a significant GO biological process which is colored according to the -log10(p.adjust). |
| Page: 1 2 3 4 5 6 7 8 9 |
| GO ID | Tissue | Disease Stage | Description | Gene Ratio | Bg Ratio | pvalue | p.adjust | Count |
| GO:0048872 | Colorectum | AD | homeostasis of number of cells | 87/3918 | 272/18723 | 1.16e-05 | 2.61e-04 | 87 |
| GO:0016042 | Colorectum | AD | lipid catabolic process | 97/3918 | 320/18723 | 4.31e-05 | 7.56e-04 | 97 |
| GO:0010876 | Colorectum | AD | lipid localization | 120/3918 | 448/18723 | 1.59e-03 | 1.33e-02 | 120 |
| GO:0006869 | Colorectum | AD | lipid transport | 108/3918 | 398/18723 | 1.67e-03 | 1.39e-02 | 108 |
| GO:0006650 | Colorectum | AD | glycerophospholipid metabolic process | 83/3918 | 306/18723 | 5.40e-03 | 3.55e-02 | 83 |
| GO:0006644 | Colorectum | AD | phospholipid metabolic process | 101/3918 | 383/18723 | 5.80e-03 | 3.67e-02 | 101 |
| GO:00160421 | Colorectum | SER | lipid catabolic process | 77/2897 | 320/18723 | 3.52e-05 | 9.18e-04 | 77 |
| GO:00488721 | Colorectum | SER | homeostasis of number of cells | 65/2897 | 272/18723 | 1.70e-04 | 3.19e-03 | 65 |
| GO:0046486 | Colorectum | SER | glycerolipid metabolic process | 82/2897 | 392/18723 | 2.26e-03 | 2.17e-02 | 82 |
| GO:00066441 | Colorectum | SER | phospholipid metabolic process | 79/2897 | 383/18723 | 3.94e-03 | 3.24e-02 | 79 |
| GO:00066501 | Colorectum | SER | glycerophospholipid metabolic process | 64/2897 | 306/18723 | 6.41e-03 | 4.60e-02 | 64 |
| GO:00488722 | Colorectum | MSS | homeostasis of number of cells | 82/3467 | 272/18723 | 2.02e-06 | 6.28e-05 | 82 |
| GO:00108761 | Colorectum | MSS | lipid localization | 104/3467 | 448/18723 | 6.76e-03 | 4.38e-02 | 104 |
| GO:00160422 | Colorectum | MSS | lipid catabolic process | 77/3467 | 320/18723 | 7.43e-03 | 4.71e-02 | 77 |
| GO:00488723 | Colorectum | MSI-H | homeostasis of number of cells | 34/1319 | 272/18723 | 8.10e-04 | 1.49e-02 | 34 |
| GO:00488724 | Colorectum | FAP | homeostasis of number of cells | 60/2622 | 272/18723 | 1.91e-04 | 2.79e-03 | 60 |
| GO:00068691 | Colorectum | FAP | lipid transport | 81/2622 | 398/18723 | 2.84e-04 | 3.76e-03 | 81 |
| GO:00160423 | Colorectum | FAP | lipid catabolic process | 65/2622 | 320/18723 | 1.13e-03 | 1.08e-02 | 65 |
| GO:00066502 | Colorectum | FAP | glycerophospholipid metabolic process | 62/2622 | 306/18723 | 1.54e-03 | 1.38e-02 | 62 |
| GO:00108762 | Colorectum | FAP | lipid localization | 85/2622 | 448/18723 | 1.92e-03 | 1.63e-02 | 85 |
| Page: 1 2 3 4 |
| Pathway ID | Tissue | Disease Stage | Description | Gene Ratio | Bg Ratio | pvalue | p.adjust | qvalue | Count |
| hsa04972 | Colorectum | AD | Pancreatic secretion | 36/2092 | 102/8465 | 1.06e-02 | 3.98e-02 | 2.54e-02 | 36 |
| hsa049721 | Colorectum | AD | Pancreatic secretion | 36/2092 | 102/8465 | 1.06e-02 | 3.98e-02 | 2.54e-02 | 36 |
| hsa049722 | Colorectum | SER | Pancreatic secretion | 30/1580 | 102/8465 | 5.41e-03 | 3.28e-02 | 2.38e-02 | 30 |
| hsa049723 | Colorectum | SER | Pancreatic secretion | 30/1580 | 102/8465 | 5.41e-03 | 3.28e-02 | 2.38e-02 | 30 |
| hsa049724 | Colorectum | MSS | Pancreatic secretion | 33/1875 | 102/8465 | 1.09e-02 | 3.75e-02 | 2.30e-02 | 33 |
| hsa049725 | Colorectum | MSS | Pancreatic secretion | 33/1875 | 102/8465 | 1.09e-02 | 3.75e-02 | 2.30e-02 | 33 |
| hsa049726 | Colorectum | FAP | Pancreatic secretion | 34/1404 | 102/8465 | 2.43e-05 | 2.78e-04 | 1.69e-04 | 34 |
| hsa04270 | Colorectum | FAP | Vascular smooth muscle contraction | 33/1404 | 134/8465 | 1.05e-02 | 3.74e-02 | 2.28e-02 | 33 |
| hsa049727 | Colorectum | FAP | Pancreatic secretion | 34/1404 | 102/8465 | 2.43e-05 | 2.78e-04 | 1.69e-04 | 34 |
| hsa042701 | Colorectum | FAP | Vascular smooth muscle contraction | 33/1404 | 134/8465 | 1.05e-02 | 3.74e-02 | 2.28e-02 | 33 |
| hsa049728 | Colorectum | CRC | Pancreatic secretion | 32/1091 | 102/8465 | 7.86e-07 | 4.37e-05 | 2.96e-05 | 32 |
| hsa04014 | Colorectum | CRC | Ras signaling pathway | 49/1091 | 236/8465 | 4.04e-04 | 4.50e-03 | 3.05e-03 | 49 |
| hsa042702 | Colorectum | CRC | Vascular smooth muscle contraction | 27/1091 | 134/8465 | 1.13e-02 | 4.90e-02 | 3.32e-02 | 27 |
| hsa049729 | Colorectum | CRC | Pancreatic secretion | 32/1091 | 102/8465 | 7.86e-07 | 4.37e-05 | 2.96e-05 | 32 |
| hsa040141 | Colorectum | CRC | Ras signaling pathway | 49/1091 | 236/8465 | 4.04e-04 | 4.50e-03 | 3.05e-03 | 49 |
| hsa042703 | Colorectum | CRC | Vascular smooth muscle contraction | 27/1091 | 134/8465 | 1.13e-02 | 4.90e-02 | 3.32e-02 | 27 |
| hsa042704 | Oral cavity | NEOLP | Vascular smooth muscle contraction | 30/1112 | 134/8465 | 2.06e-03 | 8.97e-03 | 5.64e-03 | 30 |
| hsa0427011 | Oral cavity | NEOLP | Vascular smooth muscle contraction | 30/1112 | 134/8465 | 2.06e-03 | 8.97e-03 | 5.64e-03 | 30 |
| Page: 1 |
Top |
Cell-cell communication analysis |
| Identification of potential cell-cell interactions between two cell types and their ligand-receptor pairs for different disease states |
| Ligand | Receptor | LRpair | Pathway | Tissue | Disease Stage |
| Page: 1 |
Top |
Single-cell gene regulatory network inference analysis |
| Find out the significant the regulons (TFs) and the target genes of each regulon across cell types for different disease states |
| TF | Cell Type | Tissue | Disease Stage | Target Gene | RSS | Regulon Activity |
| ∗The dot plots of a searched regulon are shown for all cell subpopulations in each disease state of each tissue based on the regulon specific score inferred using pySCENIC and by calculating the average expression. |
| Page: 1 |
Top |
Somatic mutation of malignant transformation related genes |
| Annotation of somatic variants for genes involved in malignant transformation |
| Hugo Symbol | Variant Class | Variant Classification | dbSNP RS | HGVSc | HGVSp | HGVSp Short | SWISSPROT | BIOTYPE | SIFT | PolyPhen | Tumor Sample Barcode | Tissue | Histology | Sex | Age | Stage | Therapy Types | Drugs | Outcome |
| PLA2G2A | SNV | Missense_Mutation | c.418N>G | p.Ser140Gly | p.S140G | P14555 | protein_coding | tolerated(0.11) | benign(0.082) | TCGA-NH-A5IV-01 | Colorectum | colon adenocarcinoma | Female | >=65 | I/II | Unknown | Unknown | SD | |
| PLA2G2A | SNV | Missense_Mutation | novel | c.427C>T | p.Arg143Cys | p.R143C | P14555 | protein_coding | deleterious(0.02) | possibly_damaging(0.588) | TCGA-AJ-A23O-01 | Endometrium | uterine corpus endometrioid carcinoma | Female | >=65 | I/II | Unknown | Unknown | SD |
| PLA2G2A | SNV | Missense_Mutation | c.413G>A | p.Arg138Lys | p.R138K | P14555 | protein_coding | tolerated(0.97) | benign(0) | TCGA-AP-A056-01 | Endometrium | uterine corpus endometrioid carcinoma | Female | <65 | I/II | Unknown | Unknown | SD | |
| PLA2G2A | SNV | Missense_Mutation | novel | c.50N>G | p.Gln17Arg | p.Q17R | P14555 | protein_coding | deleterious(0.02) | possibly_damaging(0.536) | TCGA-AP-A1DK-01 | Endometrium | uterine corpus endometrioid carcinoma | Female | <65 | I/II | Unknown | Unknown | SD |
| PLA2G2A | SNV | Missense_Mutation | rs142941380 | c.148G>A | p.Val50Met | p.V50M | P14555 | protein_coding | tolerated(0.11) | benign(0.066) | TCGA-E6-A2P9-01 | Endometrium | uterine corpus endometrioid carcinoma | Female | >=65 | I/II | Unknown | Unknown | SD |
| PLA2G2A | SNV | Missense_Mutation | novel | c.115N>T | p.Leu39Phe | p.L39F | P14555 | protein_coding | tolerated(0.69) | benign(0.006) | TCGA-FI-A2F4-01 | Endometrium | uterine corpus endometrioid carcinoma | Female | <65 | I/II | Unknown | Unknown | SD |
| PLA2G2A | SNV | Missense_Mutation | c.290G>T | p.Cys97Phe | p.C97F | P14555 | protein_coding | deleterious(0) | probably_damaging(0.999) | TCGA-05-4410-01 | Lung | lung adenocarcinoma | Male | <65 | I/II | Unknown | Unknown | SD | |
| PLA2G2A | SNV | Missense_Mutation | novel | c.373T>A | p.Tyr125Asn | p.Y125N | P14555 | protein_coding | deleterious(0) | probably_damaging(1) | TCGA-38-4631-01 | Lung | lung adenocarcinoma | Female | >=65 | I/II | Unknown | Unknown | PD |
| PLA2G2A | SNV | Missense_Mutation | c.190N>C | p.Cys64Arg | p.C64R | P14555 | protein_coding | deleterious(0) | probably_damaging(1) | TCGA-44-8117-01 | Lung | lung adenocarcinoma | Female | <65 | I/II | Chemotherapy | cisplatin | CR | |
| PLA2G2A | SNV | Missense_Mutation | c.187N>A | p.Cys63Ser | p.C63S | P14555 | protein_coding | deleterious(0) | probably_damaging(1) | TCGA-55-1592-01 | Lung | lung adenocarcinoma | Male | >=65 | I/II | Unknown | Unknown | PD |
| Page: 1 2 |
Top |
Related drugs of malignant transformation related genes |
| Identification of chemicals and drugs interact with genes involved in malignant transfromation |
| (DGIdb 4.0) |
| Entrez ID | Symbol | Category | Interaction Types | Drug Claim Name | Drug Name | PMIDs |
| 5320 | PLA2G2A | PHOSPHOLIPASE, DRUGGABLE GENOME, ENZYME | DIFLUOROMETHYLORNITHINE | 10716720 | ||
| 5320 | PLA2G2A | PHOSPHOLIPASE, DRUGGABLE GENOME, ENZYME | PIROXICAM | PIROXICAM | 10716720 | |
| 5320 | PLA2G2A | PHOSPHOLIPASE, DRUGGABLE GENOME, ENZYME | inhibitor | 178103314 | ||
| 5320 | PLA2G2A | PHOSPHOLIPASE, DRUGGABLE GENOME, ENZYME | DIPHOSPHONATE | 3923787 | ||
| 5320 | PLA2G2A | PHOSPHOLIPASE, DRUGGABLE GENOME, ENZYME | KH064 | |||
| 5320 | PLA2G2A | PHOSPHOLIPASE, DRUGGABLE GENOME, ENZYME | inhibitor | CHEMBL2105659 | VARESPLADIB METHYL | |
| 5320 | PLA2G2A | PHOSPHOLIPASE, DRUGGABLE GENOME, ENZYME | THC | DRONABINOL | 7945419 | |
| 5320 | PLA2G2A | PHOSPHOLIPASE, DRUGGABLE GENOME, ENZYME | VARESPLADIB | VARESPLADIB | ||
| 5320 | PLA2G2A | PHOSPHOLIPASE, DRUGGABLE GENOME, ENZYME | IL-6 | 1846631 | ||
| 5320 | PLA2G2A | PHOSPHOLIPASE, DRUGGABLE GENOME, ENZYME | inhibitor | 348353616 | VARESPLADIB |
| Page: 1 2 |

Copyright 2023-Present -The University of Texas Health Science Center at Houston |