
|
|||||
|
 | |
| |
| |
| |
| |
| |
|
Gene: PLA2G16 |
Gene summary for PLA2G16 |
| Gene information | Species | Human | Gene symbol | PLA2G16 | Gene ID | 11145 |
| Gene name | phospholipase A and acyltransferase 3 | |
| Gene Alias | AdPLA | |
| Cytomap | 11q12.3-q13.1 | |
| Gene Type | protein-coding | GO ID | GO:0001654 | UniProtAcc | A0A024R561 |
Top |
Malignant transformation analysis |
| Identification of the aberrant gene expression in precancerous and cancerous lesions by comparing the gene expression of stem-like cells in diseased tissues with normal stem cells |
| Entrez ID | Symbol | Replicates | Species | Organ | Tissue | Adj P-value | Log2FC | Malignancy |
| 11145 | PLA2G16 | GSM4909281 | Human | Breast | IDC | 7.04e-13 | -3.37e-01 | 0.21 |
| 11145 | PLA2G16 | GSM4909285 | Human | Breast | IDC | 1.91e-06 | -2.39e-01 | 0.21 |
| 11145 | PLA2G16 | GSM4909286 | Human | Breast | IDC | 1.41e-22 | -3.84e-01 | 0.1081 |
| 11145 | PLA2G16 | GSM4909288 | Human | Breast | IDC | 3.22e-03 | -1.47e-01 | 0.0988 |
| 11145 | PLA2G16 | GSM4909291 | Human | Breast | IDC | 1.63e-09 | 5.38e-01 | 0.1753 |
| 11145 | PLA2G16 | GSM4909294 | Human | Breast | IDC | 2.01e-09 | -2.20e-01 | 0.2022 |
| 11145 | PLA2G16 | GSM4909296 | Human | Breast | IDC | 1.35e-05 | 8.19e-02 | 0.1524 |
| 11145 | PLA2G16 | GSM4909297 | Human | Breast | IDC | 2.65e-07 | 1.32e-01 | 0.1517 |
| 11145 | PLA2G16 | GSM4909299 | Human | Breast | IDC | 5.22e-11 | 4.90e-01 | 0.035 |
| 11145 | PLA2G16 | GSM4909304 | Human | Breast | IDC | 1.94e-52 | 1.01e+00 | 0.1636 |
| 11145 | PLA2G16 | GSM4909305 | Human | Breast | IDC | 3.55e-13 | 5.90e-01 | 0.0436 |
| 11145 | PLA2G16 | GSM4909306 | Human | Breast | IDC | 1.51e-26 | 7.28e-01 | 0.1564 |
| 11145 | PLA2G16 | GSM4909307 | Human | Breast | IDC | 2.57e-30 | 7.50e-01 | 0.1569 |
| 11145 | PLA2G16 | GSM4909308 | Human | Breast | IDC | 7.37e-38 | 7.70e-01 | 0.158 |
| 11145 | PLA2G16 | GSM4909309 | Human | Breast | IDC | 7.48e-15 | 5.42e-01 | 0.0483 |
| 11145 | PLA2G16 | GSM4909311 | Human | Breast | IDC | 4.81e-29 | 3.26e-01 | 0.1534 |
| 11145 | PLA2G16 | GSM4909312 | Human | Breast | IDC | 8.16e-27 | 6.60e-01 | 0.1552 |
| 11145 | PLA2G16 | GSM4909313 | Human | Breast | IDC | 3.18e-04 | 2.75e-01 | 0.0391 |
| 11145 | PLA2G16 | GSM4909316 | Human | Breast | IDC | 5.51e-03 | 2.40e-01 | 0.21 |
| 11145 | PLA2G16 | GSM4909319 | Human | Breast | IDC | 5.44e-34 | 1.39e-01 | 0.1563 |
| Page: 1 2 3 4 5 |
| Tissue | Expression Dynamics | Abbreviation |
| Breast |  | IDC: Invasive ductal carcinoma |
| DCIS: Ductal carcinoma in situ | ||
| Precancer(BRCA1-mut): Precancerous lesion from BRCA1 mutation carriers | ||
| Esophagus | 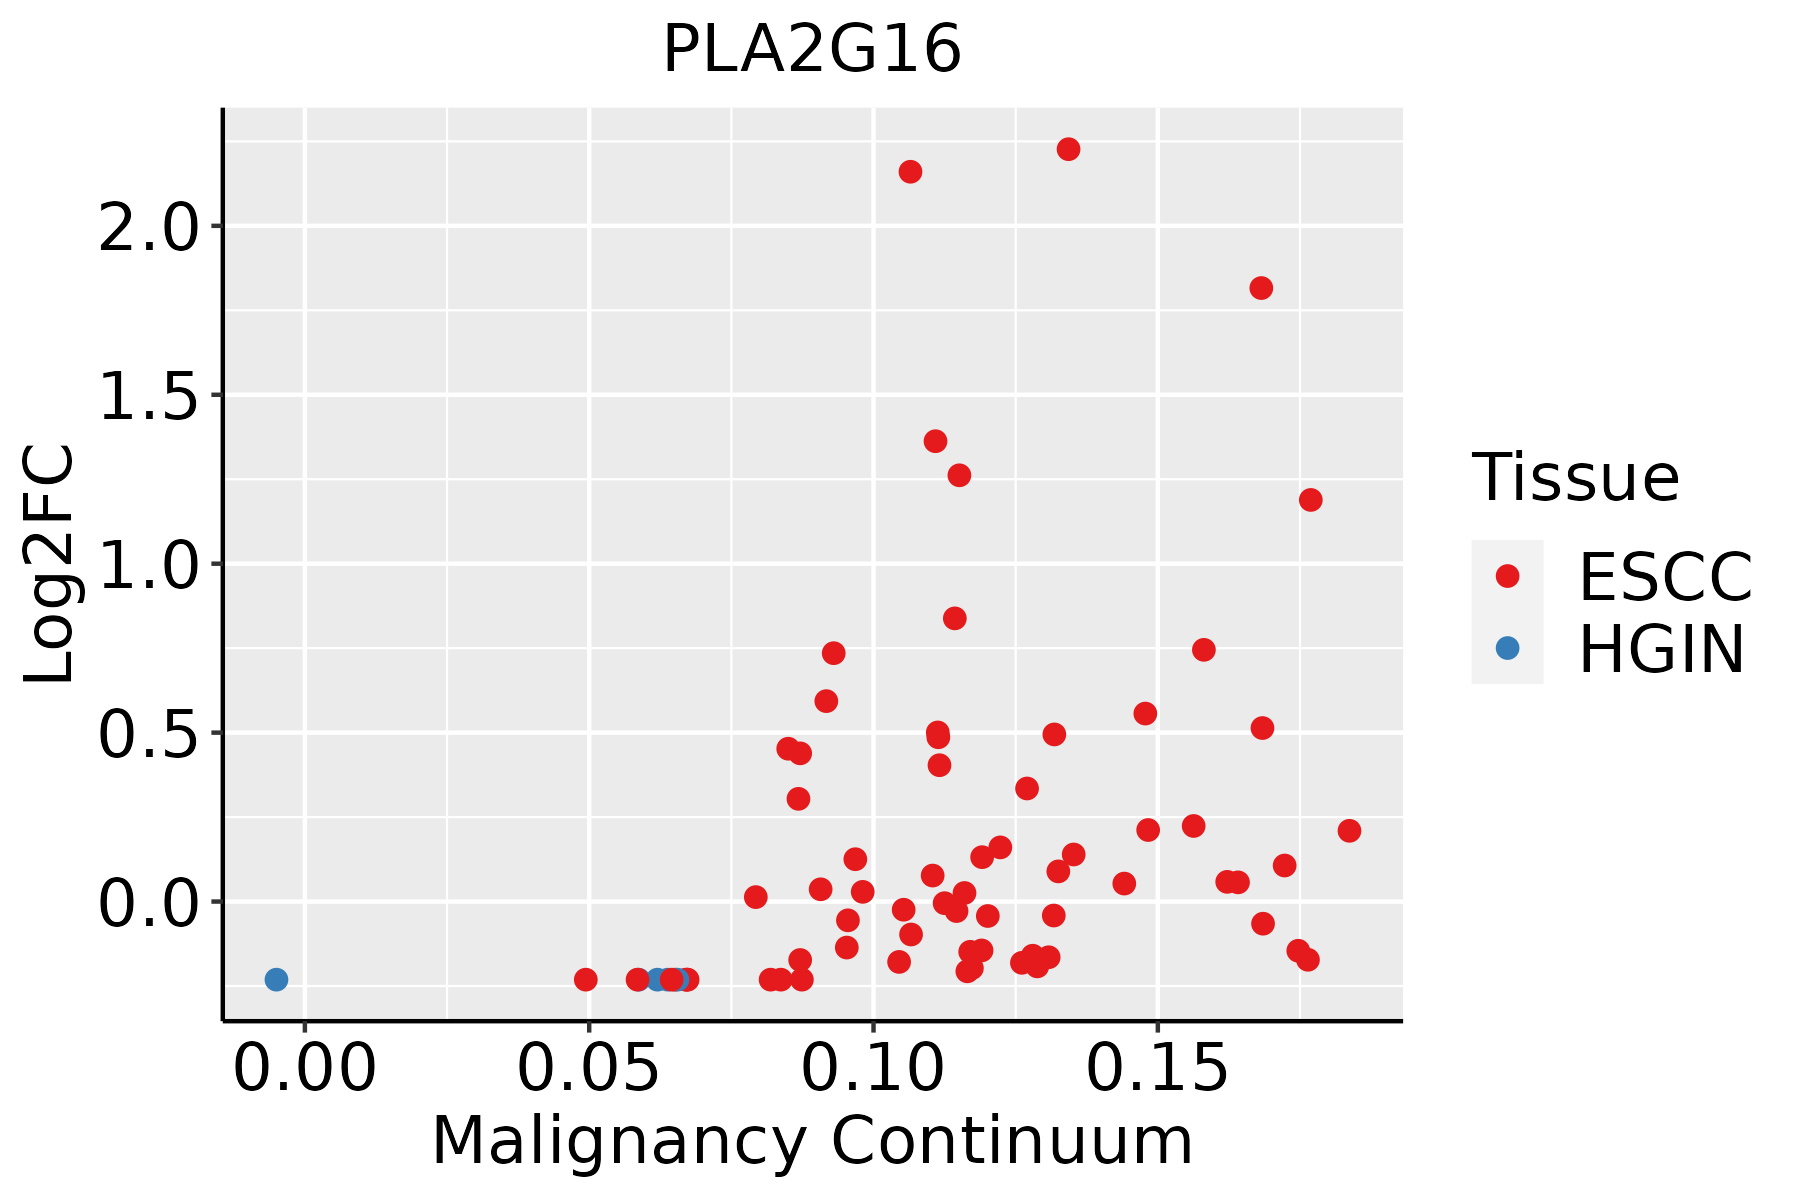 | ESCC: Esophageal squamous cell carcinoma |
| HGIN: High-grade intraepithelial neoplasias | ||
| LGIN: Low-grade intraepithelial neoplasias | ||
| Liver |  | HCC: Hepatocellular carcinoma |
| NAFLD: Non-alcoholic fatty liver disease | ||
| Oral Cavity | 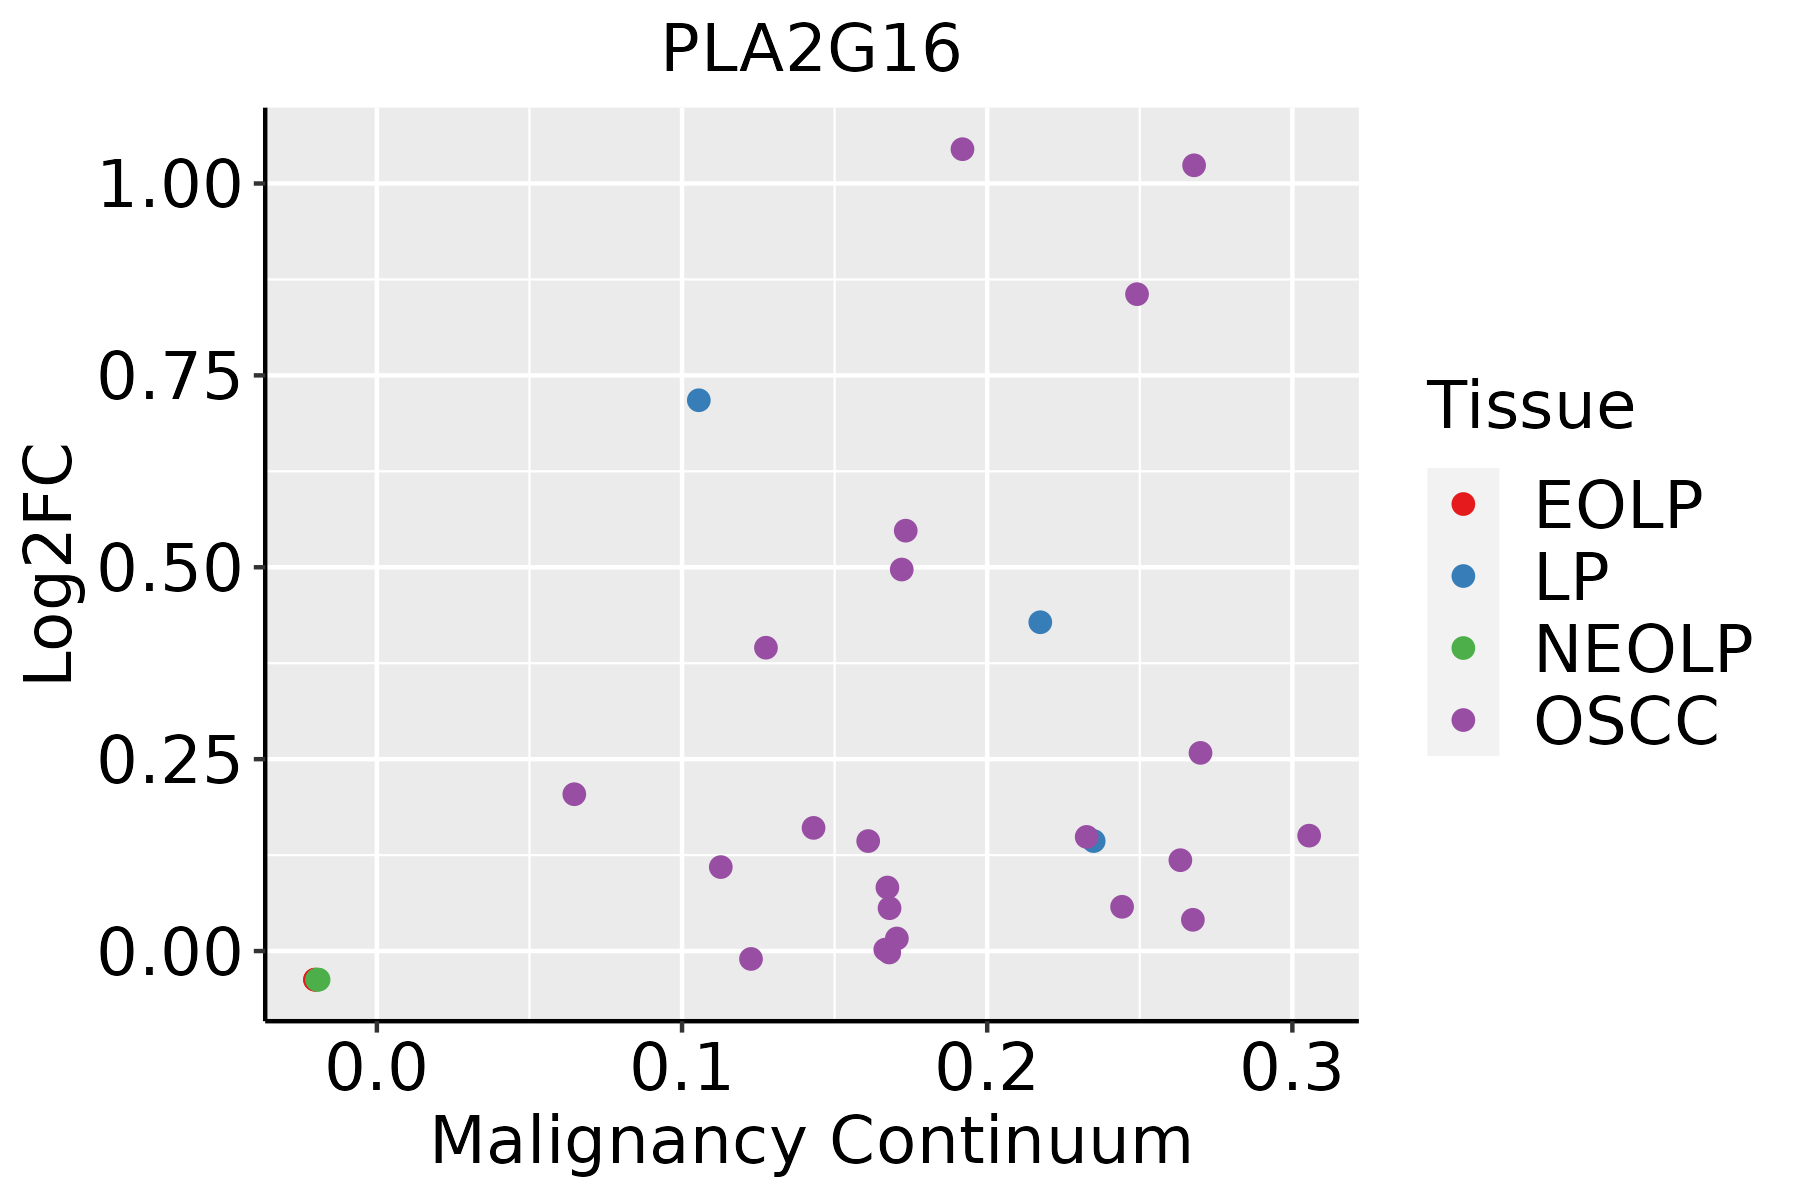 | EOLP: Erosive Oral lichen planus |
| LP: leukoplakia | ||
| NEOLP: Non-erosive oral lichen planus | ||
| OSCC: Oral squamous cell carcinoma | ||
| Thyroid | 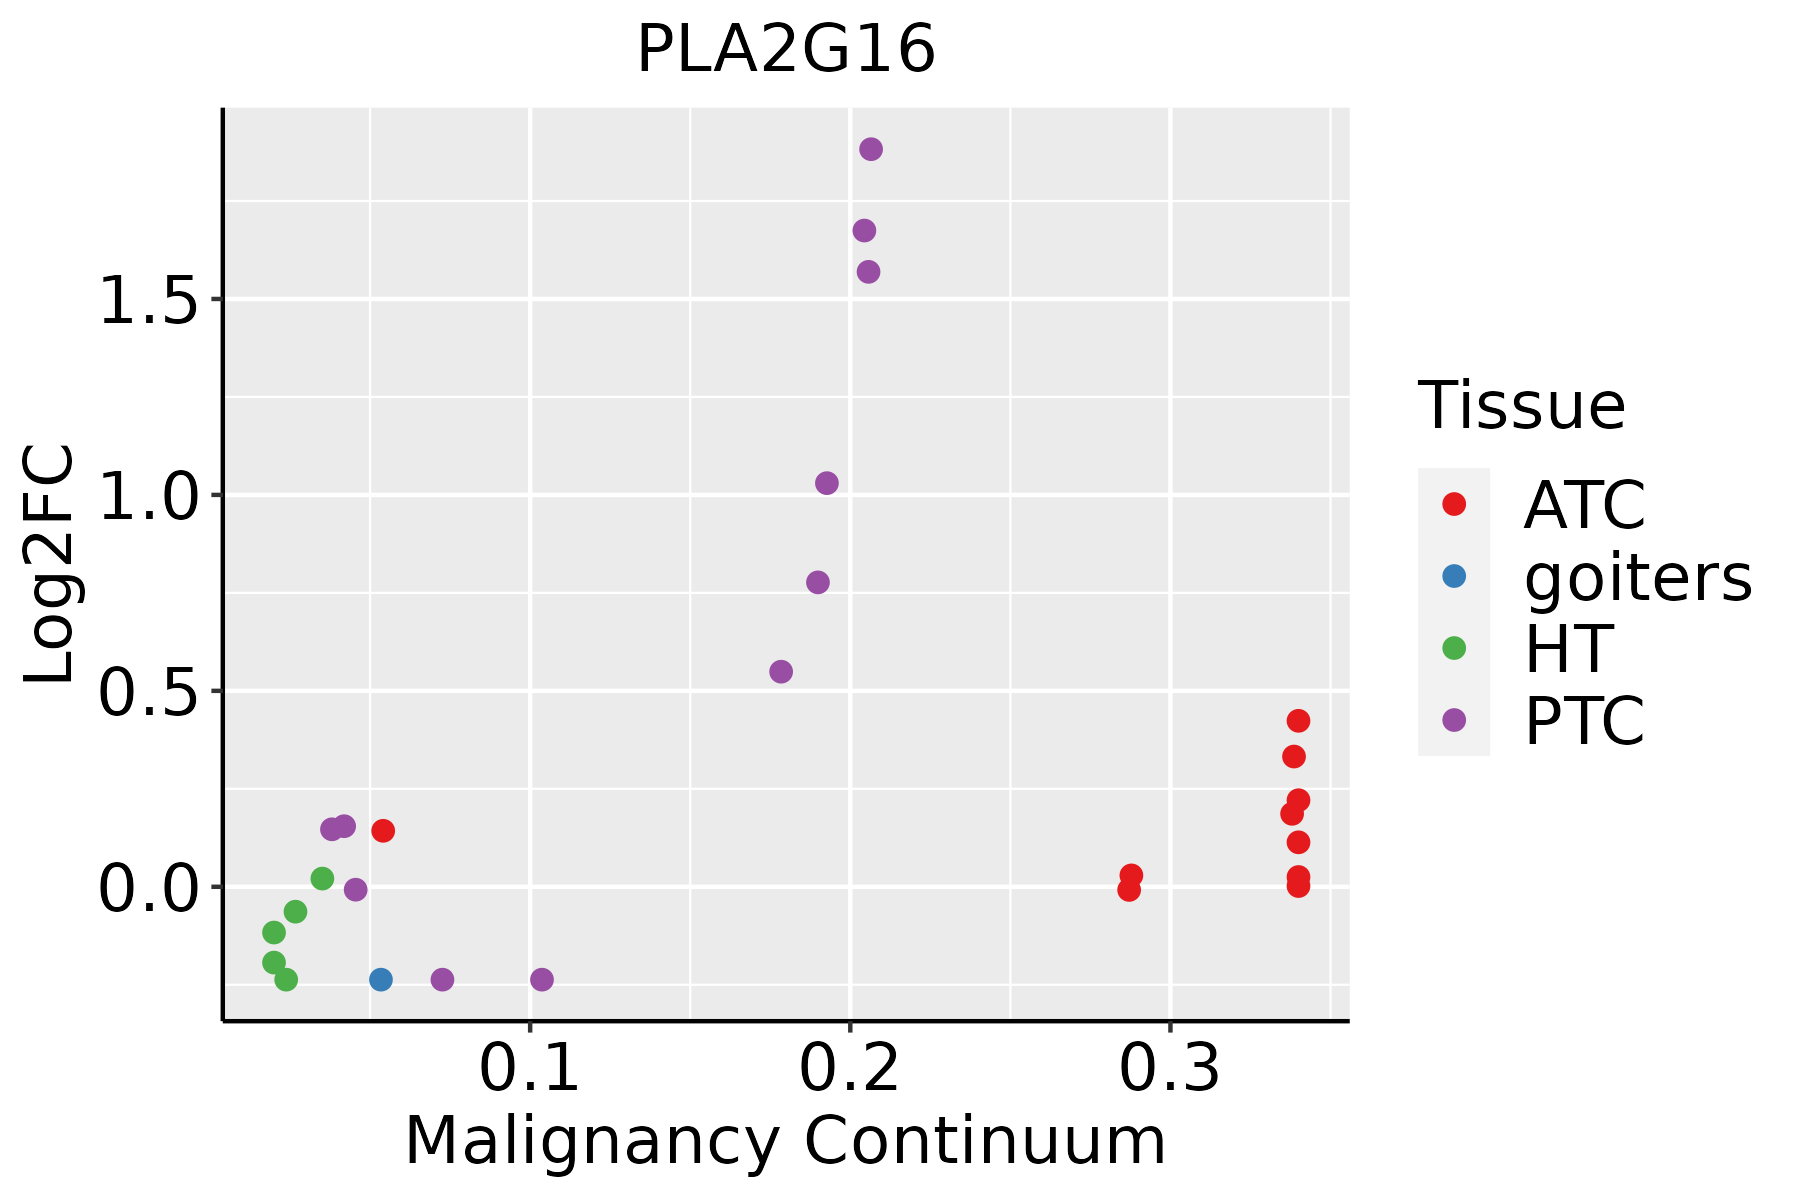 | ATC: Anaplastic thyroid cancer |
| HT: Hashimoto's thyroiditis | ||
| PTC: Papillary thyroid cancer |
| ∗log2FC in expression of this searched gene in stem-like cells from each diseased tissue sample relative to stem-like cells in normal samples in each tissue plotted against the malignancy continuum. Samples are colored based on if they are from different disease stage. |
Top |
Malignant transformation related pathway analysis |
| Find out the enriched GO biological processes and KEGG pathways involved in transition from healthy to precancer to cancer |
| Tissue | Disease Stage | Enriched GO biological Processes |
| Colorectum | AD |  |
| Colorectum | SER |  |
| Colorectum | MSS |  |
| Colorectum | MSI-H |  |
| Colorectum | FAP |  |
| ∗Top 15 enriched GO BP terms are showed in the bar plot of each disease state in each tissue. Each row represents a significant GO biological process which is colored according to the -log10(p.adjust). |
| Page: 1 2 3 4 5 6 7 8 9 |
| GO ID | Tissue | Disease Stage | Description | Gene Ratio | Bg Ratio | pvalue | p.adjust | Count |
| Page: 1 |
| Pathway ID | Tissue | Disease Stage | Description | Gene Ratio | Bg Ratio | pvalue | p.adjust | qvalue | Count |
| Page: 1 |
Top |
Cell-cell communication analysis |
| Identification of potential cell-cell interactions between two cell types and their ligand-receptor pairs for different disease states |
| Ligand | Receptor | LRpair | Pathway | Tissue | Disease Stage |
| Page: 1 |
Top |
Single-cell gene regulatory network inference analysis |
| Find out the significant the regulons (TFs) and the target genes of each regulon across cell types for different disease states |
| TF | Cell Type | Tissue | Disease Stage | Target Gene | RSS | Regulon Activity |
| ∗The dot plots of a searched regulon are shown for all cell subpopulations in each disease state of each tissue based on the regulon specific score inferred using pySCENIC and by calculating the average expression. |
| Page: 1 |
Top |
Somatic mutation of malignant transformation related genes |
| Annotation of somatic variants for genes involved in malignant transformation |
| Hugo Symbol | Variant Class | Variant Classification | dbSNP RS | HGVSc | HGVSp | HGVSp Short | SWISSPROT | BIOTYPE | SIFT | PolyPhen | Tumor Sample Barcode | Tissue | Histology | Sex | Age | Stage | Therapy Types | Drugs | Outcome |
| PLA2G16 | SNV | Missense_Mutation | c.392N>A | p.Arg131Lys | p.R131K | P53816 | protein_coding | tolerated(0.08) | benign(0.114) | TCGA-AN-A0AM-01 | Breast | breast invasive carcinoma | Female | <65 | I/II | Unknown | Unknown | SD | |
| PLA2G16 | SNV | Missense_Mutation | c.377N>A | p.Arg126His | p.R126H | P53816 | protein_coding | tolerated(0.15) | benign(0.21) | TCGA-AA-3815-01 | Colorectum | colon adenocarcinoma | Female | >=65 | I/II | Unknown | Unknown | SD | |
| PLA2G16 | SNV | Missense_Mutation | rs774988323 | c.373N>A | p.Ala125Thr | p.A125T | P53816 | protein_coding | deleterious(0.04) | benign(0.031) | TCGA-AZ-4313-01 | Colorectum | colon adenocarcinoma | Female | <65 | I/II | Unknown | Unknown | SD |
| PLA2G16 | deletion | Frame_Shift_Del | novel | c.311delN | p.Val104GlyfsTer5 | p.V104Gfs*5 | P53816 | protein_coding | TCGA-AG-A00Y-01 | Colorectum | rectum adenocarcinoma | Male | >=65 | I/II | Unknown | Unknown | PD | ||
| PLA2G16 | SNV | Missense_Mutation | rs771330726 | c.284N>A | p.Arg95Gln | p.R95Q | P53816 | protein_coding | tolerated(0.55) | benign(0.05) | TCGA-A5-A0G2-01 | Endometrium | uterine corpus endometrioid carcinoma | Female | <65 | III/IV | Unknown | Unknown | SD |
| PLA2G16 | SNV | Missense_Mutation | rs768835113 | c.476N>A | p.Arg159Gln | p.R159Q | P53816 | protein_coding | tolerated(0.11) | benign(0.041) | TCGA-A5-A1OF-01 | Endometrium | uterine corpus endometrioid carcinoma | Female | <65 | I/II | Unknown | Unknown | SD |
| PLA2G16 | SNV | Missense_Mutation | rs768835113 | c.476N>A | p.Arg159Gln | p.R159Q | P53816 | protein_coding | tolerated(0.11) | benign(0.041) | TCGA-AP-A056-01 | Endometrium | uterine corpus endometrioid carcinoma | Female | <65 | I/II | Unknown | Unknown | SD |
| PLA2G16 | SNV | Missense_Mutation | rs143452291 | c.287N>T | p.Ala96Val | p.A96V | P53816 | protein_coding | deleterious(0.01) | possibly_damaging(0.615) | TCGA-AX-A2HC-01 | Endometrium | uterine corpus endometrioid carcinoma | Female | <65 | III/IV | Chemotherapy | paclitaxel | PD |
| PLA2G16 | SNV | Missense_Mutation | novel | c.219N>T | p.Lys73Asn | p.K73N | P53816 | protein_coding | tolerated(0.29) | benign(0.006) | TCGA-BK-A6W3-01 | Endometrium | uterine corpus endometrioid carcinoma | Female | <65 | I/II | Unknown | Unknown | SD |
| PLA2G16 | SNV | Missense_Mutation | novel | c.481N>C | p.Lys161Gln | p.K161Q | P53816 | protein_coding | tolerated(0.11) | benign(0.007) | TCGA-DF-A2KU-01 | Endometrium | uterine corpus endometrioid carcinoma | Female | Unknown | I/II | Unknown | Unknown | SD |
| Page: 1 2 |
Top |
Related drugs of malignant transformation related genes |
| Identification of chemicals and drugs interact with genes involved in malignant transfromation |
| (DGIdb 4.0) |
| Entrez ID | Symbol | Category | Interaction Types | Drug Claim Name | Drug Name | PMIDs |
| Page: 1 |

Copyright 2023-Present -The University of Texas Health Science Center at Houston |