
|
|||||
|
 | |
| |
| |
| |
| |
| |
|
Gene: PLA2G15 |
Gene summary for PLA2G15 |
| Gene information | Species | Human | Gene symbol | PLA2G15 | Gene ID | 23659 |
| Gene name | phospholipase A2 group XV | |
| Gene Alias | ACS | |
| Cytomap | 16q22.1 | |
| Gene Type | protein-coding | GO ID | GO:0006082 | UniProtAcc | Q8NCC3 |
Top |
Malignant transformation analysis |
| Identification of the aberrant gene expression in precancerous and cancerous lesions by comparing the gene expression of stem-like cells in diseased tissues with normal stem cells |
| Entrez ID | Symbol | Replicates | Species | Organ | Tissue | Adj P-value | Log2FC | Malignancy |
| 23659 | PLA2G15 | C04 | Human | Oral cavity | OSCC | 1.65e-04 | 2.88e-01 | 0.2633 |
| 23659 | PLA2G15 | C21 | Human | Oral cavity | OSCC | 1.15e-26 | 6.54e-01 | 0.2678 |
| 23659 | PLA2G15 | C30 | Human | Oral cavity | OSCC | 4.39e-19 | 6.42e-01 | 0.3055 |
| 23659 | PLA2G15 | C43 | Human | Oral cavity | OSCC | 1.93e-05 | 1.27e-01 | 0.1704 |
| 23659 | PLA2G15 | C46 | Human | Oral cavity | OSCC | 1.03e-04 | 1.60e-01 | 0.1673 |
| 23659 | PLA2G15 | C51 | Human | Oral cavity | OSCC | 3.84e-08 | 3.45e-01 | 0.2674 |
| 23659 | PLA2G15 | C57 | Human | Oral cavity | OSCC | 1.10e-02 | 1.45e-01 | 0.1679 |
| 23659 | PLA2G15 | C06 | Human | Oral cavity | OSCC | 2.18e-03 | 4.39e-01 | 0.2699 |
| 23659 | PLA2G15 | C08 | Human | Oral cavity | OSCC | 3.50e-02 | 8.62e-02 | 0.1919 |
| 23659 | PLA2G15 | SYSMH2 | Human | Oral cavity | OSCC | 1.86e-04 | 1.50e-01 | 0.2326 |
| 23659 | PLA2G15 | SYSMH3 | Human | Oral cavity | OSCC | 8.17e-12 | 2.13e-01 | 0.2442 |
| 23659 | PLA2G15 | SYSMH6 | Human | Oral cavity | OSCC | 3.50e-02 | 8.65e-02 | 0.1275 |
| 23659 | PLA2G15 | PTC01 | Human | Thyroid | PTC | 1.34e-03 | 2.81e-02 | 0.1899 |
| 23659 | PLA2G15 | PTC06 | Human | Thyroid | PTC | 3.24e-06 | 1.67e-01 | 0.2057 |
| 23659 | PLA2G15 | PTC07 | Human | Thyroid | PTC | 4.17e-11 | 9.56e-02 | 0.2044 |
| 23659 | PLA2G15 | ATC09 | Human | Thyroid | ATC | 1.20e-04 | 2.19e-01 | 0.2871 |
| 23659 | PLA2G15 | ATC12 | Human | Thyroid | ATC | 8.64e-11 | 1.54e-01 | 0.34 |
| 23659 | PLA2G15 | ATC13 | Human | Thyroid | ATC | 3.16e-10 | 6.68e-02 | 0.34 |
| 23659 | PLA2G15 | ATC1 | Human | Thyroid | ATC | 1.51e-05 | 2.60e-01 | 0.2878 |
| 23659 | PLA2G15 | ATC2 | Human | Thyroid | ATC | 4.71e-07 | 7.10e-01 | 0.34 |
| Page: 1 2 |
| Tissue | Expression Dynamics | Abbreviation |
| Oral Cavity | 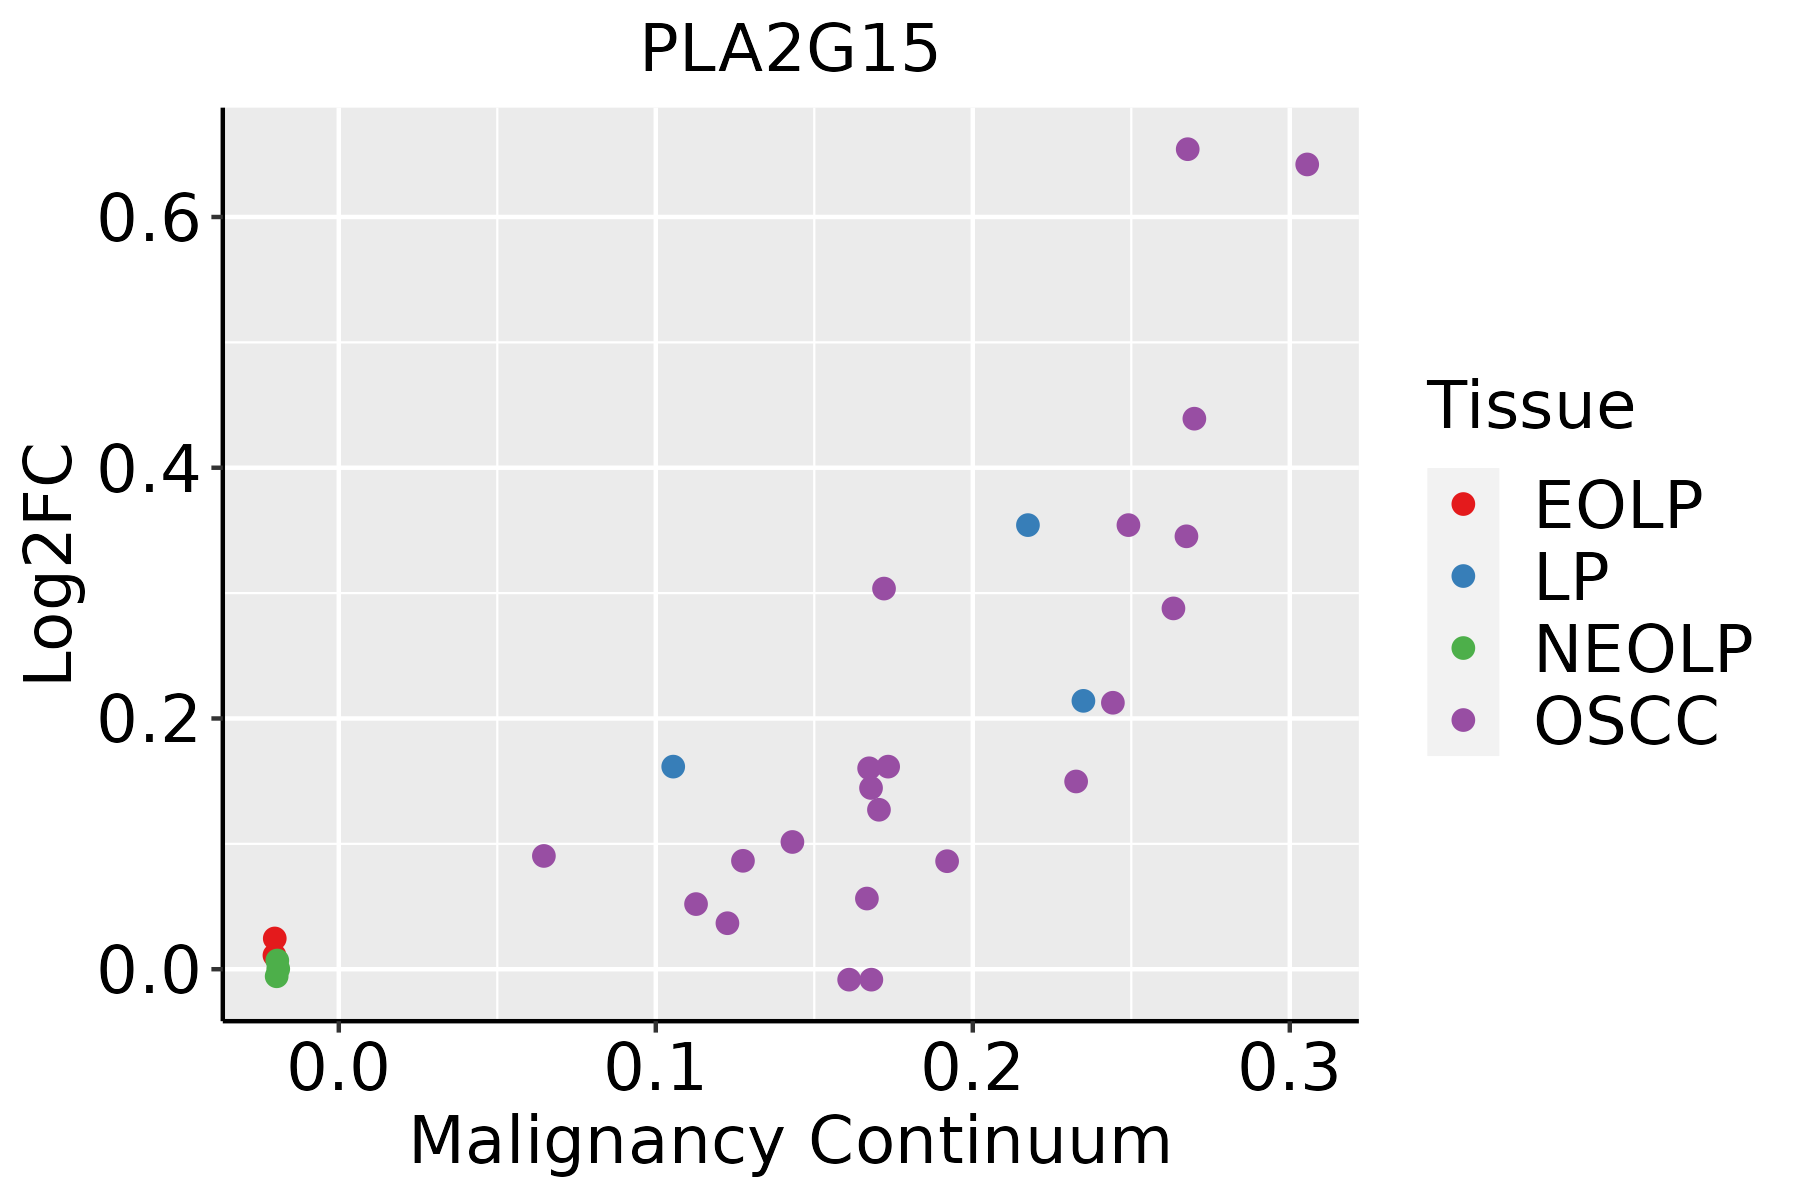 | EOLP: Erosive Oral lichen planus |
| LP: leukoplakia | ||
| NEOLP: Non-erosive oral lichen planus | ||
| OSCC: Oral squamous cell carcinoma | ||
| Thyroid | 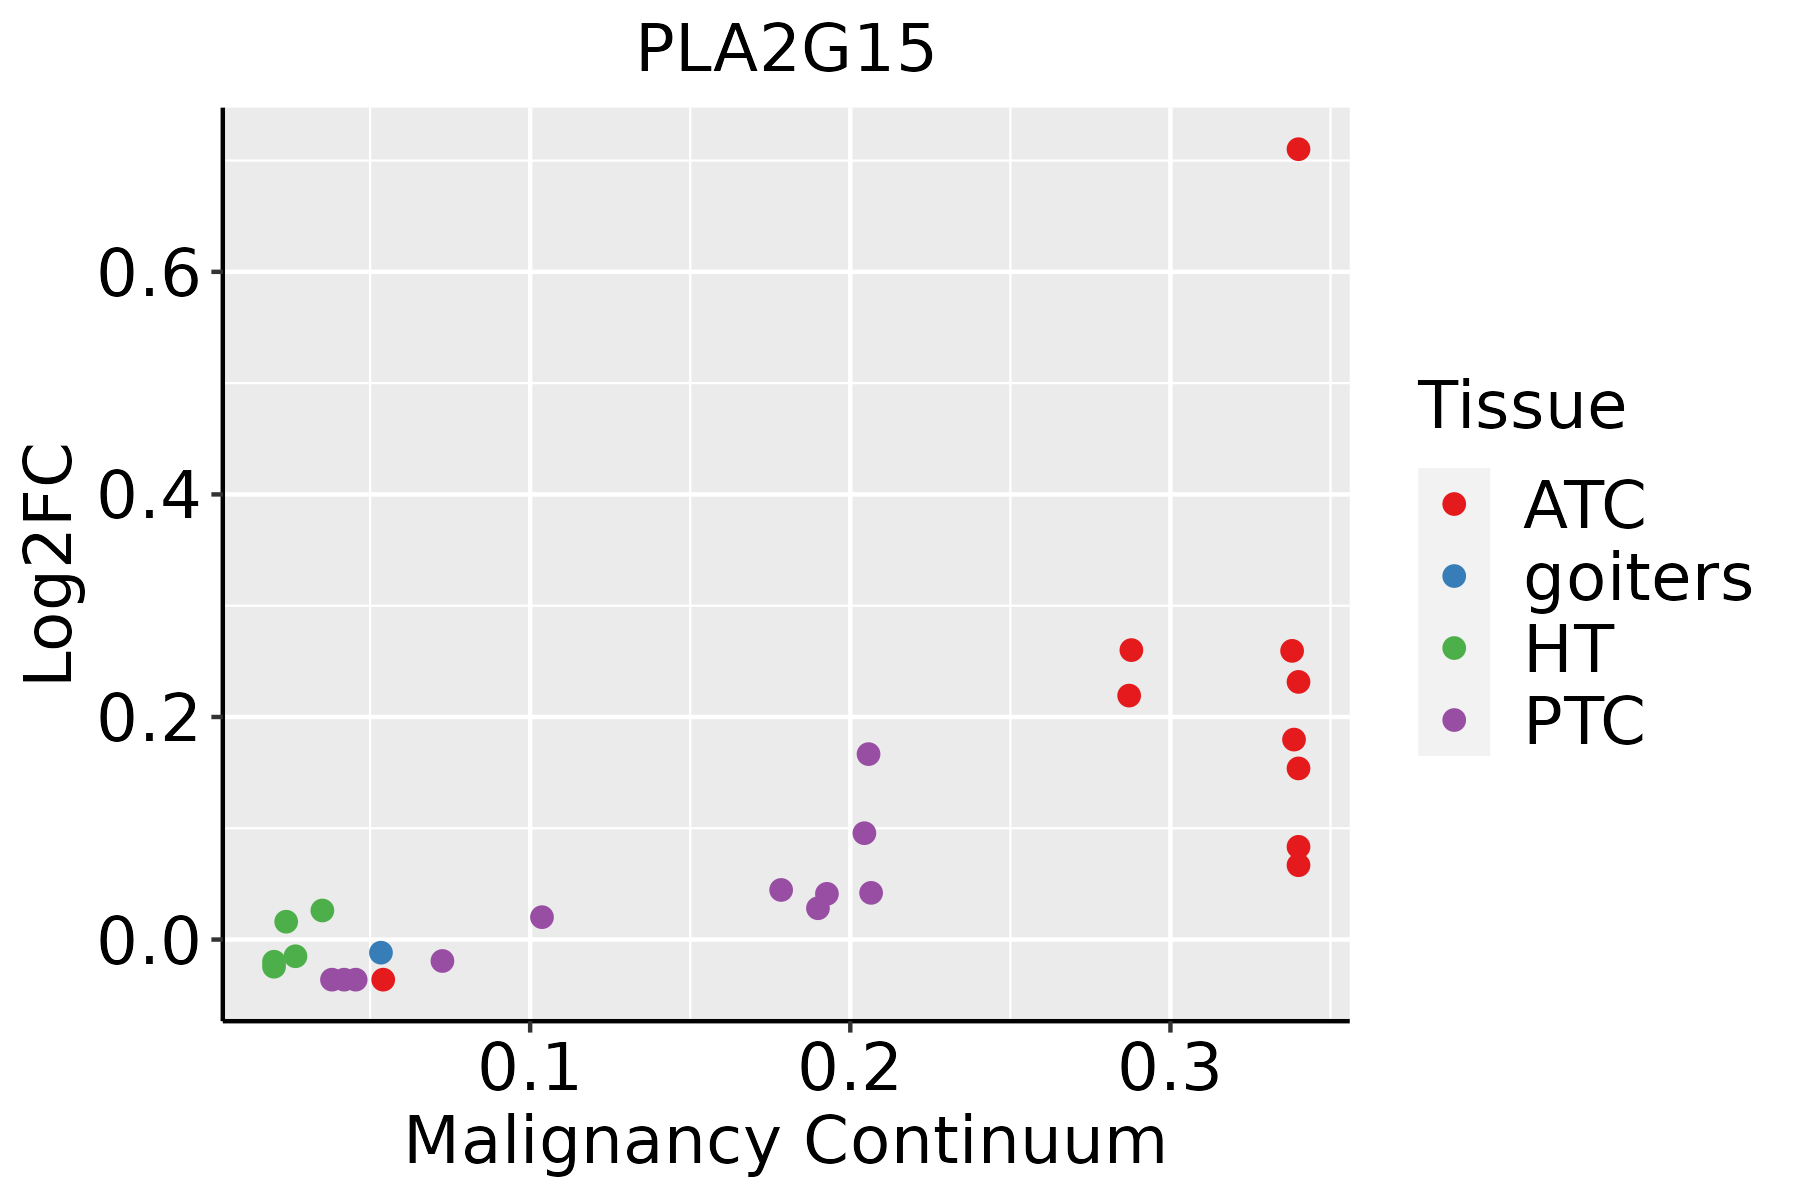 | ATC: Anaplastic thyroid cancer |
| HT: Hashimoto's thyroiditis | ||
| PTC: Papillary thyroid cancer |
| ∗log2FC in expression of this searched gene in stem-like cells from each diseased tissue sample relative to stem-like cells in normal samples in each tissue plotted against the malignancy continuum. Samples are colored based on if they are from different disease stage. |
Top |
Malignant transformation related pathway analysis |
| Find out the enriched GO biological processes and KEGG pathways involved in transition from healthy to precancer to cancer |
| Tissue | Disease Stage | Enriched GO biological Processes |
| Colorectum | AD |  |
| Colorectum | SER |  |
| Colorectum | MSS |  |
| Colorectum | MSI-H |  |
| Colorectum | FAP |  |
| ∗Top 15 enriched GO BP terms are showed in the bar plot of each disease state in each tissue. Each row represents a significant GO biological process which is colored according to the -log10(p.adjust). |
| Page: 1 2 3 4 5 6 7 8 9 |
| GO ID | Tissue | Disease Stage | Description | Gene Ratio | Bg Ratio | pvalue | p.adjust | Count |
| GO:00066432 | Oral cavity | OSCC | membrane lipid metabolic process | 111/7305 | 203/18723 | 4.02e-06 | 4.69e-05 | 111 |
| GO:00090627 | Oral cavity | OSCC | fatty acid catabolic process | 59/7305 | 100/18723 | 3.99e-05 | 3.48e-04 | 59 |
| GO:00066651 | Oral cavity | OSCC | sphingolipid metabolic process | 84/7305 | 155/18723 | 8.64e-05 | 6.61e-04 | 84 |
| GO:00066317 | Oral cavity | OSCC | fatty acid metabolic process | 186/7305 | 390/18723 | 2.65e-04 | 1.69e-03 | 186 |
| GO:00723296 | Oral cavity | OSCC | monocarboxylic acid catabolic process | 66/7305 | 122/18723 | 5.02e-04 | 2.95e-03 | 66 |
| GO:00442826 | Oral cavity | OSCC | small molecule catabolic process | 174/7305 | 376/18723 | 2.25e-03 | 1.00e-02 | 174 |
| GO:00442426 | Oral cavity | OSCC | cellular lipid catabolic process | 104/7305 | 214/18723 | 2.61e-03 | 1.15e-02 | 104 |
| GO:00066445 | Oral cavity | OSCC | phospholipid metabolic process | 175/7305 | 383/18723 | 4.21e-03 | 1.71e-02 | 175 |
| GO:0006672 | Oral cavity | OSCC | ceramide metabolic process | 53/7305 | 102/18723 | 5.28e-03 | 2.06e-02 | 53 |
| GO:00065756 | Oral cavity | OSCC | cellular modified amino acid metabolic process | 91/7305 | 188/18723 | 5.33e-03 | 2.07e-02 | 91 |
| GO:000657513 | Thyroid | PTC | cellular modified amino acid metabolic process | 85/5968 | 188/18723 | 8.29e-05 | 7.01e-04 | 85 |
| GO:000657522 | Thyroid | ATC | cellular modified amino acid metabolic process | 82/6293 | 188/18723 | 2.60e-03 | 1.20e-02 | 82 |
| Page: 1 |
| Pathway ID | Tissue | Disease Stage | Description | Gene Ratio | Bg Ratio | pvalue | p.adjust | qvalue | Count |
| hsa041425 | Oral cavity | OSCC | Lysosome | 87/3704 | 132/8465 | 1.97e-07 | 1.35e-06 | 6.86e-07 | 87 |
| hsa0414212 | Oral cavity | OSCC | Lysosome | 87/3704 | 132/8465 | 1.97e-07 | 1.35e-06 | 6.86e-07 | 87 |
| Page: 1 |
Top |
Cell-cell communication analysis |
| Identification of potential cell-cell interactions between two cell types and their ligand-receptor pairs for different disease states |
| Ligand | Receptor | LRpair | Pathway | Tissue | Disease Stage |
| Page: 1 |
Top |
Single-cell gene regulatory network inference analysis |
| Find out the significant the regulons (TFs) and the target genes of each regulon across cell types for different disease states |
| TF | Cell Type | Tissue | Disease Stage | Target Gene | RSS | Regulon Activity |
| ∗The dot plots of a searched regulon are shown for all cell subpopulations in each disease state of each tissue based on the regulon specific score inferred using pySCENIC and by calculating the average expression. |
| Page: 1 |
Top |
Somatic mutation of malignant transformation related genes |
| Annotation of somatic variants for genes involved in malignant transformation |
| Hugo Symbol | Variant Class | Variant Classification | dbSNP RS | HGVSc | HGVSp | HGVSp Short | SWISSPROT | BIOTYPE | SIFT | PolyPhen | Tumor Sample Barcode | Tissue | Histology | Sex | Age | Stage | Therapy Types | Drugs | Outcome |
| PLA2G15 | SNV | Missense_Mutation | novel | c.373N>C | p.Glu125Gln | p.E125Q | Q8NCC3 | protein_coding | deleterious(0) | probably_damaging(0.999) | TCGA-5L-AAT1-01 | Breast | breast invasive carcinoma | Female | <65 | III/IV | Hormone Therapy | letrozol | SD |
| PLA2G15 | SNV | Missense_Mutation | c.734N>G | p.Asn245Ser | p.N245S | Q8NCC3 | protein_coding | tolerated(0.06) | benign(0.137) | TCGA-AR-A1AU-01 | Breast | breast invasive carcinoma | Female | <65 | III/IV | Chemotherapy | doxorubicin | SD | |
| PLA2G15 | SNV | Missense_Mutation | rs140788278 | c.713N>A | p.Arg238His | p.R238H | Q8NCC3 | protein_coding | deleterious(0.02) | benign(0.147) | TCGA-C8-A8HP-01 | Breast | breast invasive carcinoma | Female | <65 | III/IV | Chemotherapy | 5-fluorouracil | CR |
| PLA2G15 | SNV | Missense_Mutation | rs749431362 | c.740G>A | p.Arg247Gln | p.R247Q | Q8NCC3 | protein_coding | tolerated(0.24) | possibly_damaging(0.821) | TCGA-2W-A8YY-01 | Cervix | cervical & endocervical cancer | Female | <65 | I/II | Chemotherapy | cisplatin | CR |
| PLA2G15 | SNV | Missense_Mutation | novel | c.230T>G | p.Leu77Arg | p.L77R | Q8NCC3 | protein_coding | deleterious(0) | probably_damaging(0.987) | TCGA-VS-A9U6-01 | Cervix | cervical & endocervical cancer | Female | <65 | I/II | Chemotherapy | cisplatin | PD |
| PLA2G15 | SNV | Missense_Mutation | c.217N>C | p.Phe73Leu | p.F73L | Q8NCC3 | protein_coding | deleterious(0) | probably_damaging(0.996) | TCGA-AA-3811-01 | Colorectum | colon adenocarcinoma | Female | >=65 | III/IV | Unknown | Unknown | PD | |
| PLA2G15 | SNV | Missense_Mutation | rs777652754 | c.959C>T | p.Ala320Val | p.A320V | Q8NCC3 | protein_coding | tolerated(0.07) | benign(0.012) | TCGA-AA-3984-01 | Colorectum | colon adenocarcinoma | Female | <65 | I/II | Unknown | Unknown | SD |
| PLA2G15 | SNV | Missense_Mutation | c.1219C>T | p.Arg407Cys | p.R407C | Q8NCC3 | protein_coding | deleterious(0.03) | benign(0) | TCGA-CM-4743-01 | Colorectum | colon adenocarcinoma | Male | >=65 | I/II | Chemotherapy | capecitabine | SD | |
| PLA2G15 | SNV | Missense_Mutation | c.566G>A | p.Gly189Glu | p.G189E | Q8NCC3 | protein_coding | deleterious(0.04) | possibly_damaging(0.852) | TCGA-NH-A8F8-01 | Colorectum | colon adenocarcinoma | Male | >=65 | III/IV | Chemotherapy | fluorouracil | PD | |
| PLA2G15 | insertion | Frame_Shift_Ins | rs763871300 | c.688_689insG | p.Val233ArgfsTer47 | p.V233Rfs*47 | Q8NCC3 | protein_coding | TCGA-G4-6309-01 | Colorectum | colon adenocarcinoma | Female | <65 | III/IV | Chemotherapy | xeloda | PD |
| Page: 1 2 3 4 |
Top |
Related drugs of malignant transformation related genes |
| Identification of chemicals and drugs interact with genes involved in malignant transfromation |
| (DGIdb 4.0) |
| Entrez ID | Symbol | Category | Interaction Types | Drug Claim Name | Drug Name | PMIDs |
| Page: 1 |

Copyright 2023-Present -The University of Texas Health Science Center at Houston |