
|
|||||
|
 | |
| |
| |
| |
| |
| |
|
Gene: PLA2G12B |
Gene summary for PLA2G12B |
| Gene information | Species | Human | Gene symbol | PLA2G12B | Gene ID | 84647 |
| Gene name | phospholipase A2 group XIIB | |
| Gene Alias | FKSG71 | |
| Cytomap | 10q22.1 | |
| Gene Type | protein-coding | GO ID | GO:0006629 | UniProtAcc | Q9BX93 |
Top |
Malignant transformation analysis |
| Identification of the aberrant gene expression in precancerous and cancerous lesions by comparing the gene expression of stem-like cells in diseased tissues with normal stem cells |
| Entrez ID | Symbol | Replicates | Species | Organ | Tissue | Adj P-value | Log2FC | Malignancy |
| 84647 | PLA2G12B | HCC1_Meng | Human | Liver | HCC | 2.95e-53 | 2.05e-01 | 0.0246 |
| 84647 | PLA2G12B | HCC2 | Human | Liver | HCC | 9.69e-05 | 2.74e+00 | 0.5341 |
| 84647 | PLA2G12B | S014 | Human | Liver | HCC | 2.44e-28 | 1.12e+00 | 0.2254 |
| 84647 | PLA2G12B | S015 | Human | Liver | HCC | 5.64e-27 | 1.41e+00 | 0.2375 |
| 84647 | PLA2G12B | S016 | Human | Liver | HCC | 4.45e-31 | 1.19e+00 | 0.2243 |
| 84647 | PLA2G12B | S027 | Human | Liver | HCC | 3.85e-02 | 3.66e-01 | 0.2446 |
| 84647 | PLA2G12B | S028 | Human | Liver | HCC | 3.88e-10 | 4.88e-01 | 0.2503 |
| 84647 | PLA2G12B | S029 | Human | Liver | HCC | 7.72e-15 | 7.94e-01 | 0.2581 |
| Page: 1 |
| Tissue | Expression Dynamics | Abbreviation |
| Liver | 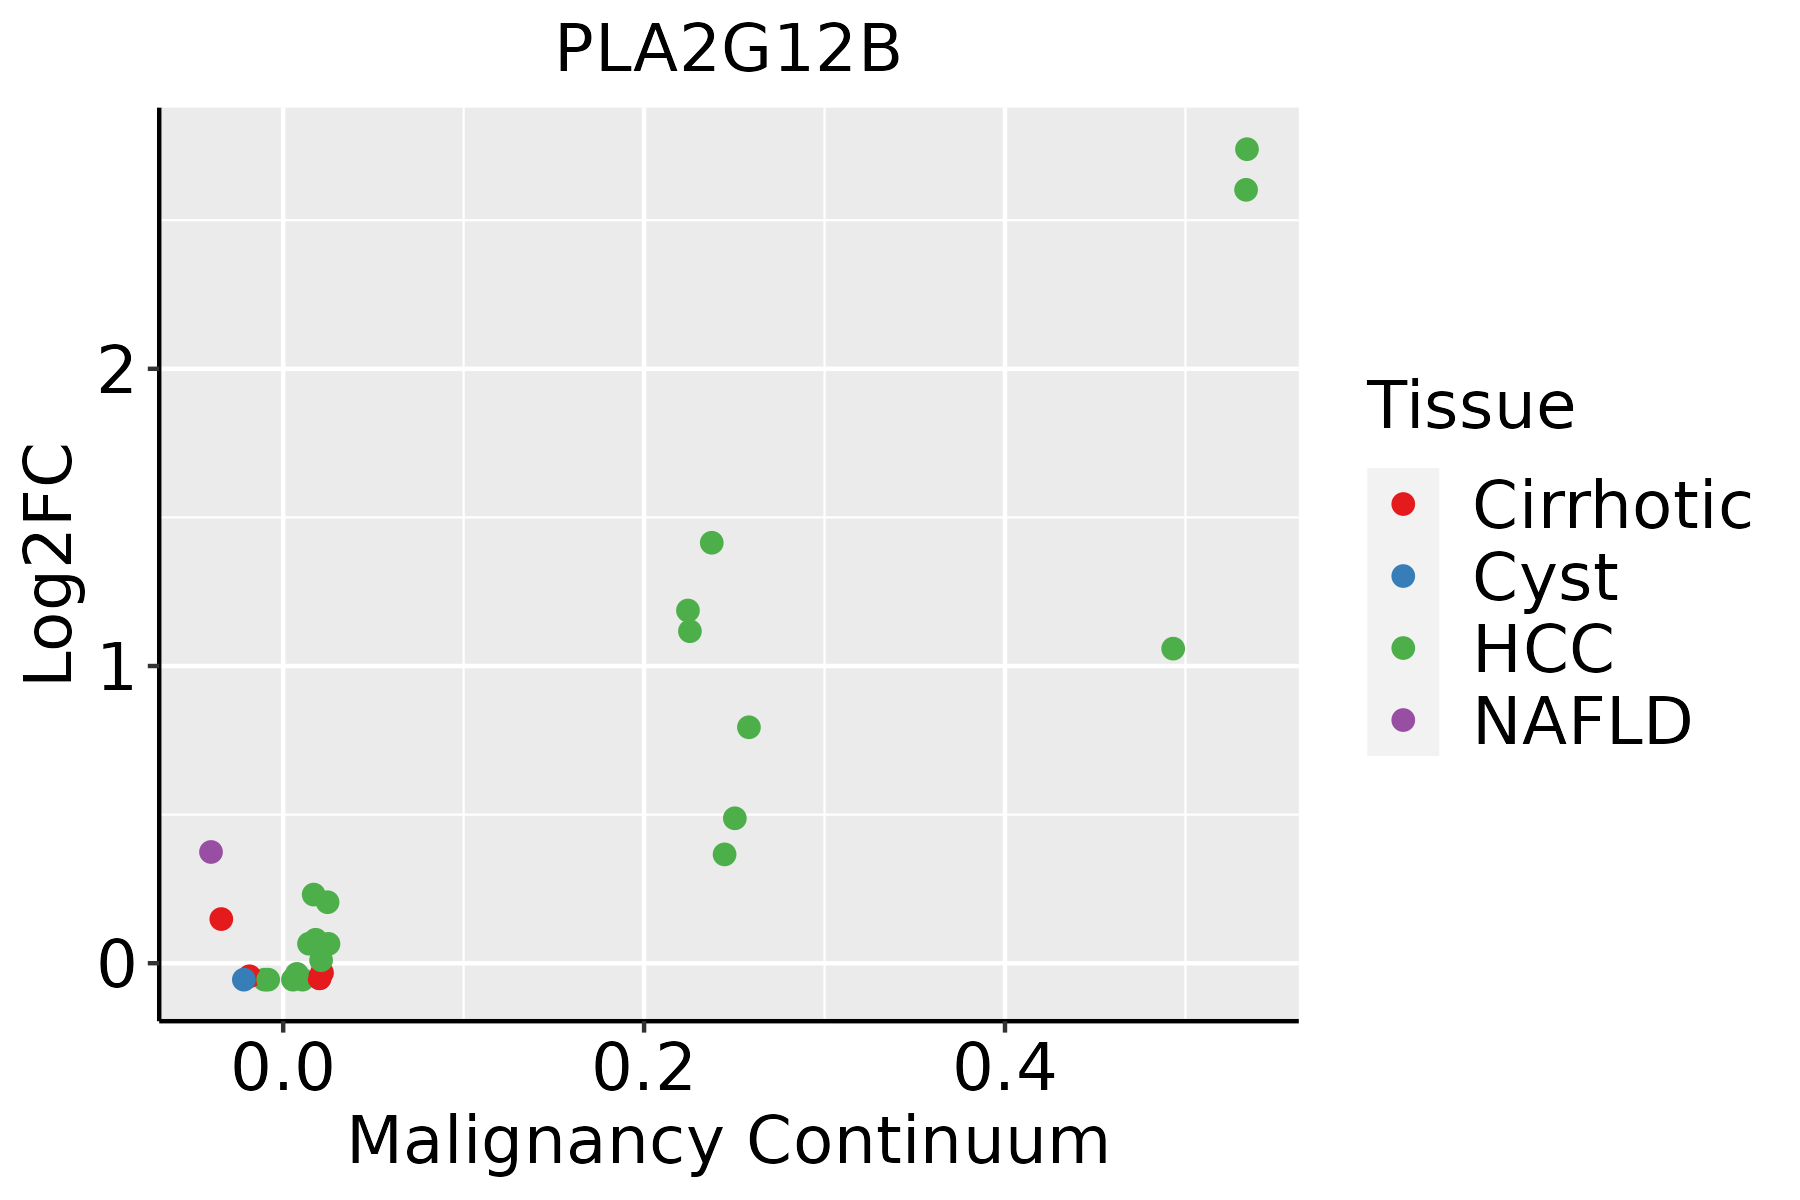 | HCC: Hepatocellular carcinoma |
| NAFLD: Non-alcoholic fatty liver disease |
| ∗log2FC in expression of this searched gene in stem-like cells from each diseased tissue sample relative to stem-like cells in normal samples in each tissue plotted against the malignancy continuum. Samples are colored based on if they are from different disease stage. |
Top |
Malignant transformation related pathway analysis |
| Find out the enriched GO biological processes and KEGG pathways involved in transition from healthy to precancer to cancer |
| Tissue | Disease Stage | Enriched GO biological Processes |
| Colorectum | AD |  |
| Colorectum | SER |  |
| Colorectum | MSS |  |
| Colorectum | MSI-H |  |
| Colorectum | FAP |  |
| ∗Top 15 enriched GO BP terms are showed in the bar plot of each disease state in each tissue. Each row represents a significant GO biological process which is colored according to the -log10(p.adjust). |
| Page: 1 2 3 4 5 6 7 8 9 |
| GO ID | Tissue | Disease Stage | Description | Gene Ratio | Bg Ratio | pvalue | p.adjust | Count |
| GO:00066444 | Liver | HCC | phospholipid metabolic process | 214/7958 | 383/18723 | 7.25e-08 | 1.48e-06 | 214 |
| GO:00550882 | Liver | HCC | lipid homeostasis | 103/7958 | 167/18723 | 4.27e-07 | 7.18e-06 | 103 |
| GO:001604221 | Liver | HCC | lipid catabolic process | 175/7958 | 320/18723 | 6.50e-06 | 7.88e-05 | 175 |
| GO:001087621 | Liver | HCC | lipid localization | 228/7958 | 448/18723 | 1.80e-04 | 1.41e-03 | 228 |
| GO:005509221 | Liver | HCC | sterol homeostasis | 59/7958 | 97/18723 | 2.06e-04 | 1.58e-03 | 59 |
| GO:004263221 | Liver | HCC | cholesterol homeostasis | 58/7958 | 96/18723 | 2.99e-04 | 2.13e-03 | 58 |
| GO:000686921 | Liver | HCC | lipid transport | 198/7958 | 398/18723 | 1.92e-03 | 9.78e-03 | 198 |
| GO:00550902 | Liver | HCC | acylglycerol homeostasis | 27/7958 | 42/18723 | 3.60e-03 | 1.60e-02 | 27 |
| GO:00703282 | Liver | HCC | triglyceride homeostasis | 27/7958 | 42/18723 | 3.60e-03 | 1.60e-02 | 27 |
| Page: 1 |
| Pathway ID | Tissue | Disease Stage | Description | Gene Ratio | Bg Ratio | pvalue | p.adjust | qvalue | Count |
| Page: 1 |
Top |
Cell-cell communication analysis |
| Identification of potential cell-cell interactions between two cell types and their ligand-receptor pairs for different disease states |
| Ligand | Receptor | LRpair | Pathway | Tissue | Disease Stage |
| Page: 1 |
Top |
Single-cell gene regulatory network inference analysis |
| Find out the significant the regulons (TFs) and the target genes of each regulon across cell types for different disease states |
| TF | Cell Type | Tissue | Disease Stage | Target Gene | RSS | Regulon Activity |
| ∗The dot plots of a searched regulon are shown for all cell subpopulations in each disease state of each tissue based on the regulon specific score inferred using pySCENIC and by calculating the average expression. |
| Page: 1 |
Top |
Somatic mutation of malignant transformation related genes |
| Annotation of somatic variants for genes involved in malignant transformation |
| Hugo Symbol | Variant Class | Variant Classification | dbSNP RS | HGVSc | HGVSp | HGVSp Short | SWISSPROT | BIOTYPE | SIFT | PolyPhen | Tumor Sample Barcode | Tissue | Histology | Sex | Age | Stage | Therapy Types | Drugs | Outcome |
| PLA2G12B | SNV | Missense_Mutation | c.121N>A | p.Gly41Arg | p.G41R | Q9BX93 | protein_coding | deleterious(0.02) | possibly_damaging(0.832) | TCGA-A8-A09Z-01 | Breast | breast invasive carcinoma | Female | >=65 | I/II | Unknown | Unknown | SD | |
| PLA2G12B | SNV | Missense_Mutation | novel | c.534G>A | p.Met178Ile | p.M178I | Q9BX93 | protein_coding | deleterious(0.01) | probably_damaging(0.992) | TCGA-JW-A5VL-01 | Cervix | cervical & endocervical cancer | Female | <65 | I/II | Unknown | Unknown | SD |
| PLA2G12B | SNV | Missense_Mutation | c.565G>C | p.Glu189Gln | p.E189Q | Q9BX93 | protein_coding | tolerated(0.43) | probably_damaging(0.958) | TCGA-UC-A7PF-01 | Cervix | cervical & endocervical cancer | Female | <65 | I/II | Unknown | Unknown | SD | |
| PLA2G12B | SNV | Missense_Mutation | c.505N>A | p.Val169Met | p.V169M | Q9BX93 | protein_coding | deleterious(0) | probably_damaging(0.968) | TCGA-AZ-6601-01 | Colorectum | colon adenocarcinoma | Male | >=65 | I/II | Unknown | Unknown | PD | |
| PLA2G12B | SNV | Missense_Mutation | novel | c.143N>T | p.Ser48Ile | p.S48I | Q9BX93 | protein_coding | tolerated(0.06) | possibly_damaging(0.478) | TCGA-A5-A0G1-01 | Endometrium | uterine corpus endometrioid carcinoma | Female | >=65 | I/II | Unknown | Unknown | SD |
| PLA2G12B | SNV | Missense_Mutation | c.329N>C | p.Lys110Thr | p.K110T | Q9BX93 | protein_coding | deleterious(0) | probably_damaging(0.967) | TCGA-A5-A2K5-01 | Endometrium | uterine corpus endometrioid carcinoma | Female | >=65 | I/II | Unknown | Unknown | SD | |
| PLA2G12B | SNV | Missense_Mutation | rs375272873 | c.436N>T | p.Arg146Trp | p.R146W | Q9BX93 | protein_coding | deleterious(0) | probably_damaging(0.932) | TCGA-AJ-A3BH-01 | Endometrium | uterine corpus endometrioid carcinoma | Female | Unknown | I/II | Unknown | Unknown | SD |
| PLA2G12B | SNV | Missense_Mutation | novel | c.377N>C | p.Lys126Thr | p.K126T | Q9BX93 | protein_coding | deleterious(0.03) | probably_damaging(1) | TCGA-AJ-A3EL-01 | Endometrium | uterine corpus endometrioid carcinoma | Female | <65 | I/II | Unknown | Unknown | SD |
| PLA2G12B | SNV | Missense_Mutation | rs376569180 | c.119G>A | p.Arg40Gln | p.R40Q | Q9BX93 | protein_coding | deleterious(0.02) | probably_damaging(0.998) | TCGA-BG-A0MQ-01 | Endometrium | uterine corpus endometrioid carcinoma | Female | >=65 | I/II | Unknown | Unknown | SD |
| PLA2G12B | SNV | Missense_Mutation | rs745439702 | c.262T>C | p.Cys88Arg | p.C88R | Q9BX93 | protein_coding | deleterious(0) | possibly_damaging(0.88) | TCGA-EY-A1G8-01 | Endometrium | uterine corpus endometrioid carcinoma | Female | >=65 | I/II | Unknown | Unknown | SD |
| Page: 1 2 3 |
Top |
Related drugs of malignant transformation related genes |
| Identification of chemicals and drugs interact with genes involved in malignant transfromation |
| (DGIdb 4.0) |
| Entrez ID | Symbol | Category | Interaction Types | Drug Claim Name | Drug Name | PMIDs |
| Page: 1 |

Copyright 2023-Present -The University of Texas Health Science Center at Houston |