
|
|||||
|
 | |
| |
| |
| |
| |
| |
|
Gene: PLA2G12A |
Gene summary for PLA2G12A |
| Gene information | Species | Human | Gene symbol | PLA2G12A | Gene ID | 81579 |
| Gene name | phospholipase A2 group XIIA | |
| Gene Alias | GXII | |
| Cytomap | 4q25 | |
| Gene Type | protein-coding | GO ID | GO:0006629 | UniProtAcc | Q542Y6 |
Top |
Malignant transformation analysis |
| Identification of the aberrant gene expression in precancerous and cancerous lesions by comparing the gene expression of stem-like cells in diseased tissues with normal stem cells |
| Entrez ID | Symbol | Replicates | Species | Organ | Tissue | Adj P-value | Log2FC | Malignancy |
| 81579 | PLA2G12A | HTA11_3410_2000001011 | Human | Colorectum | AD | 3.20e-03 | 2.24e-01 | 0.0155 |
| 81579 | PLA2G12A | HTA11_1938_2000001011 | Human | Colorectum | AD | 5.23e-06 | 4.84e-01 | -0.0811 |
| 81579 | PLA2G12A | HTA11_78_2000001011 | Human | Colorectum | AD | 3.46e-17 | 6.54e-01 | -0.1088 |
| 81579 | PLA2G12A | HTA11_347_2000001011 | Human | Colorectum | AD | 4.83e-32 | 7.90e-01 | -0.1954 |
| 81579 | PLA2G12A | HTA11_83_2000001011 | Human | Colorectum | SER | 1.04e-02 | 3.44e-01 | -0.1526 |
| 81579 | PLA2G12A | HTA11_866_3004761011 | Human | Colorectum | AD | 2.04e-03 | 3.25e-01 | 0.096 |
| 81579 | PLA2G12A | HTA11_7663_2000001011 | Human | Colorectum | SER | 7.79e-03 | 4.19e-01 | 0.0131 |
| 81579 | PLA2G12A | HTA11_10623_2000001011 | Human | Colorectum | AD | 1.06e-03 | 4.99e-01 | -0.0177 |
| 81579 | PLA2G12A | HTA11_6801_2000001011 | Human | Colorectum | SER | 2.06e-03 | 6.15e-01 | 0.0171 |
| 81579 | PLA2G12A | HTA11_7696_3000711011 | Human | Colorectum | AD | 2.14e-06 | 4.81e-01 | 0.0674 |
| 81579 | PLA2G12A | HTA11_99999970781_79442 | Human | Colorectum | MSS | 2.98e-06 | 3.62e-01 | 0.294 |
| 81579 | PLA2G12A | HTA11_99999965062_69753 | Human | Colorectum | MSI-H | 1.53e-03 | 7.98e-01 | 0.3487 |
| 81579 | PLA2G12A | HTA11_99999965104_69814 | Human | Colorectum | MSS | 8.45e-09 | 5.38e-01 | 0.281 |
| 81579 | PLA2G12A | HTA11_99999971662_82457 | Human | Colorectum | MSS | 1.40e-06 | 4.73e-01 | 0.3859 |
| 81579 | PLA2G12A | A015-C-203 | Human | Colorectum | FAP | 3.91e-04 | -1.41e-01 | -0.1294 |
| 81579 | PLA2G12A | A001-C-108 | Human | Colorectum | FAP | 2.92e-04 | -1.32e-01 | -0.0272 |
| 81579 | PLA2G12A | A002-C-114 | Human | Colorectum | FAP | 1.40e-02 | -1.65e-01 | -0.1561 |
| 81579 | PLA2G12A | A015-C-104 | Human | Colorectum | FAP | 9.96e-04 | -1.03e-01 | -0.1899 |
| 81579 | PLA2G12A | A001-C-014 | Human | Colorectum | FAP | 3.17e-03 | -1.46e-01 | 0.0135 |
| 81579 | PLA2G12A | A002-C-116 | Human | Colorectum | FAP | 2.47e-03 | -1.15e-01 | -0.0452 |
| Page: 1 2 3 4 5 6 |
| Tissue | Expression Dynamics | Abbreviation |
| Colorectum (GSE201348) |  | FAP: Familial adenomatous polyposis |
| CRC: Colorectal cancer | ||
| Colorectum (HTA11) |  | AD: Adenomas |
| SER: Sessile serrated lesions | ||
| MSI-H: Microsatellite-high colorectal cancer | ||
| MSS: Microsatellite stable colorectal cancer | ||
| Esophagus | 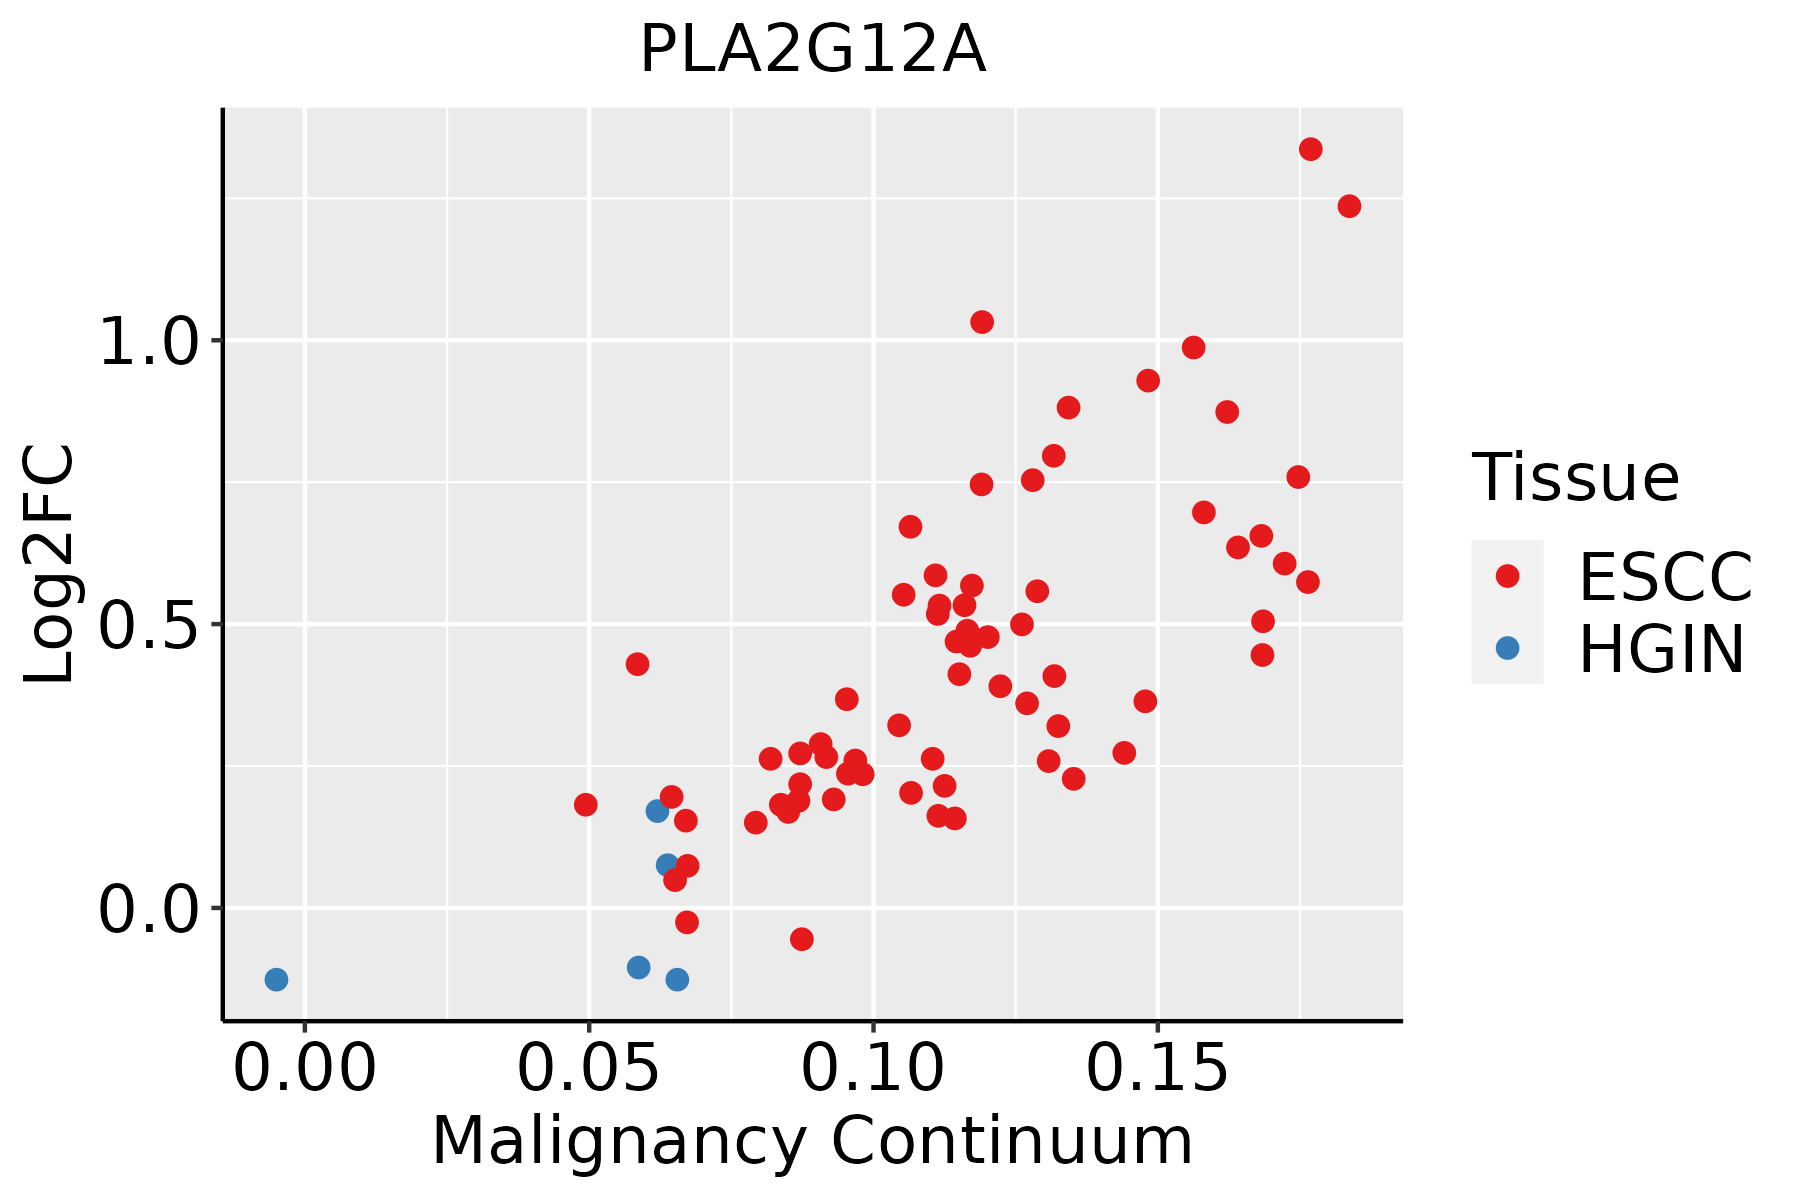 | ESCC: Esophageal squamous cell carcinoma |
| HGIN: High-grade intraepithelial neoplasias | ||
| LGIN: Low-grade intraepithelial neoplasias | ||
| Liver | 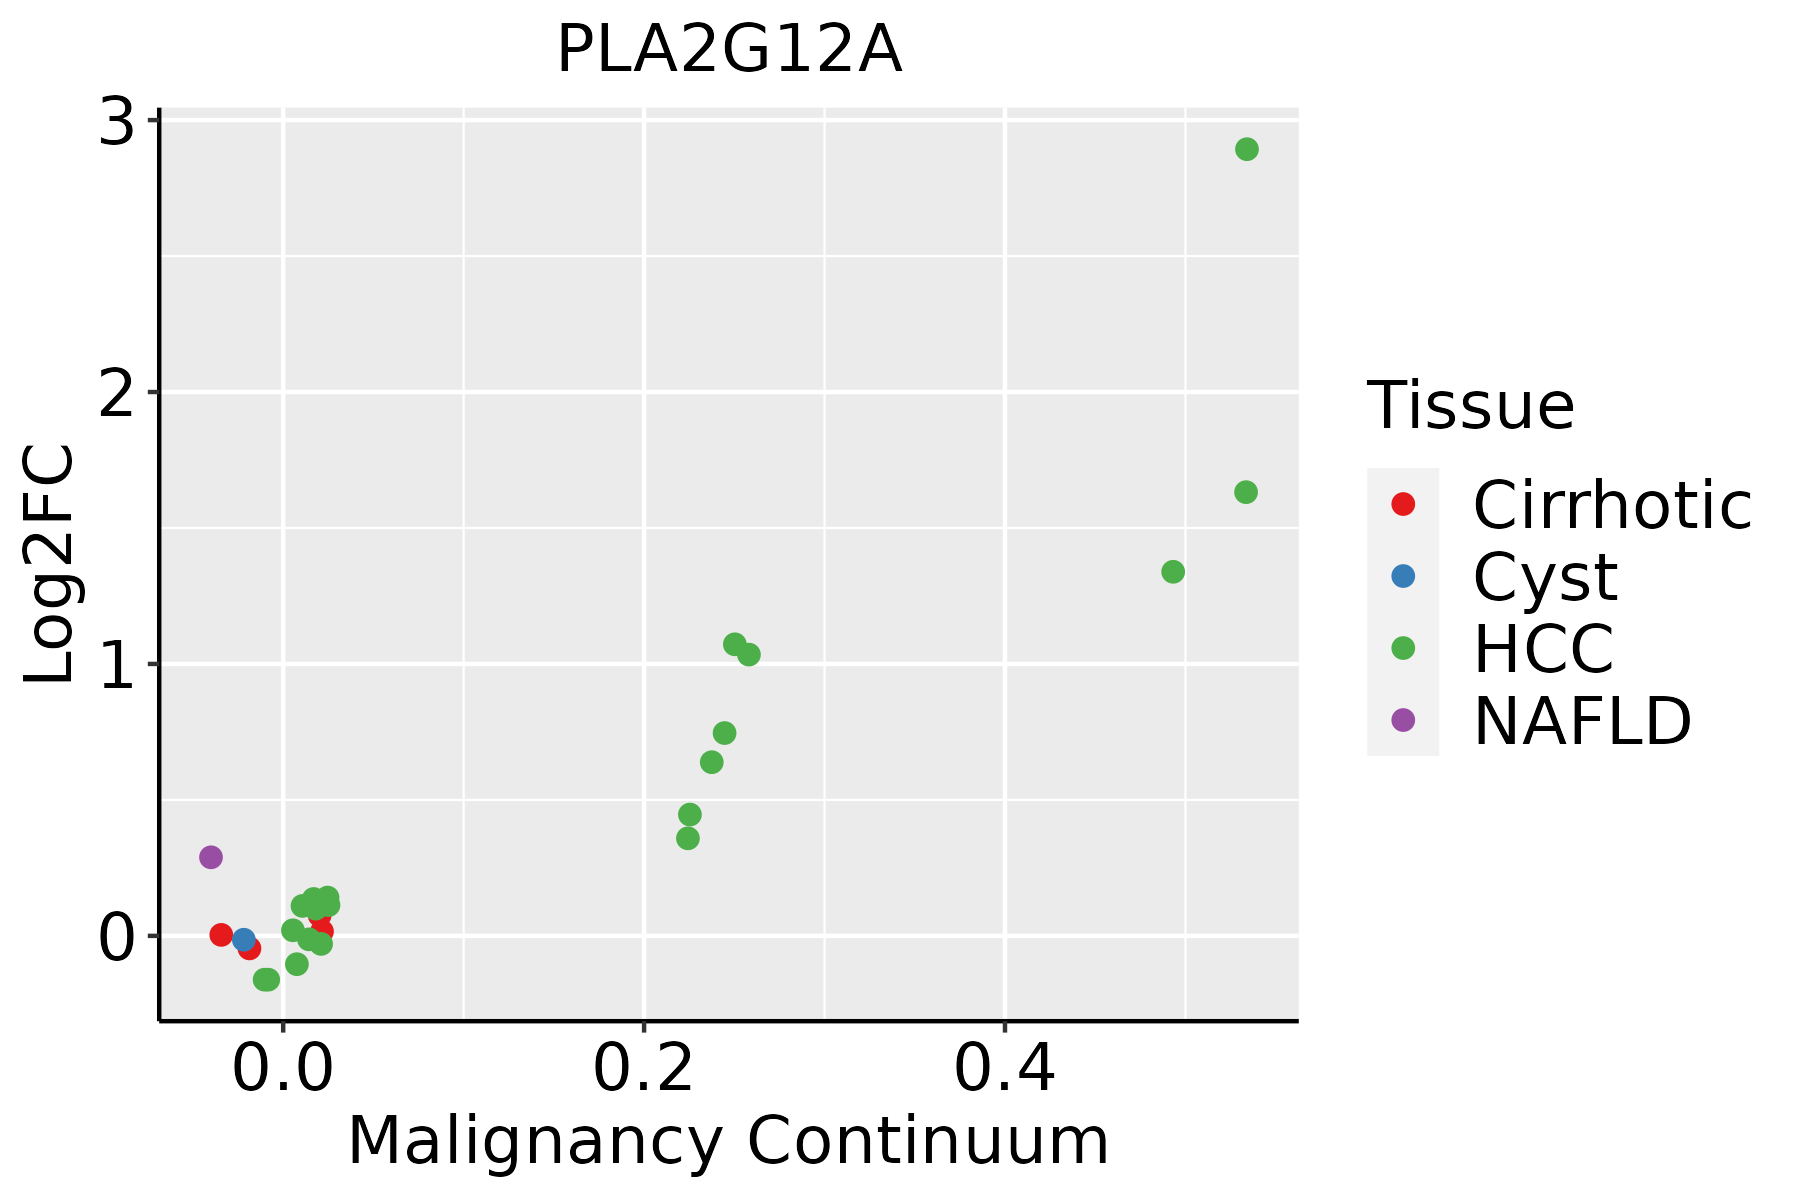 | HCC: Hepatocellular carcinoma |
| NAFLD: Non-alcoholic fatty liver disease | ||
| Oral Cavity | 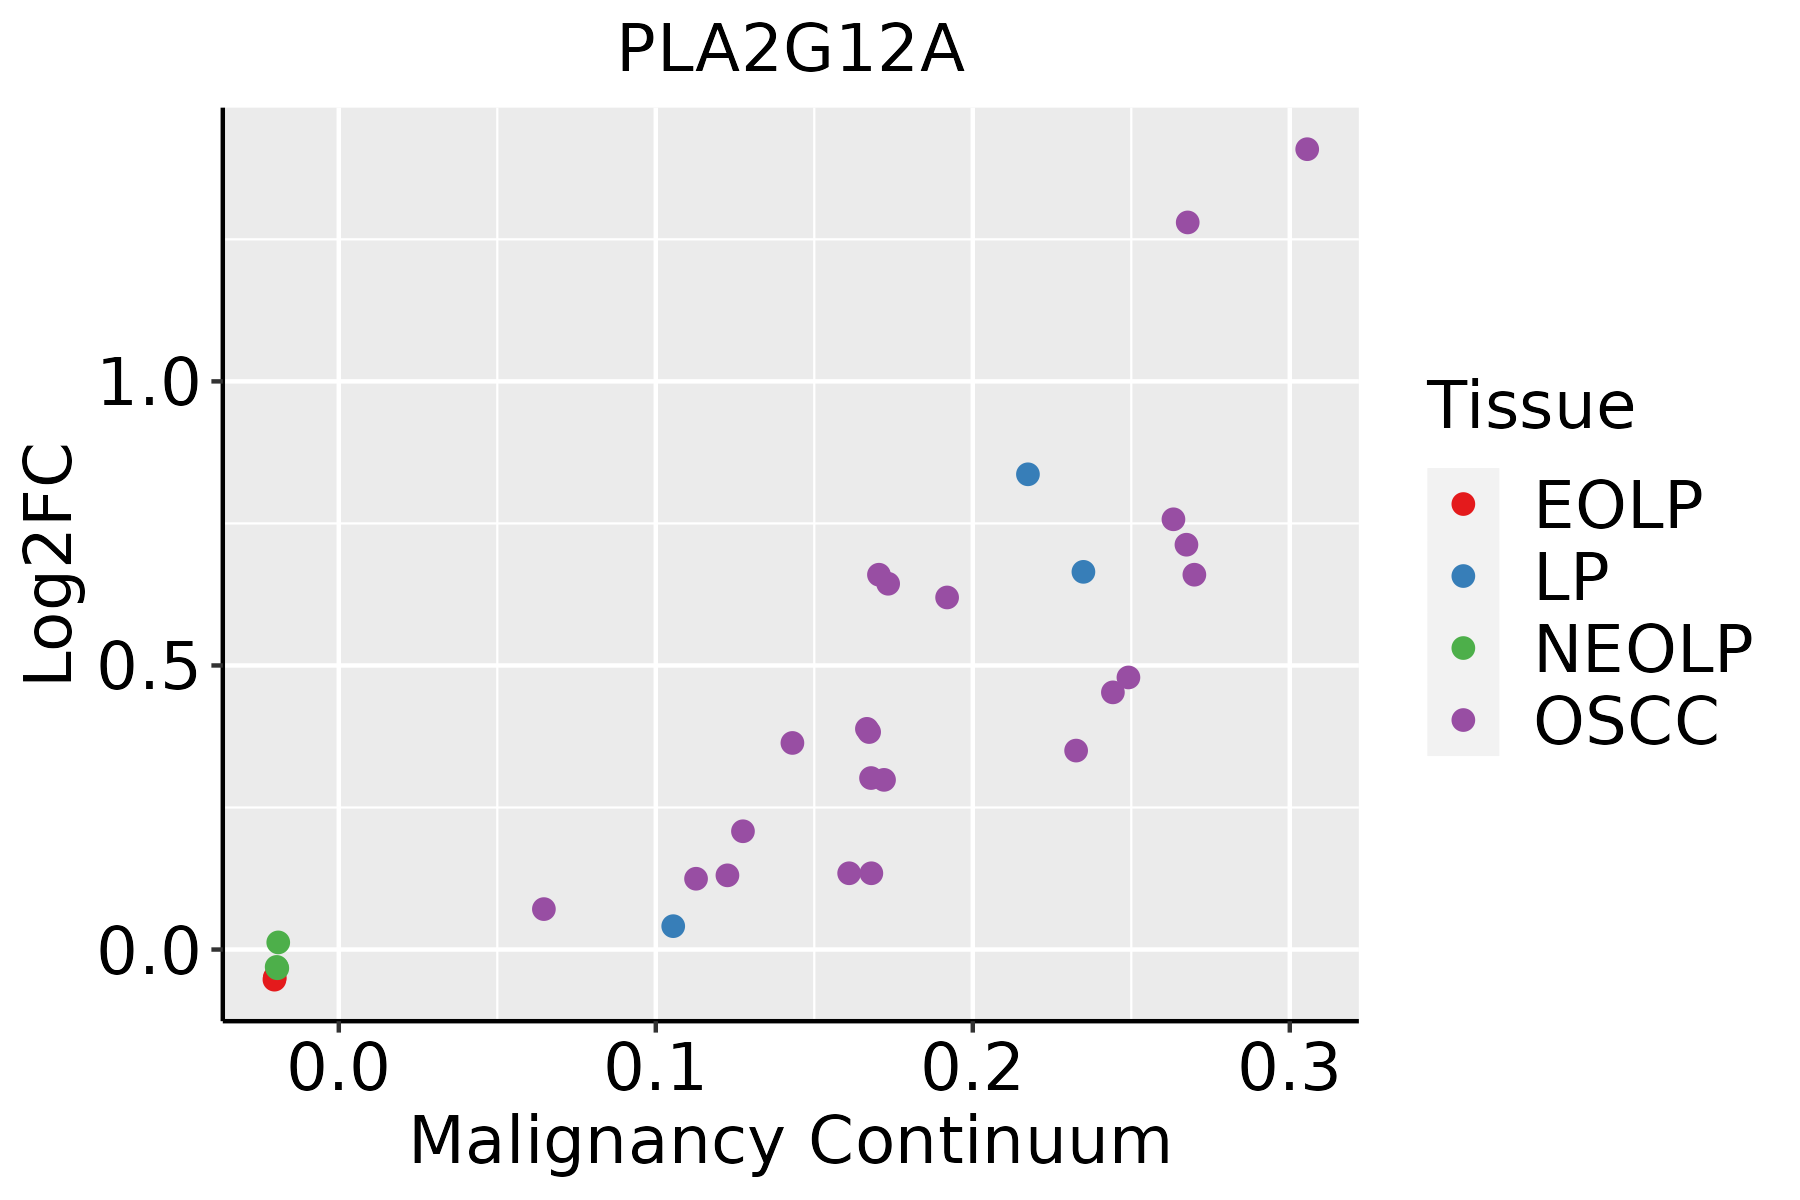 | EOLP: Erosive Oral lichen planus |
| LP: leukoplakia | ||
| NEOLP: Non-erosive oral lichen planus | ||
| OSCC: Oral squamous cell carcinoma | ||
| Prostate | 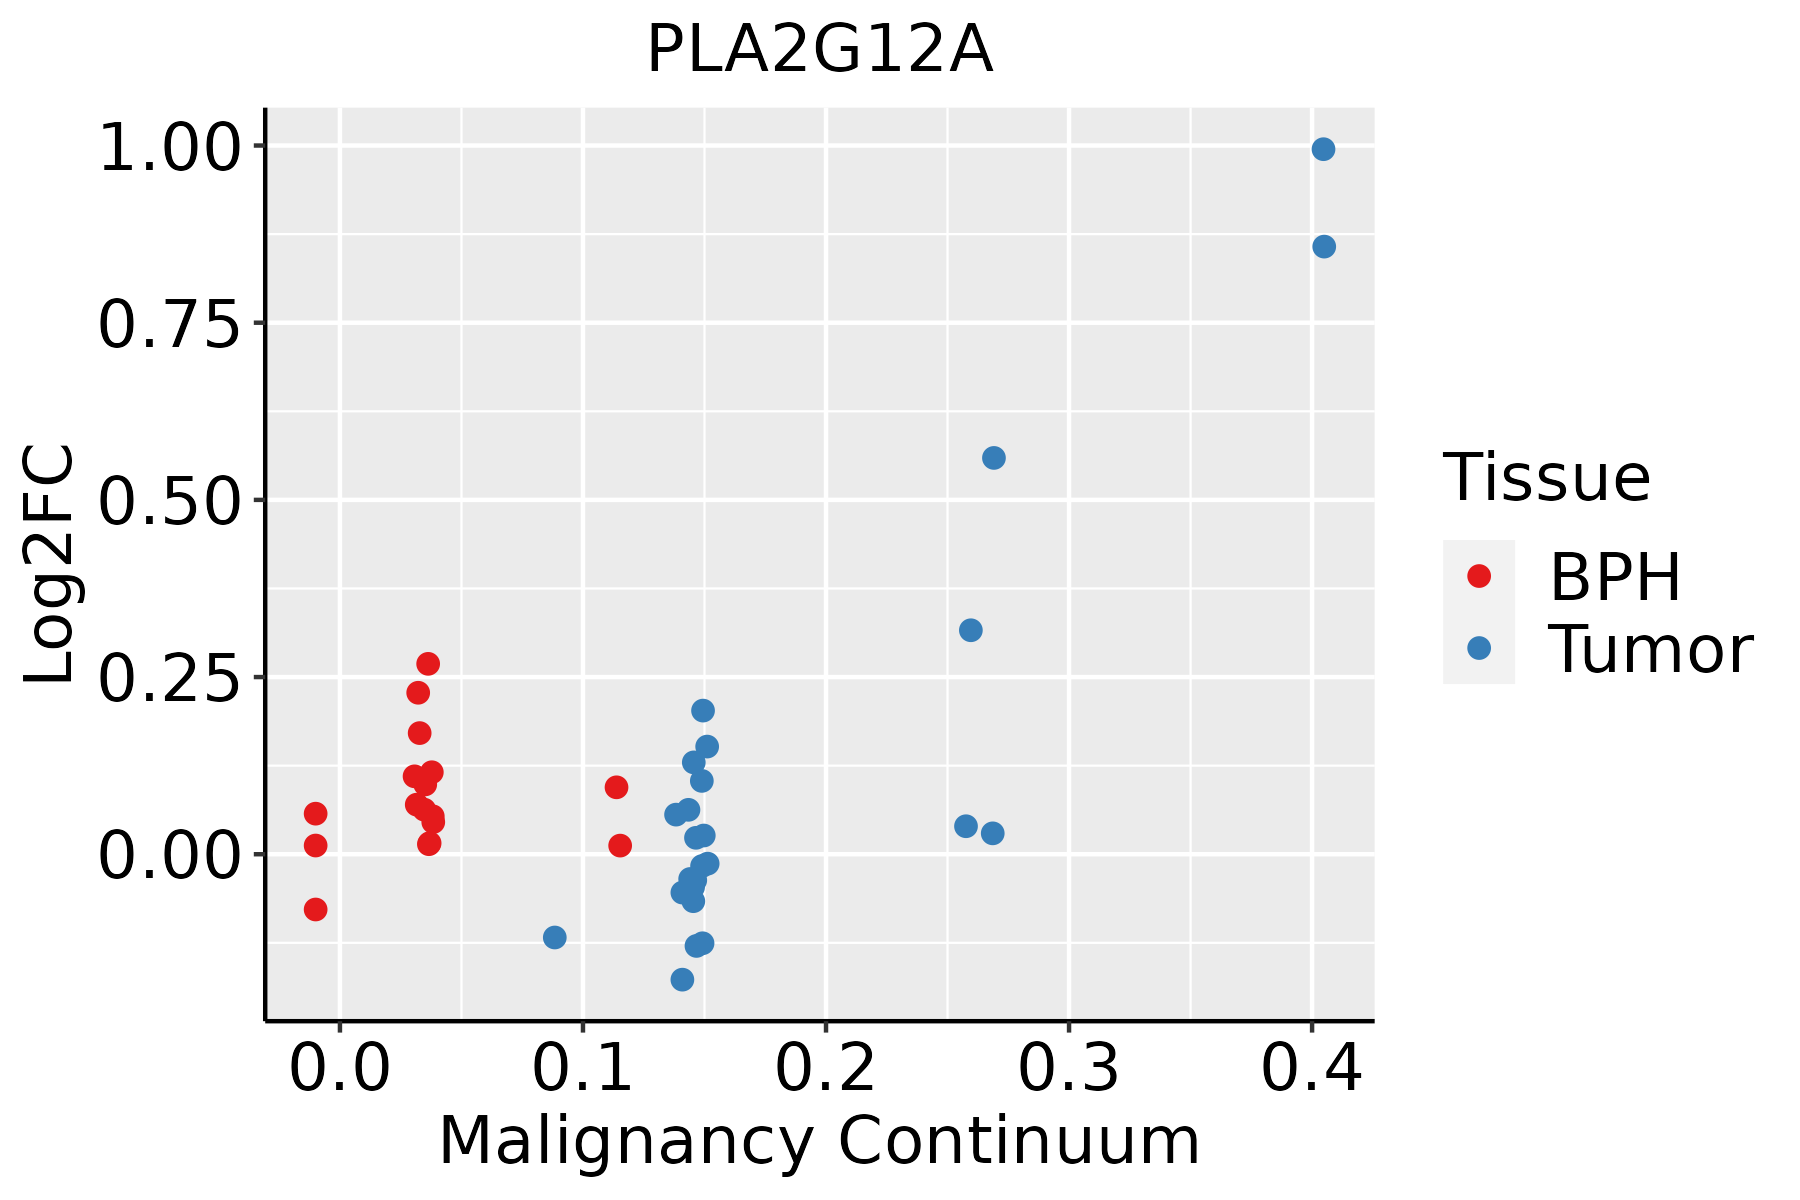 | BPH: Benign Prostatic Hyperplasia |
| Skin |  | AK: Actinic keratosis |
| cSCC: Cutaneous squamous cell carcinoma | ||
| SCCIS:squamous cell carcinoma in situ |
| ∗log2FC in expression of this searched gene in stem-like cells from each diseased tissue sample relative to stem-like cells in normal samples in each tissue plotted against the malignancy continuum. Samples are colored based on if they are from different disease stage. |
Top |
Malignant transformation related pathway analysis |
| Find out the enriched GO biological processes and KEGG pathways involved in transition from healthy to precancer to cancer |
| Tissue | Disease Stage | Enriched GO biological Processes |
| Colorectum | AD |  |
| Colorectum | SER |  |
| Colorectum | MSS |  |
| Colorectum | MSI-H |  |
| Colorectum | FAP |  |
| ∗Top 15 enriched GO BP terms are showed in the bar plot of each disease state in each tissue. Each row represents a significant GO biological process which is colored according to the -log10(p.adjust). |
| Page: 1 2 3 4 5 6 7 8 9 |
| GO ID | Tissue | Disease Stage | Description | Gene Ratio | Bg Ratio | pvalue | p.adjust | Count |
| GO:0016042 | Colorectum | AD | lipid catabolic process | 97/3918 | 320/18723 | 4.31e-05 | 7.56e-04 | 97 |
| GO:0010876 | Colorectum | AD | lipid localization | 120/3918 | 448/18723 | 1.59e-03 | 1.33e-02 | 120 |
| GO:0006869 | Colorectum | AD | lipid transport | 108/3918 | 398/18723 | 1.67e-03 | 1.39e-02 | 108 |
| GO:0006644 | Colorectum | AD | phospholipid metabolic process | 101/3918 | 383/18723 | 5.80e-03 | 3.67e-02 | 101 |
| GO:00160421 | Colorectum | SER | lipid catabolic process | 77/2897 | 320/18723 | 3.52e-05 | 9.18e-04 | 77 |
| GO:00066441 | Colorectum | SER | phospholipid metabolic process | 79/2897 | 383/18723 | 3.94e-03 | 3.24e-02 | 79 |
| GO:00108761 | Colorectum | MSS | lipid localization | 104/3467 | 448/18723 | 6.76e-03 | 4.38e-02 | 104 |
| GO:00160422 | Colorectum | MSS | lipid catabolic process | 77/3467 | 320/18723 | 7.43e-03 | 4.71e-02 | 77 |
| GO:00068691 | Colorectum | FAP | lipid transport | 81/2622 | 398/18723 | 2.84e-04 | 3.76e-03 | 81 |
| GO:00160423 | Colorectum | FAP | lipid catabolic process | 65/2622 | 320/18723 | 1.13e-03 | 1.08e-02 | 65 |
| GO:00108762 | Colorectum | FAP | lipid localization | 85/2622 | 448/18723 | 1.92e-03 | 1.63e-02 | 85 |
| GO:00066442 | Colorectum | FAP | phospholipid metabolic process | 74/2622 | 383/18723 | 2.24e-03 | 1.83e-02 | 74 |
| GO:0015908 | Colorectum | FAP | fatty acid transport | 21/2622 | 86/18723 | 6.79e-03 | 4.17e-02 | 21 |
| GO:00066443 | Colorectum | CRC | phospholipid metabolic process | 65/2078 | 383/18723 | 3.21e-04 | 4.95e-03 | 65 |
| GO:00160424 | Colorectum | CRC | lipid catabolic process | 53/2078 | 320/18723 | 1.89e-03 | 1.93e-02 | 53 |
| GO:00068692 | Colorectum | CRC | lipid transport | 63/2078 | 398/18723 | 2.36e-03 | 2.26e-02 | 63 |
| GO:00108763 | Colorectum | CRC | lipid localization | 68/2078 | 448/18723 | 4.60e-03 | 3.58e-02 | 68 |
| GO:00066446 | Esophagus | ESCC | phospholipid metabolic process | 218/8552 | 383/18723 | 5.37e-06 | 5.59e-05 | 218 |
| GO:00160427 | Esophagus | ESCC | lipid catabolic process | 168/8552 | 320/18723 | 7.97e-03 | 2.84e-02 | 168 |
| GO:001604212 | Liver | Cirrhotic | lipid catabolic process | 112/4634 | 320/18723 | 2.31e-05 | 3.03e-04 | 112 |
| Page: 1 2 |
| Pathway ID | Tissue | Disease Stage | Description | Gene Ratio | Bg Ratio | pvalue | p.adjust | qvalue | Count |
| hsa04972 | Colorectum | AD | Pancreatic secretion | 36/2092 | 102/8465 | 1.06e-02 | 3.98e-02 | 2.54e-02 | 36 |
| hsa049721 | Colorectum | AD | Pancreatic secretion | 36/2092 | 102/8465 | 1.06e-02 | 3.98e-02 | 2.54e-02 | 36 |
| hsa049722 | Colorectum | SER | Pancreatic secretion | 30/1580 | 102/8465 | 5.41e-03 | 3.28e-02 | 2.38e-02 | 30 |
| hsa049723 | Colorectum | SER | Pancreatic secretion | 30/1580 | 102/8465 | 5.41e-03 | 3.28e-02 | 2.38e-02 | 30 |
| hsa049724 | Colorectum | MSS | Pancreatic secretion | 33/1875 | 102/8465 | 1.09e-02 | 3.75e-02 | 2.30e-02 | 33 |
| hsa049725 | Colorectum | MSS | Pancreatic secretion | 33/1875 | 102/8465 | 1.09e-02 | 3.75e-02 | 2.30e-02 | 33 |
| hsa049726 | Colorectum | FAP | Pancreatic secretion | 34/1404 | 102/8465 | 2.43e-05 | 2.78e-04 | 1.69e-04 | 34 |
| hsa04270 | Colorectum | FAP | Vascular smooth muscle contraction | 33/1404 | 134/8465 | 1.05e-02 | 3.74e-02 | 2.28e-02 | 33 |
| hsa049727 | Colorectum | FAP | Pancreatic secretion | 34/1404 | 102/8465 | 2.43e-05 | 2.78e-04 | 1.69e-04 | 34 |
| hsa042701 | Colorectum | FAP | Vascular smooth muscle contraction | 33/1404 | 134/8465 | 1.05e-02 | 3.74e-02 | 2.28e-02 | 33 |
| hsa049728 | Colorectum | CRC | Pancreatic secretion | 32/1091 | 102/8465 | 7.86e-07 | 4.37e-05 | 2.96e-05 | 32 |
| hsa04014 | Colorectum | CRC | Ras signaling pathway | 49/1091 | 236/8465 | 4.04e-04 | 4.50e-03 | 3.05e-03 | 49 |
| hsa042702 | Colorectum | CRC | Vascular smooth muscle contraction | 27/1091 | 134/8465 | 1.13e-02 | 4.90e-02 | 3.32e-02 | 27 |
| hsa049729 | Colorectum | CRC | Pancreatic secretion | 32/1091 | 102/8465 | 7.86e-07 | 4.37e-05 | 2.96e-05 | 32 |
| hsa040141 | Colorectum | CRC | Ras signaling pathway | 49/1091 | 236/8465 | 4.04e-04 | 4.50e-03 | 3.05e-03 | 49 |
| hsa042703 | Colorectum | CRC | Vascular smooth muscle contraction | 27/1091 | 134/8465 | 1.13e-02 | 4.90e-02 | 3.32e-02 | 27 |
| Page: 1 |
Top |
Cell-cell communication analysis |
| Identification of potential cell-cell interactions between two cell types and their ligand-receptor pairs for different disease states |
| Ligand | Receptor | LRpair | Pathway | Tissue | Disease Stage |
| Page: 1 |
Top |
Single-cell gene regulatory network inference analysis |
| Find out the significant the regulons (TFs) and the target genes of each regulon across cell types for different disease states |
| TF | Cell Type | Tissue | Disease Stage | Target Gene | RSS | Regulon Activity |
| ∗The dot plots of a searched regulon are shown for all cell subpopulations in each disease state of each tissue based on the regulon specific score inferred using pySCENIC and by calculating the average expression. |
| Page: 1 |
Top |
Somatic mutation of malignant transformation related genes |
| Annotation of somatic variants for genes involved in malignant transformation |
| Hugo Symbol | Variant Class | Variant Classification | dbSNP RS | HGVSc | HGVSp | HGVSp Short | SWISSPROT | BIOTYPE | SIFT | PolyPhen | Tumor Sample Barcode | Tissue | Histology | Sex | Age | Stage | Therapy Types | Drugs | Outcome |
| PLA2G12A | SNV | Missense_Mutation | novel | c.127N>T | p.His43Tyr | p.H43Y | Q9BZM1 | protein_coding | deleterious(0.01) | probably_damaging(0.996) | TCGA-DS-A7WH-01 | Cervix | cervical & endocervical cancer | Female | <65 | I/II | Chemotherapy | cisplatin | CR |
| PLA2G12A | SNV | Missense_Mutation | rs771775332 | c.227N>A | p.Arg76His | p.R76H | Q9BZM1 | protein_coding | deleterious(0.01) | benign(0.044) | TCGA-AA-3984-01 | Colorectum | colon adenocarcinoma | Female | <65 | I/II | Unknown | Unknown | SD |
| PLA2G12A | SNV | Missense_Mutation | c.527G>T | p.Arg176Leu | p.R176L | Q9BZM1 | protein_coding | deleterious(0) | probably_damaging(0.999) | TCGA-AH-6644-01 | Colorectum | rectum adenocarcinoma | Male | >=65 | III/IV | Unknown | Unknown | SD | |
| PLA2G12A | SNV | Missense_Mutation | c.499G>T | p.Gly167Cys | p.G167C | Q9BZM1 | protein_coding | deleterious(0) | probably_damaging(1) | TCGA-AP-A051-01 | Endometrium | uterine corpus endometrioid carcinoma | Female | >=65 | I/II | Unknown | Unknown | SD | |
| PLA2G12A | SNV | Missense_Mutation | novel | c.322N>G | p.Asn108Asp | p.N108D | Q9BZM1 | protein_coding | tolerated(0.09) | benign(0.193) | TCGA-B5-A3FA-01 | Endometrium | uterine corpus endometrioid carcinoma | Female | >=65 | I/II | Unknown | Unknown | SD |
| PLA2G12A | SNV | Missense_Mutation | rs368449766 | c.251C>T | p.Pro84Leu | p.P84L | Q9BZM1 | protein_coding | deleterious(0) | possibly_damaging(0.561) | TCGA-D1-A1NZ-01 | Endometrium | uterine corpus endometrioid carcinoma | Female | <65 | I/II | Unknown | Unknown | SD |
| PLA2G12A | SNV | Missense_Mutation | novel | c.533N>T | p.Ala178Val | p.A178V | Q9BZM1 | protein_coding | deleterious(0) | benign(0.329) | TCGA-DF-A2KU-01 | Endometrium | uterine corpus endometrioid carcinoma | Female | Unknown | I/II | Unknown | Unknown | SD |
| PLA2G12A | SNV | Missense_Mutation | rs771775332 | c.227N>A | p.Arg76His | p.R76H | Q9BZM1 | protein_coding | deleterious(0.01) | benign(0.044) | TCGA-EC-A24G-01 | Endometrium | uterine corpus endometrioid carcinoma | Female | <65 | I/II | Chemotherapy | doxorubicin | SD |
| PLA2G12A | SNV | Missense_Mutation | c.527N>A | p.Arg176Gln | p.R176Q | Q9BZM1 | protein_coding | deleterious(0) | probably_damaging(0.998) | TCGA-EY-A1GD-01 | Endometrium | uterine corpus endometrioid carcinoma | Female | <65 | I/II | Unknown | Unknown | SD | |
| PLA2G12A | insertion | Frame_Shift_Ins | novel | c.559_560insA | p.Thr187AsnfsTer2 | p.T187Nfs*2 | Q9BZM1 | protein_coding | TCGA-AX-A05Z-01 | Endometrium | uterine corpus endometrioid carcinoma | Female | <65 | III/IV | Chemotherapy | adriamycin | SD |
| Page: 1 2 |
Top |
Related drugs of malignant transformation related genes |
| Identification of chemicals and drugs interact with genes involved in malignant transfromation |
| (DGIdb 4.0) |
| Entrez ID | Symbol | Category | Interaction Types | Drug Claim Name | Drug Name | PMIDs |
| Page: 1 |

Copyright 2023-Present -The University of Texas Health Science Center at Houston |