
|
|||||
|
 | |
| |
| |
| |
| |
| |
|
Gene: PLA1A |
Gene summary for PLA1A |
| Gene information | Species | Human | Gene symbol | PLA1A | Gene ID | 51365 |
| Gene name | phospholipase A1 member A | |
| Gene Alias | PS-PLA1 | |
| Cytomap | 3q13.33 | |
| Gene Type | protein-coding | GO ID | GO:0006575 | UniProtAcc | Q53H76 |
Top |
Malignant transformation analysis |
| Identification of the aberrant gene expression in precancerous and cancerous lesions by comparing the gene expression of stem-like cells in diseased tissues with normal stem cells |
| Entrez ID | Symbol | Replicates | Species | Organ | Tissue | Adj P-value | Log2FC | Malignancy |
| 51365 | PLA1A | HCC1_Meng | Human | Liver | HCC | 5.93e-55 | 2.07e-01 | 0.0246 |
| 51365 | PLA1A | HCC2 | Human | Liver | HCC | 1.85e-25 | 4.51e+00 | 0.5341 |
| 51365 | PLA1A | S014 | Human | Liver | HCC | 1.93e-03 | 2.55e-01 | 0.2254 |
| 51365 | PLA1A | S016 | Human | Liver | HCC | 4.17e-03 | 3.28e-01 | 0.2243 |
| 51365 | PLA1A | S027 | Human | Liver | HCC | 4.34e-05 | 7.78e-01 | 0.2446 |
| 51365 | PLA1A | S028 | Human | Liver | HCC | 5.39e-33 | 1.21e+00 | 0.2503 |
| 51365 | PLA1A | S029 | Human | Liver | HCC | 6.67e-40 | 1.82e+00 | 0.2581 |
| Page: 1 |
| Tissue | Expression Dynamics | Abbreviation |
| Liver | 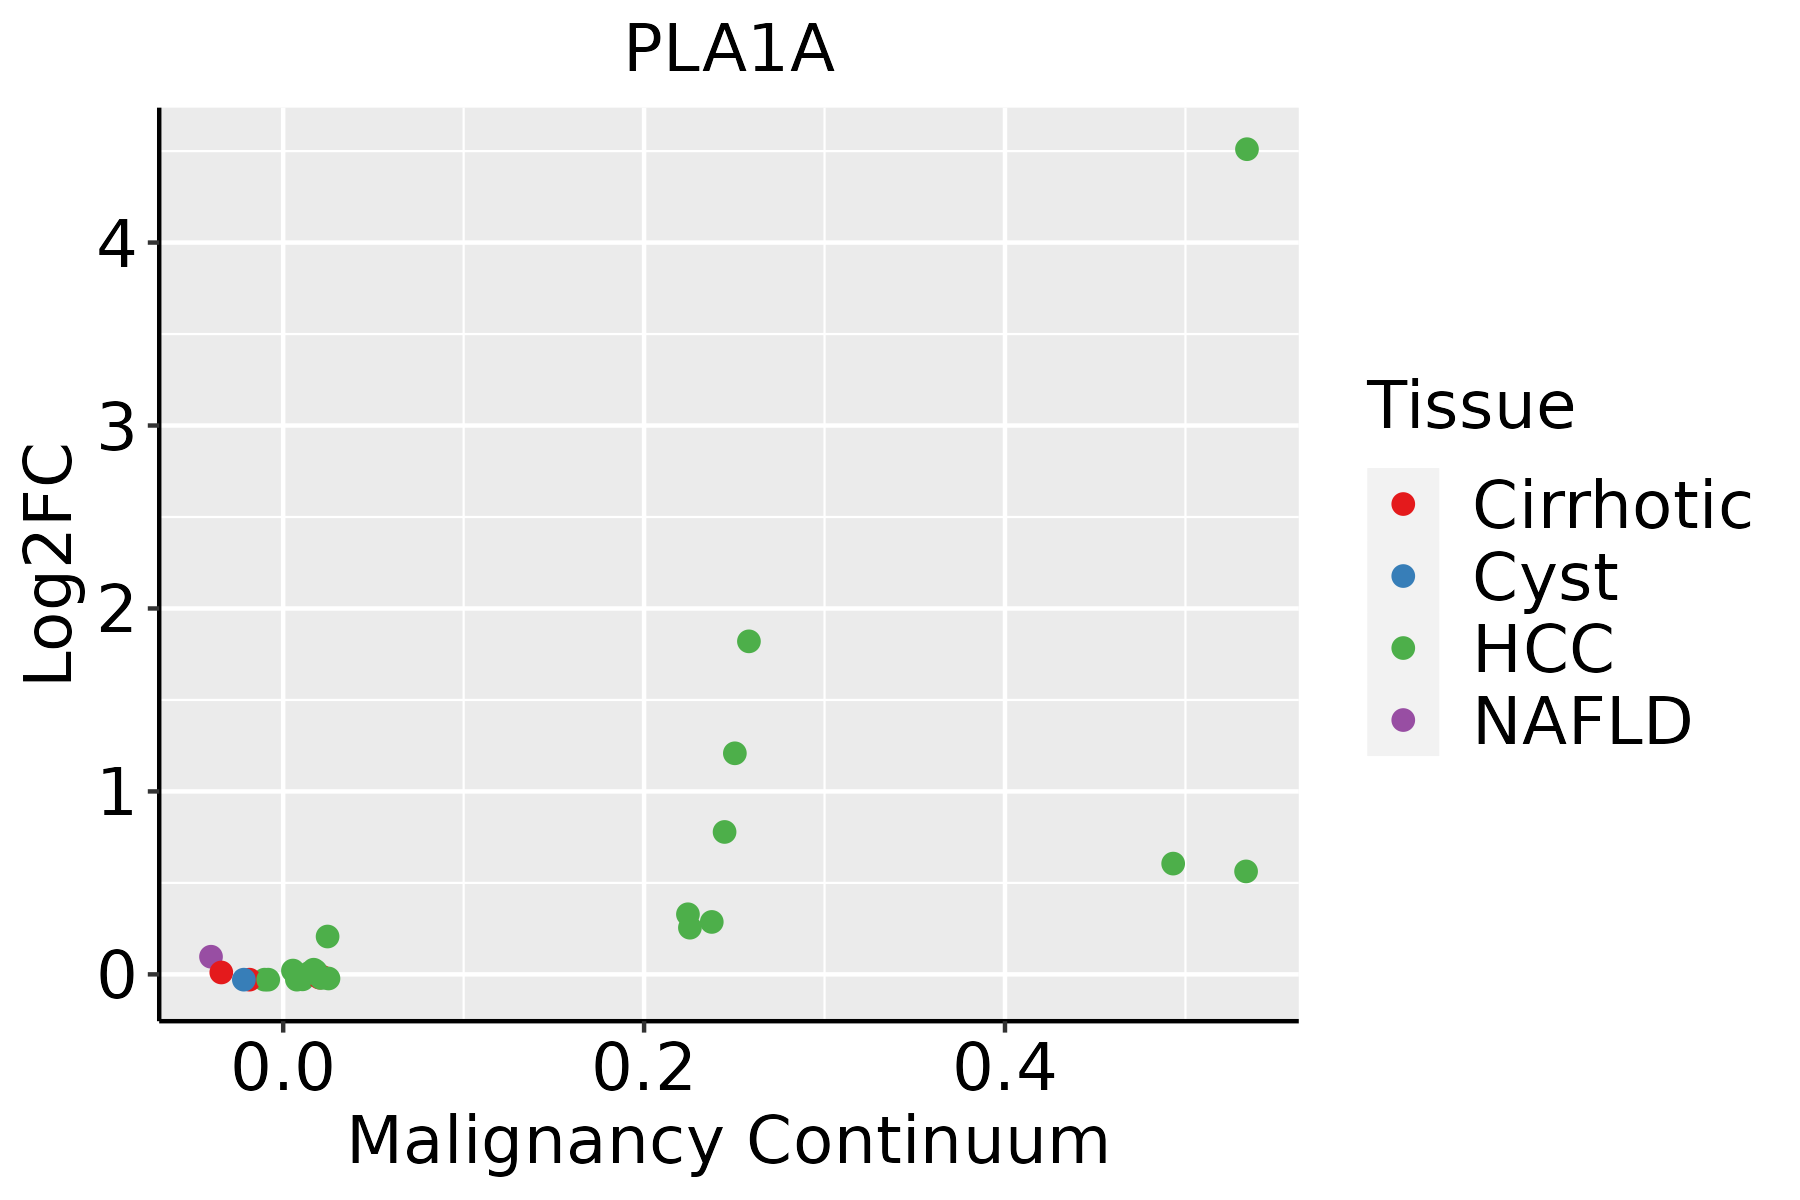 | HCC: Hepatocellular carcinoma |
| NAFLD: Non-alcoholic fatty liver disease |
| ∗log2FC in expression of this searched gene in stem-like cells from each diseased tissue sample relative to stem-like cells in normal samples in each tissue plotted against the malignancy continuum. Samples are colored based on if they are from different disease stage. |
Top |
Malignant transformation related pathway analysis |
| Find out the enriched GO biological processes and KEGG pathways involved in transition from healthy to precancer to cancer |
| Tissue | Disease Stage | Enriched GO biological Processes |
| Colorectum | AD |  |
| Colorectum | SER |  |
| Colorectum | MSS |  |
| Colorectum | MSI-H |  |
| Colorectum | FAP |  |
| ∗Top 15 enriched GO BP terms are showed in the bar plot of each disease state in each tissue. Each row represents a significant GO biological process which is colored according to the -log10(p.adjust). |
| Page: 1 2 3 4 5 6 7 8 9 |
| GO ID | Tissue | Disease Stage | Description | Gene Ratio | Bg Ratio | pvalue | p.adjust | Count |
| GO:000657521 | Liver | HCC | cellular modified amino acid metabolic process | 119/7958 | 188/18723 | 6.47e-09 | 1.67e-07 | 119 |
| GO:00066444 | Liver | HCC | phospholipid metabolic process | 214/7958 | 383/18723 | 7.25e-08 | 1.48e-06 | 214 |
| GO:004648611 | Liver | HCC | glycerolipid metabolic process | 215/7958 | 392/18723 | 4.54e-07 | 7.49e-06 | 215 |
| GO:001604221 | Liver | HCC | lipid catabolic process | 175/7958 | 320/18723 | 6.50e-06 | 7.88e-05 | 175 |
| GO:00066504 | Liver | HCC | glycerophospholipid metabolic process | 168/7958 | 306/18723 | 7.27e-06 | 8.62e-05 | 168 |
| Page: 1 |
| Pathway ID | Tissue | Disease Stage | Description | Gene Ratio | Bg Ratio | pvalue | p.adjust | qvalue | Count |
| Page: 1 |
Top |
Cell-cell communication analysis |
| Identification of potential cell-cell interactions between two cell types and their ligand-receptor pairs for different disease states |
| Ligand | Receptor | LRpair | Pathway | Tissue | Disease Stage |
| Page: 1 |
Top |
Single-cell gene regulatory network inference analysis |
| Find out the significant the regulons (TFs) and the target genes of each regulon across cell types for different disease states |
| TF | Cell Type | Tissue | Disease Stage | Target Gene | RSS | Regulon Activity |
| ∗The dot plots of a searched regulon are shown for all cell subpopulations in each disease state of each tissue based on the regulon specific score inferred using pySCENIC and by calculating the average expression. |
| Page: 1 |
Top |
Somatic mutation of malignant transformation related genes |
| Annotation of somatic variants for genes involved in malignant transformation |
| Hugo Symbol | Variant Class | Variant Classification | dbSNP RS | HGVSc | HGVSp | HGVSp Short | SWISSPROT | BIOTYPE | SIFT | PolyPhen | Tumor Sample Barcode | Tissue | Histology | Sex | Age | Stage | Therapy Types | Drugs | Outcome |
| PLA1A | SNV | Missense_Mutation | c.248N>C | p.Gly83Ala | p.G83A | Q53H76 | protein_coding | tolerated(0.24) | possibly_damaging(0.497) | TCGA-AC-A23H-01 | Breast | breast invasive carcinoma | Female | >=65 | I/II | Unknown | Unknown | PD | |
| PLA1A | SNV | Missense_Mutation | rs754783654 | c.583N>A | p.Glu195Lys | p.E195K | Q53H76 | protein_coding | tolerated(0.89) | benign(0.063) | TCGA-AC-A23H-01 | Breast | breast invasive carcinoma | Female | >=65 | I/II | Unknown | Unknown | PD |
| PLA1A | SNV | Missense_Mutation | c.433N>T | p.Leu145Phe | p.L145F | Q53H76 | protein_coding | tolerated(0.32) | benign(0.009) | TCGA-AR-A1AK-01 | Breast | breast invasive carcinoma | Female | >=65 | I/II | Hormone Therapy | anastrozole | SD | |
| PLA1A | SNV | Missense_Mutation | novel | c.1348N>A | p.Asp450Asn | p.D450N | Q53H76 | protein_coding | tolerated(0.14) | benign(0.001) | TCGA-E2-A14V-01 | Breast | breast invasive carcinoma | Female | <65 | I/II | Chemotherapy | cyclophosphamide | SD |
| PLA1A | deletion | Frame_Shift_Del | c.1071_1083delNNNNNNNNNNNNN | p.Glu358LeufsTer24 | p.E358Lfs*24 | Q53H76 | protein_coding | TCGA-A8-A08F-01 | Breast | breast invasive carcinoma | Female | <65 | III/IV | Chemotherapy | 5-fluorouracil | CR | |||
| PLA1A | insertion | Frame_Shift_Ins | novel | c.1079_1080insGAATATGT | p.Phe361AsnfsTer28 | p.F361Nfs*28 | Q53H76 | protein_coding | TCGA-A8-A09M-01 | Breast | breast invasive carcinoma | Female | >=65 | III/IV | Chemotherapy | paclitaxel | CR | ||
| PLA1A | insertion | Nonsense_Mutation | novel | c.1080_1081insAGCAAACAAGGGGAAGTAAAACATTAGTA | p.Phe361SerfsTer9 | p.F361Sfs*9 | Q53H76 | protein_coding | TCGA-A8-A09M-01 | Breast | breast invasive carcinoma | Female | >=65 | III/IV | Chemotherapy | paclitaxel | CR | ||
| PLA1A | insertion | Nonsense_Mutation | novel | c.249_250insGTTCAAGCCACAGGCTGAAGAGCTTAGGGCCGGCACTCTC | p.Thr84ValfsTer6 | p.T84Vfs*6 | Q53H76 | protein_coding | TCGA-AO-A0JB-01 | Breast | breast invasive carcinoma | Female | <65 | III/IV | Chemotherapy | cyclophosphamide | SD | ||
| PLA1A | SNV | Missense_Mutation | novel | c.655G>T | p.Asp219Tyr | p.D219Y | Q53H76 | protein_coding | deleterious(0) | probably_damaging(1) | TCGA-2W-A8YY-01 | Cervix | cervical & endocervical cancer | Female | <65 | I/II | Chemotherapy | cisplatin | CR |
| PLA1A | SNV | Missense_Mutation | c.1052N>C | p.Arg351Thr | p.R351T | Q53H76 | protein_coding | tolerated(0.07) | benign(0.091) | TCGA-C5-A1M6-01 | Cervix | cervical & endocervical cancer | Female | <65 | I/II | Chemotherapy | cisplatin | PD |
| Page: 1 2 3 4 5 6 7 |
Top |
Related drugs of malignant transformation related genes |
| Identification of chemicals and drugs interact with genes involved in malignant transfromation |
| (DGIdb 4.0) |
| Entrez ID | Symbol | Category | Interaction Types | Drug Claim Name | Drug Name | PMIDs |
| Page: 1 |

Copyright 2023-Present -The University of Texas Health Science Center at Houston |