Schematic overview of the cellular and molecular mechanisms involved in the cancer progression, including the proposed cellular and molecular mechanisms in cancer cells trajectory. AT1: alveolar type 1 cells; AT2: alveolar type 2 cells; AAH: atypical adenomatous hyperplasia; AIS: adenocarcinoma in situ; MIA: minimally invasive adenocarcinoma; IA: invasive adenocarcinoma; EMT: epithelial-mesenchymal transition

Home

Download

Statistics

Help

Contact

Center for Computational Systems Medicine
leaf

Gene summary

leaf

Malignant transformation analysis

leaf

Malignant transformation related pathway analysis

leaf

Cell-cell communication analysis

leaf

Single-cell gene regulatory network inference analysis

leaf

Somatic mutation of malignant transformation related genes

leaf

Related drugs of malignant transformation related genes

Gene: PKP4

Gene summary for PKP4

check button Gene summary.

Gene informationSpeciesHuman
Gene symbol

PKP4

Gene ID

8502

Gene nameplakophilin 4
Gene Aliasp0071
Cytomap2q24.1
Gene Typeprotein-coding
GO ID

GO:0000910

UniProtAcc

Q99569


Top

Malignant transformation analysis

check button Identification of the aberrant gene expression in precancerous and cancerous lesions by comparing the gene expression of stem-like cells in diseased tissues with normal stem cells
check button Malignant transformation involving gene list.
Entrez IDSymbolReplicatesSpeciesOrganTissueAdj P-valueLog2FCMalignancy
8502PKP4CA_HPV_1HumanCervixCC5.56e-04-1.78e-010.0264
8502PKP4CCI_1HumanCervixCC2.79e-091.12e+000.528
8502PKP4CCI_2HumanCervixCC1.89e-121.48e+000.5249
8502PKP4CCI_3HumanCervixCC8.04e-141.22e+000.516
8502PKP4HTA11_3410_2000001011HumanColorectumAD3.02e-10-4.88e-010.0155
8502PKP4HTA11_83_2000001011HumanColorectumSER1.16e-03-2.54e-01-0.1526
8502PKP4HTA11_866_3004761011HumanColorectumAD2.83e-02-3.74e-010.096
8502PKP4HTA11_99999973899_84307HumanColorectumMSS3.98e-03-5.09e-010.2585
8502PKP4A015-C-203HumanColorectumFAP1.17e-28-5.08e-01-0.1294
8502PKP4A015-C-204HumanColorectumFAP3.19e-06-2.40e-01-0.0228
8502PKP4A014-C-040HumanColorectumFAP4.47e-07-5.82e-01-0.1184
8502PKP4A002-C-201HumanColorectumFAP1.24e-13-3.03e-010.0324
8502PKP4A001-C-119HumanColorectumFAP1.61e-07-4.21e-01-0.1557
8502PKP4A001-C-108HumanColorectumFAP9.67e-12-7.68e-02-0.0272
8502PKP4A002-C-205HumanColorectumFAP5.11e-26-5.17e-01-0.1236
8502PKP4A015-C-006HumanColorectumFAP8.31e-16-7.29e-02-0.0994
8502PKP4A015-C-106HumanColorectumFAP7.24e-10-1.73e-01-0.0511
8502PKP4A002-C-114HumanColorectumFAP1.14e-18-3.54e-01-0.1561
8502PKP4A015-C-104HumanColorectumFAP3.22e-28-4.72e-01-0.1899
8502PKP4A001-C-014HumanColorectumFAP6.62e-08-1.84e-010.0135
Page: 1 2 3 4 5 6 7 8 9 10 

check button Transcriptomic changes along malignancy continuum.
TissueExpression DynamicsAbbreviation
CervixThe image shows the transcriptomic changes along malignancy continuum.log2FC in expression of this searched gene in stem-like cells from each diseased tissue sample relative to stem-like cells in normal samples in each tissue plotted against the malignancy continuum. Samples are colored based on if they are from different disease stage.CC: Cervix cancer
HSIL_HPV: HPV-infected high-grade squamous intraepithelial lesions
N_HPV: HPV-infected normal cervix
Colorectum (GSE201348)The image shows the transcriptomic changes along malignancy continuum.log2FC in expression of this searched gene in stem-like cells from each diseased tissue sample relative to stem-like cells in normal samples in each tissue plotted against the malignancy continuum. Samples are colored based on if they are from different disease stage.FAP: Familial adenomatous polyposis
CRC: Colorectal cancer
Colorectum (HTA11)The image shows the transcriptomic changes along malignancy continuum.log2FC in expression of this searched gene in stem-like cells from each diseased tissue sample relative to stem-like cells in normal samples in each tissue plotted against the malignancy continuum. Samples are colored based on if they are from different disease stage.AD: Adenomas
SER: Sessile serrated lesions
MSI-H: Microsatellite-high colorectal cancer
MSS: Microsatellite stable colorectal cancer
EndometriumThe image shows the transcriptomic changes along malignancy continuum.log2FC in expression of this searched gene in stem-like cells from each diseased tissue sample relative to stem-like cells in normal samples in each tissue plotted against the malignancy continuum. Samples are colored based on if they are from different disease stage.
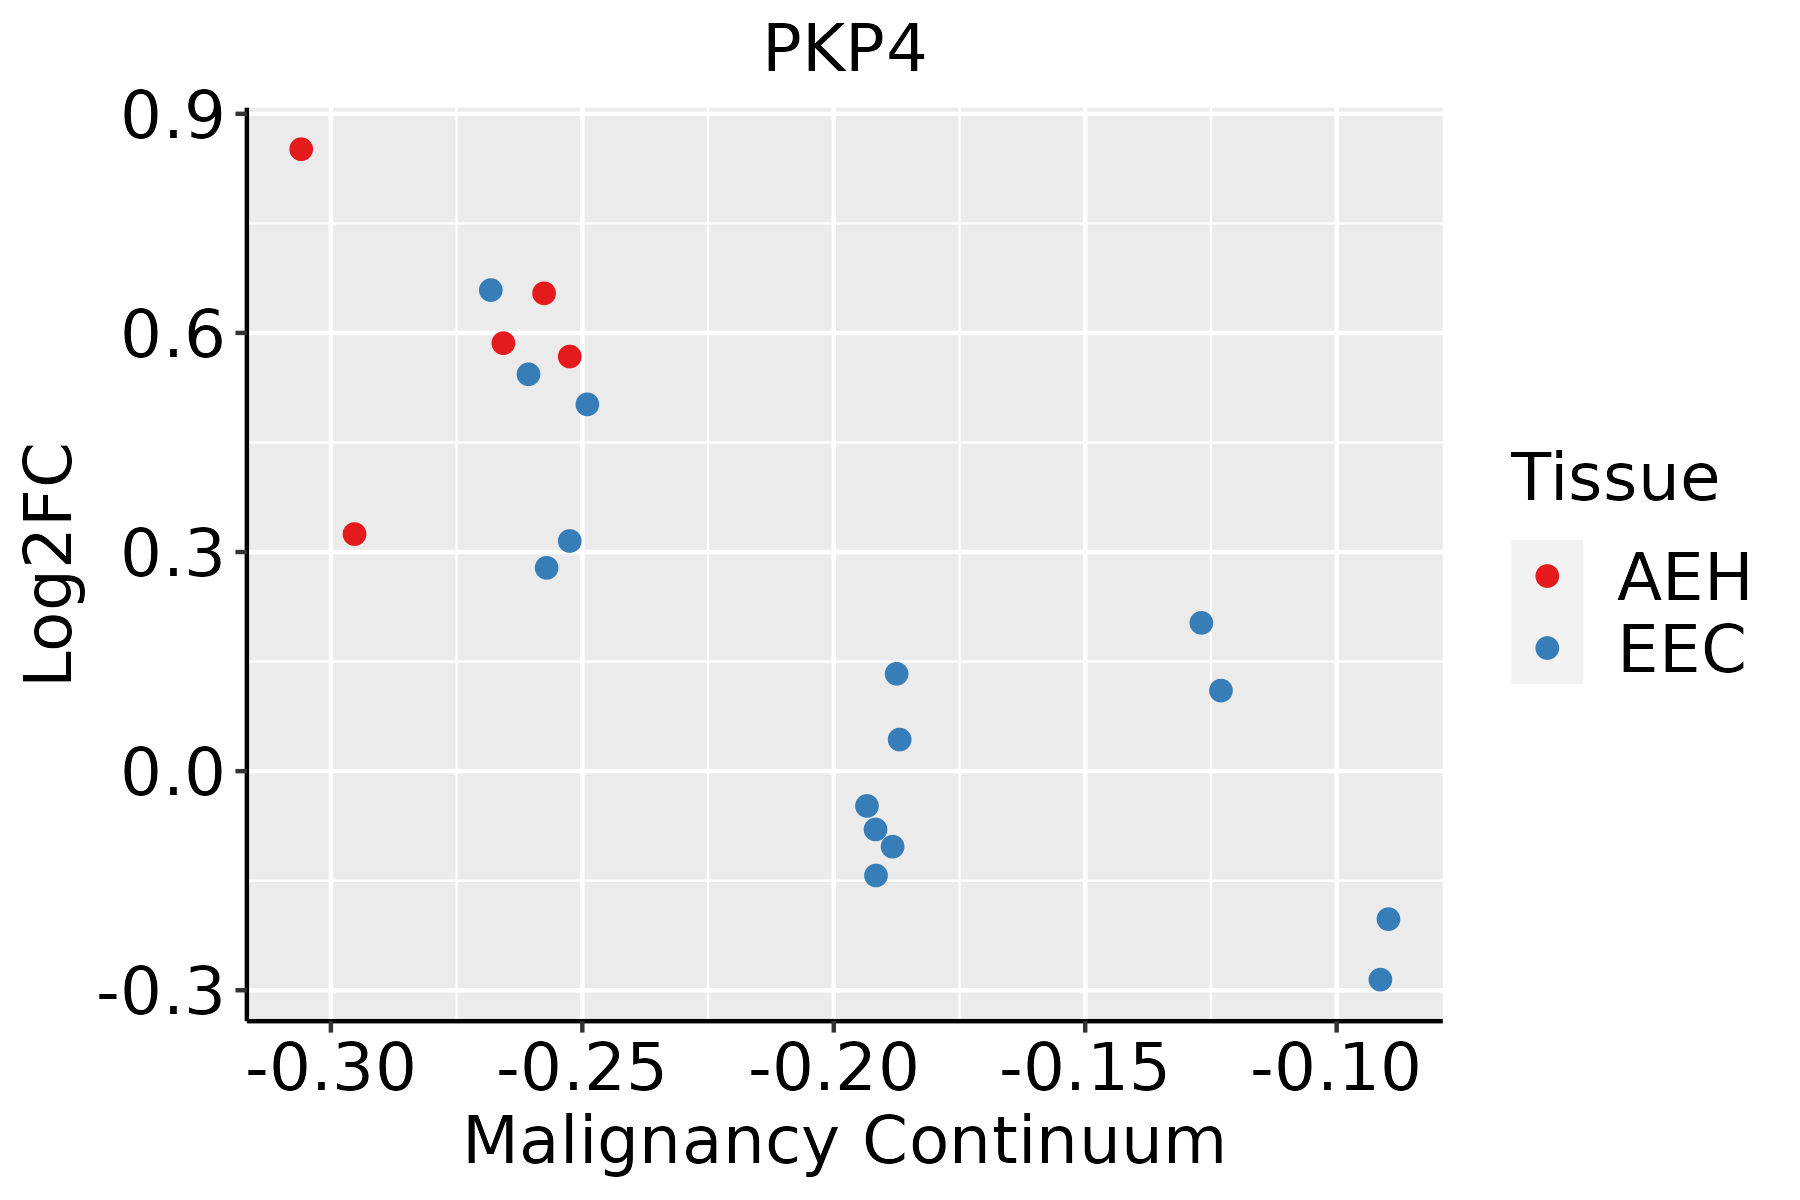
AEH: Atypical endometrial hyperplasia
EEC: Endometrioid Cancer
EsophagusThe image shows the transcriptomic changes along malignancy continuum.log2FC in expression of this searched gene in stem-like cells from each diseased tissue sample relative to stem-like cells in normal samples in each tissue plotted against the malignancy continuum. Samples are colored based on if they are from different disease stage.
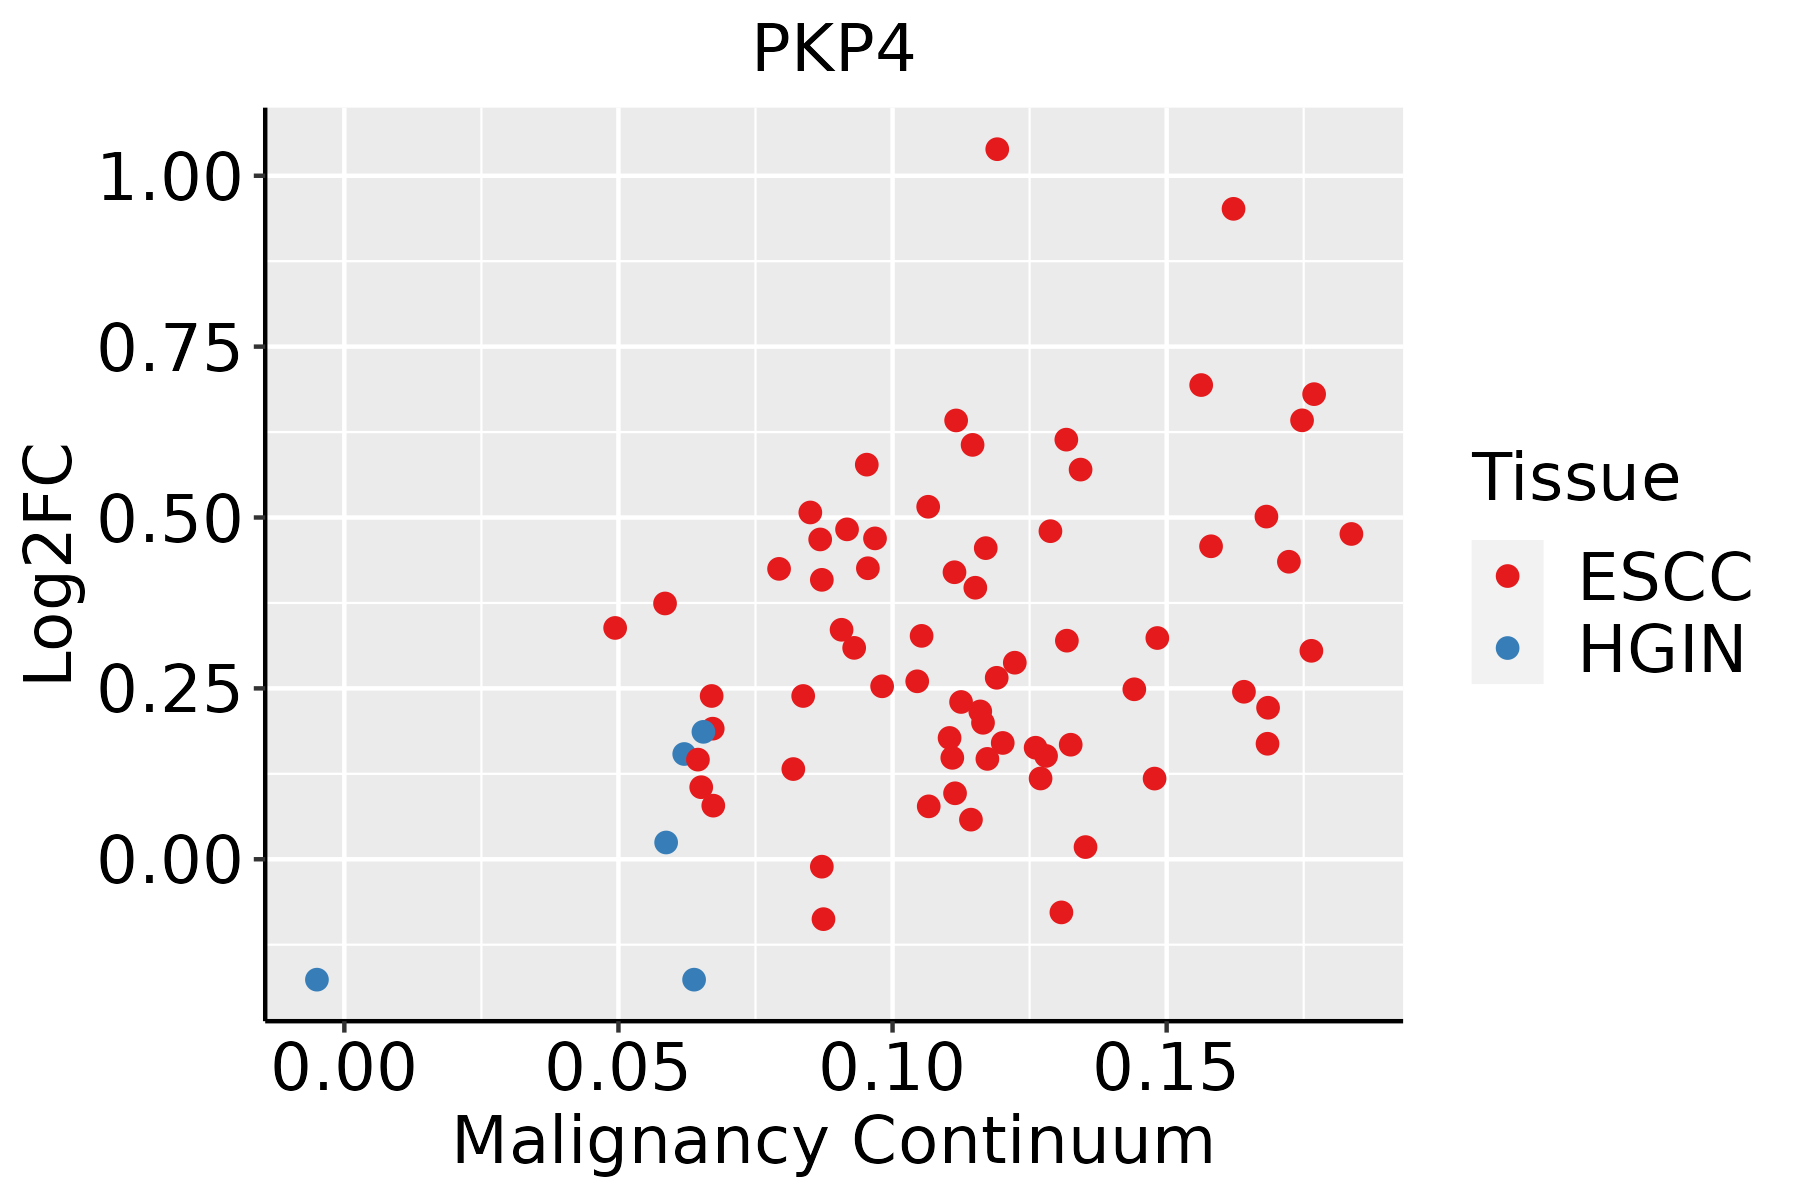
ESCC: Esophageal squamous cell carcinoma
HGIN: High-grade intraepithelial neoplasias
LGIN: Low-grade intraepithelial neoplasias
LiverThe image shows the transcriptomic changes along malignancy continuum.log2FC in expression of this searched gene in stem-like cells from each diseased tissue sample relative to stem-like cells in normal samples in each tissue plotted against the malignancy continuum. Samples are colored based on if they are from different disease stage.
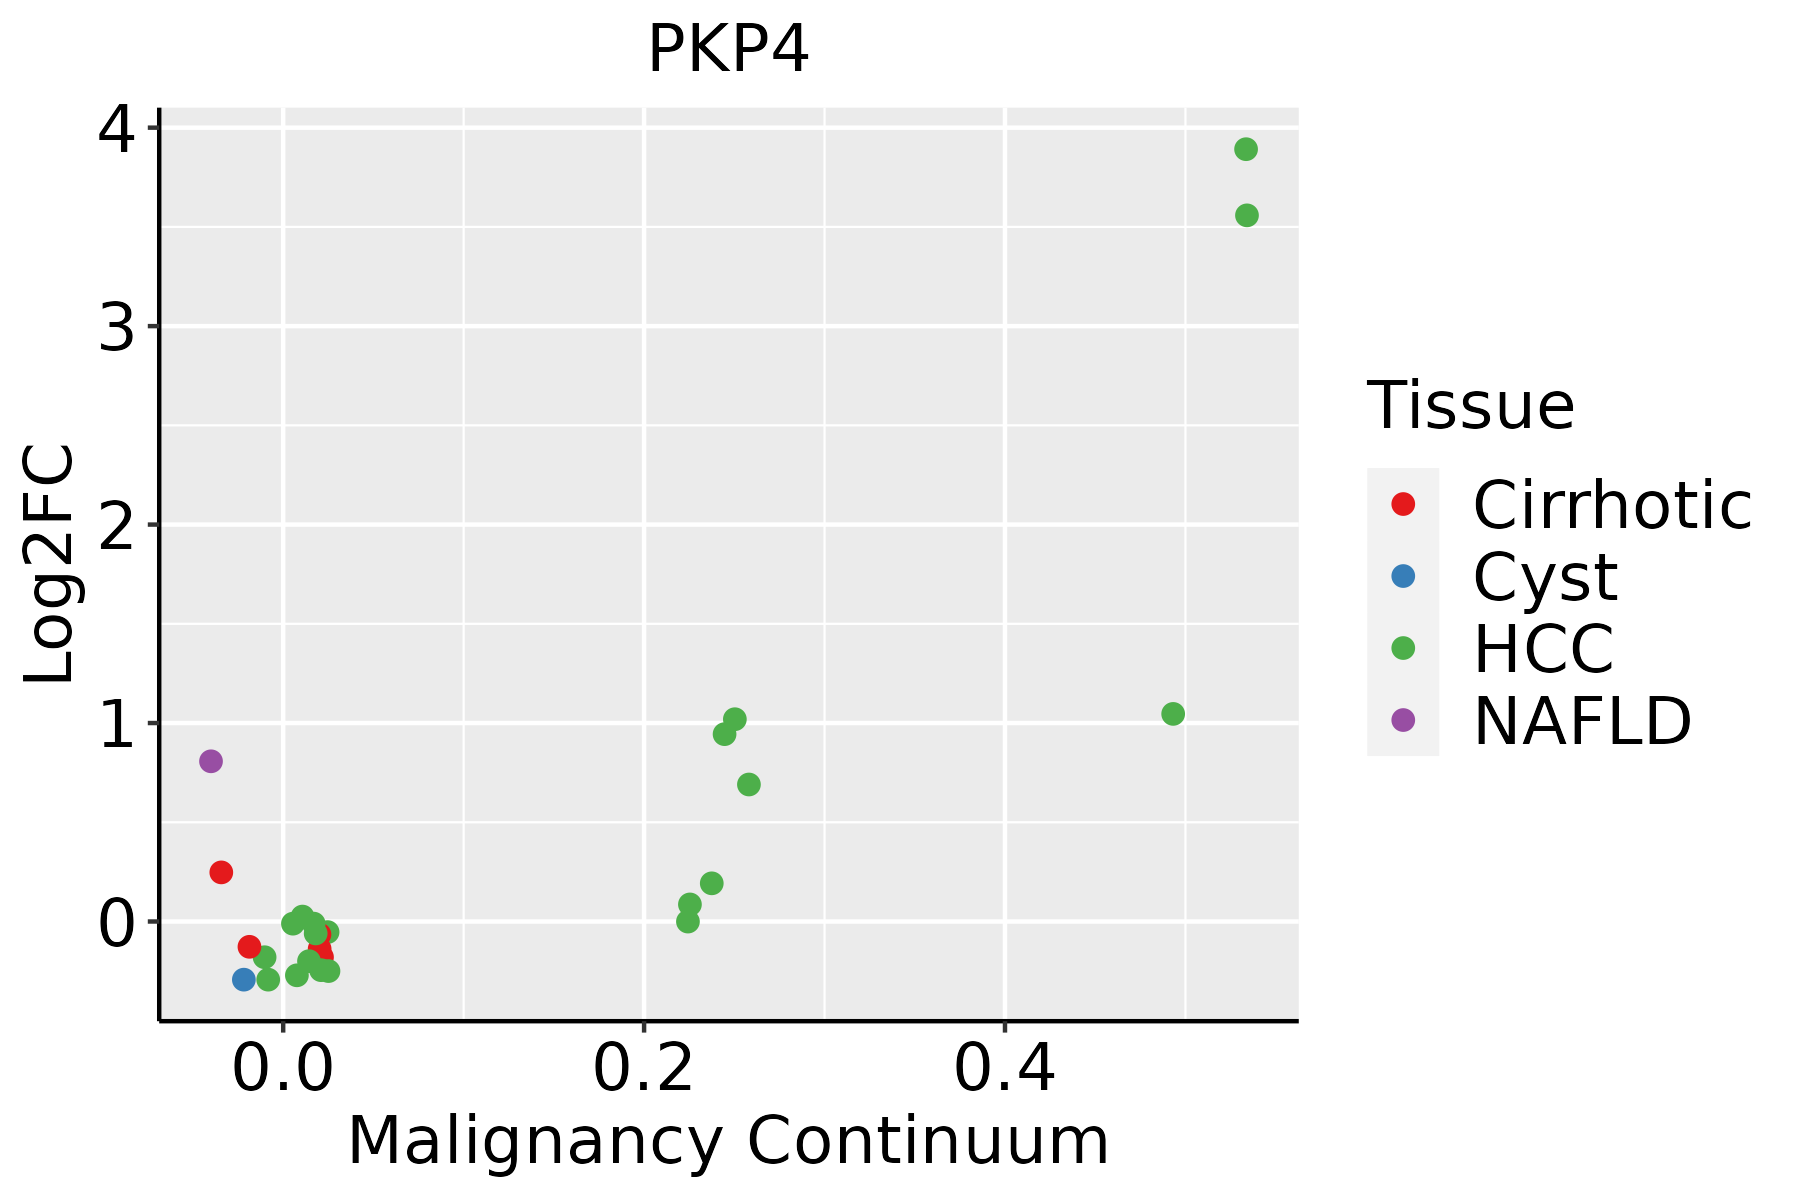
HCC: Hepatocellular carcinoma
NAFLD: Non-alcoholic fatty liver disease
LungThe image shows the transcriptomic changes along malignancy continuum.log2FC in expression of this searched gene in stem-like cells from each diseased tissue sample relative to stem-like cells in normal samples in each tissue plotted against the malignancy continuum. Samples are colored based on if they are from different disease stage.
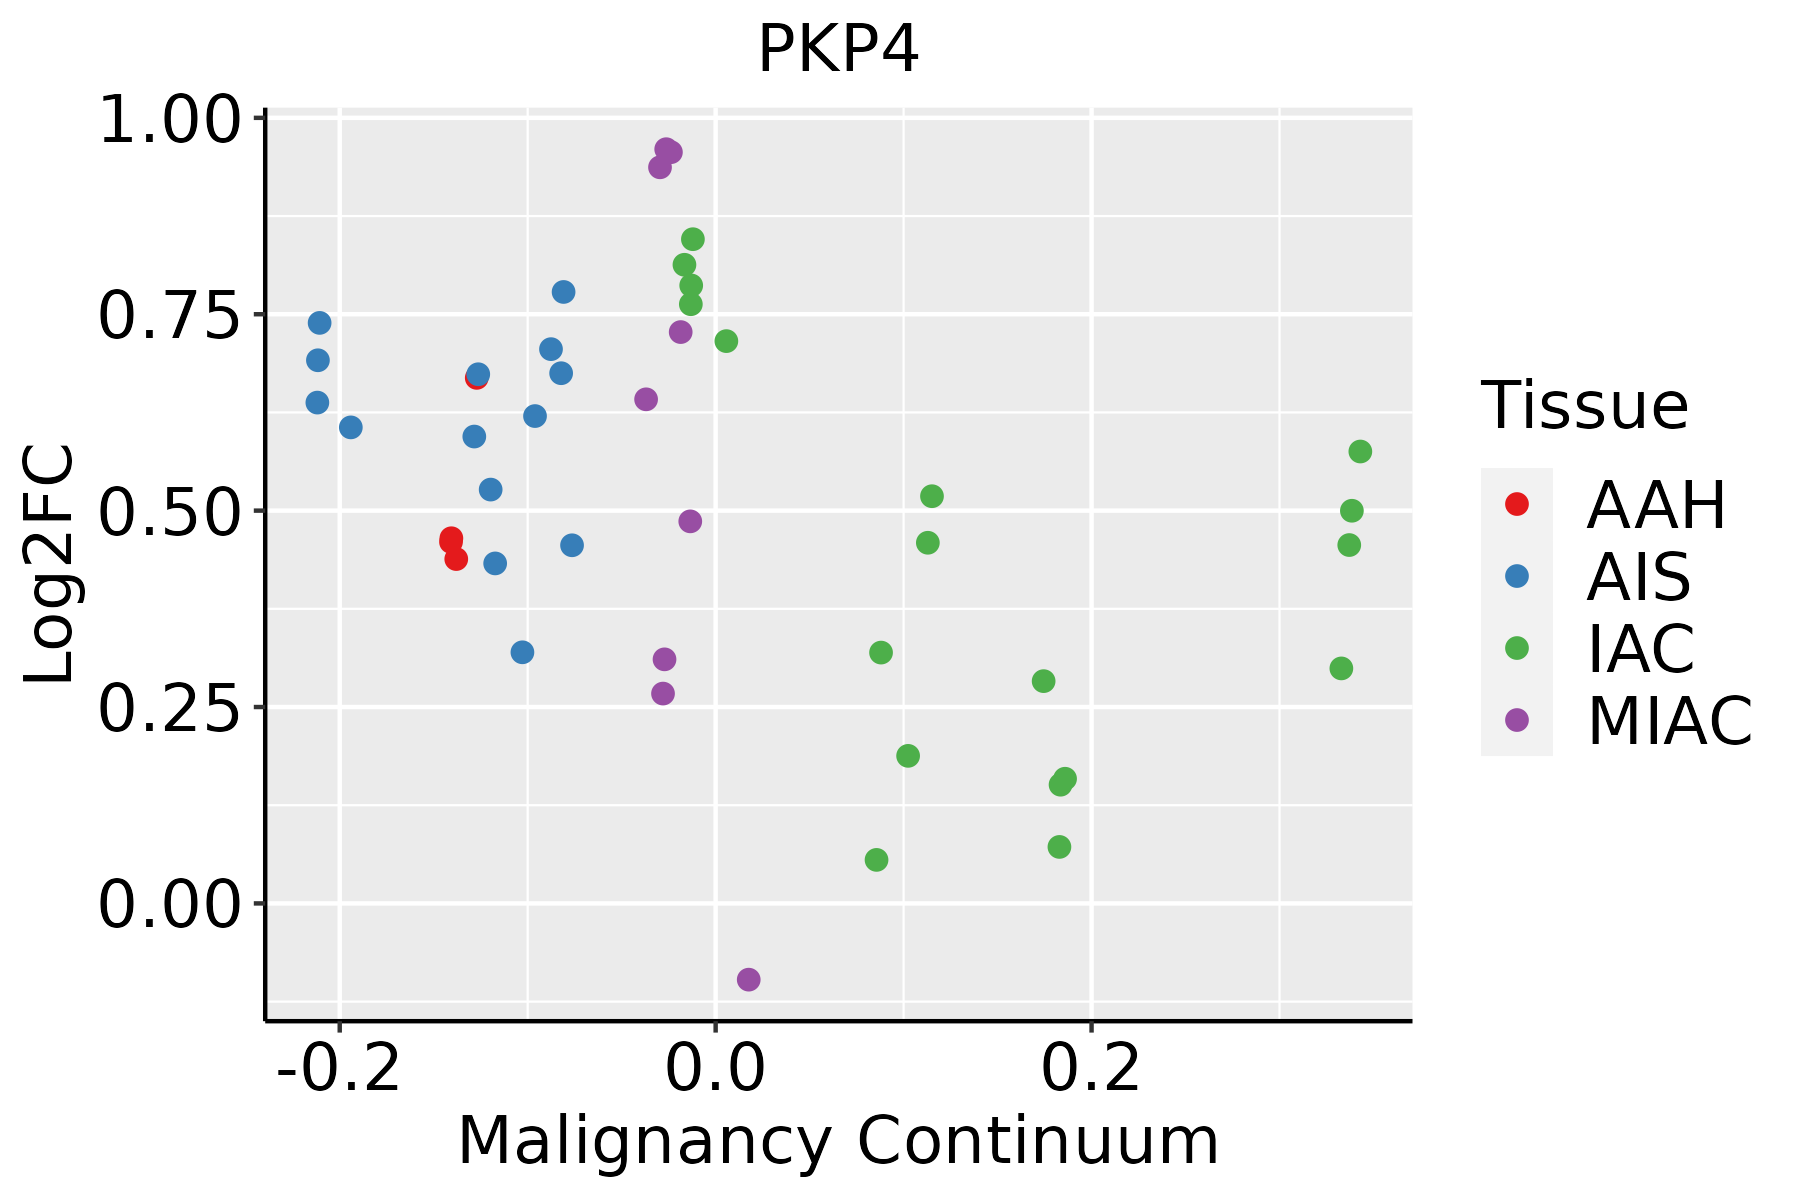
AAH: Atypical adenomatous hyperplasia
AIS: Adenocarcinoma in situ
IAC: Invasive lung adenocarcinoma
MIA: Minimally invasive adenocarcinoma
ProstateThe image shows the transcriptomic changes along malignancy continuum.log2FC in expression of this searched gene in stem-like cells from each diseased tissue sample relative to stem-like cells in normal samples in each tissue plotted against the malignancy continuum. Samples are colored based on if they are from different disease stage.
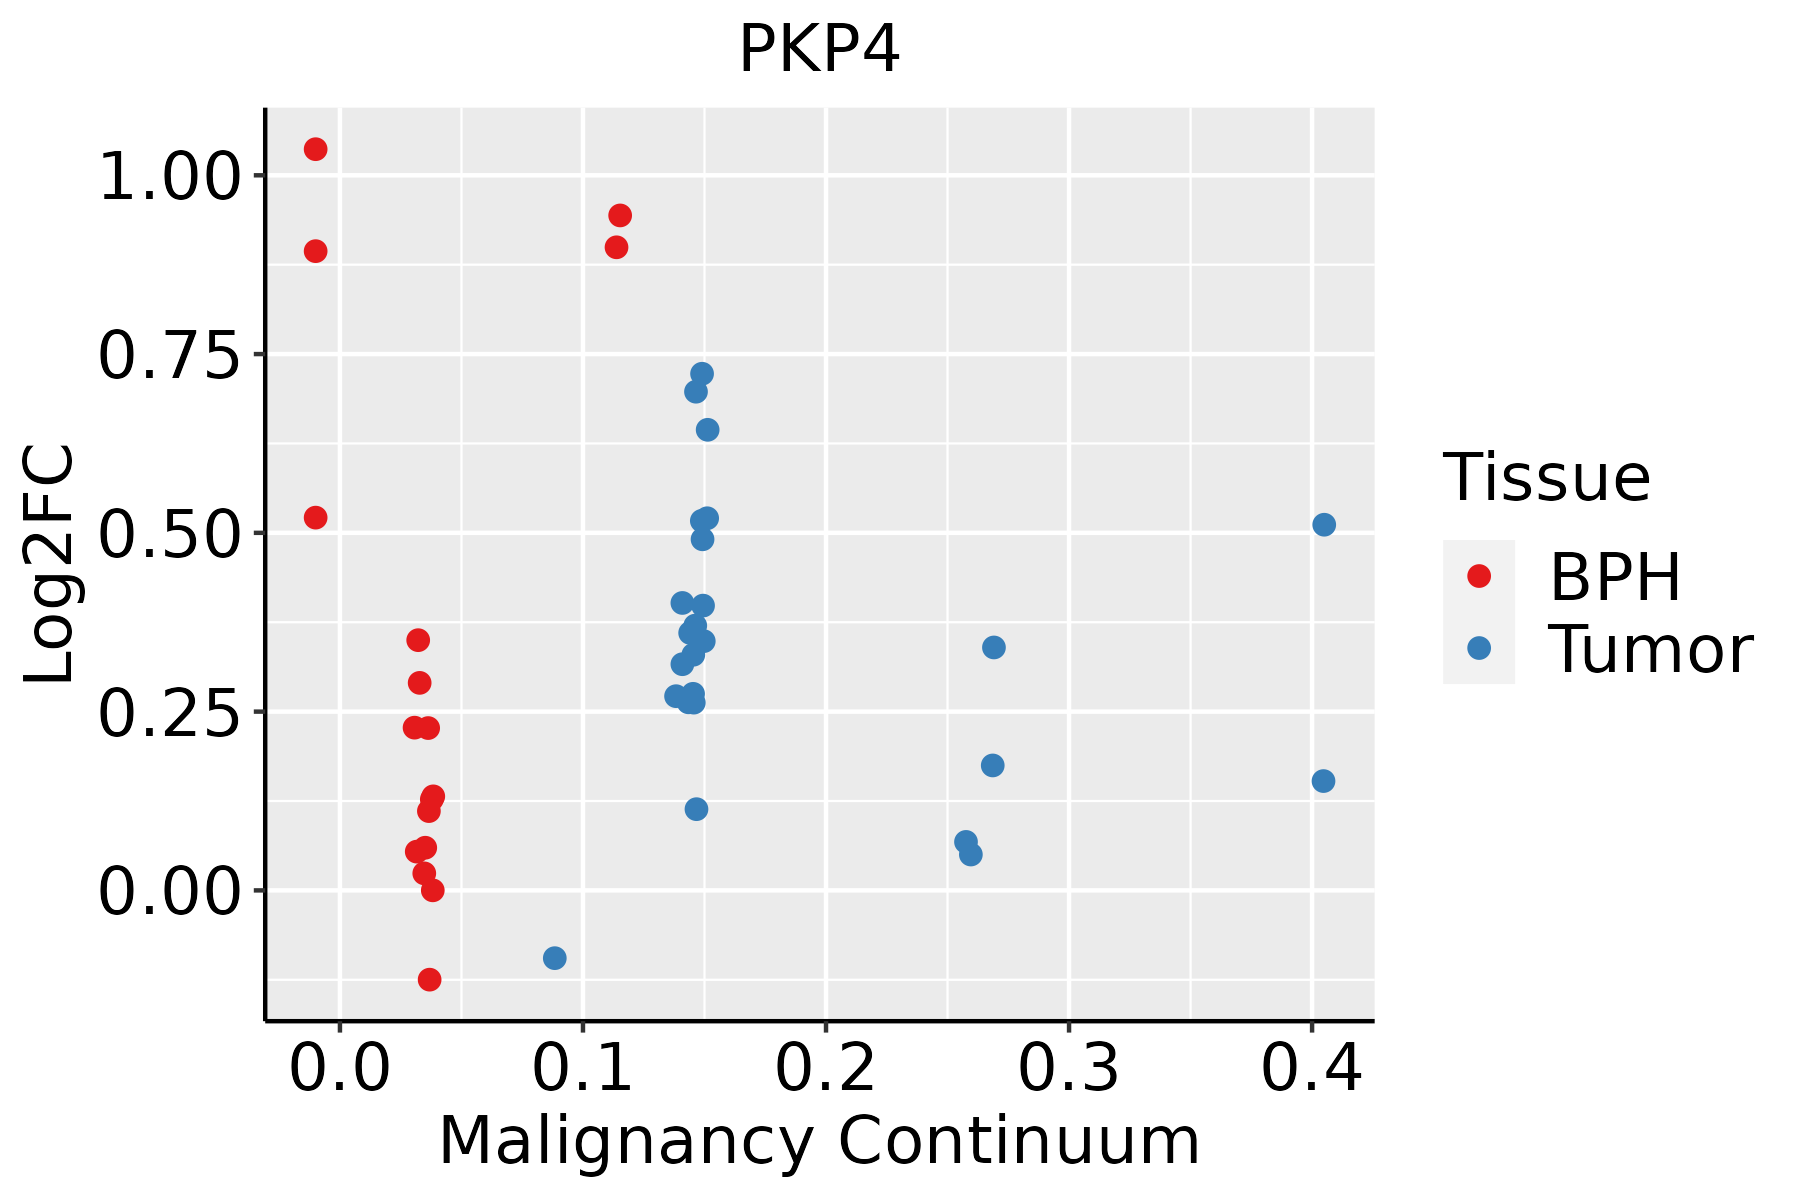
BPH: Benign Prostatic Hyperplasia
SkinThe image shows the transcriptomic changes along malignancy continuum.log2FC in expression of this searched gene in stem-like cells from each diseased tissue sample relative to stem-like cells in normal samples in each tissue plotted against the malignancy continuum. Samples are colored based on if they are from different disease stage.
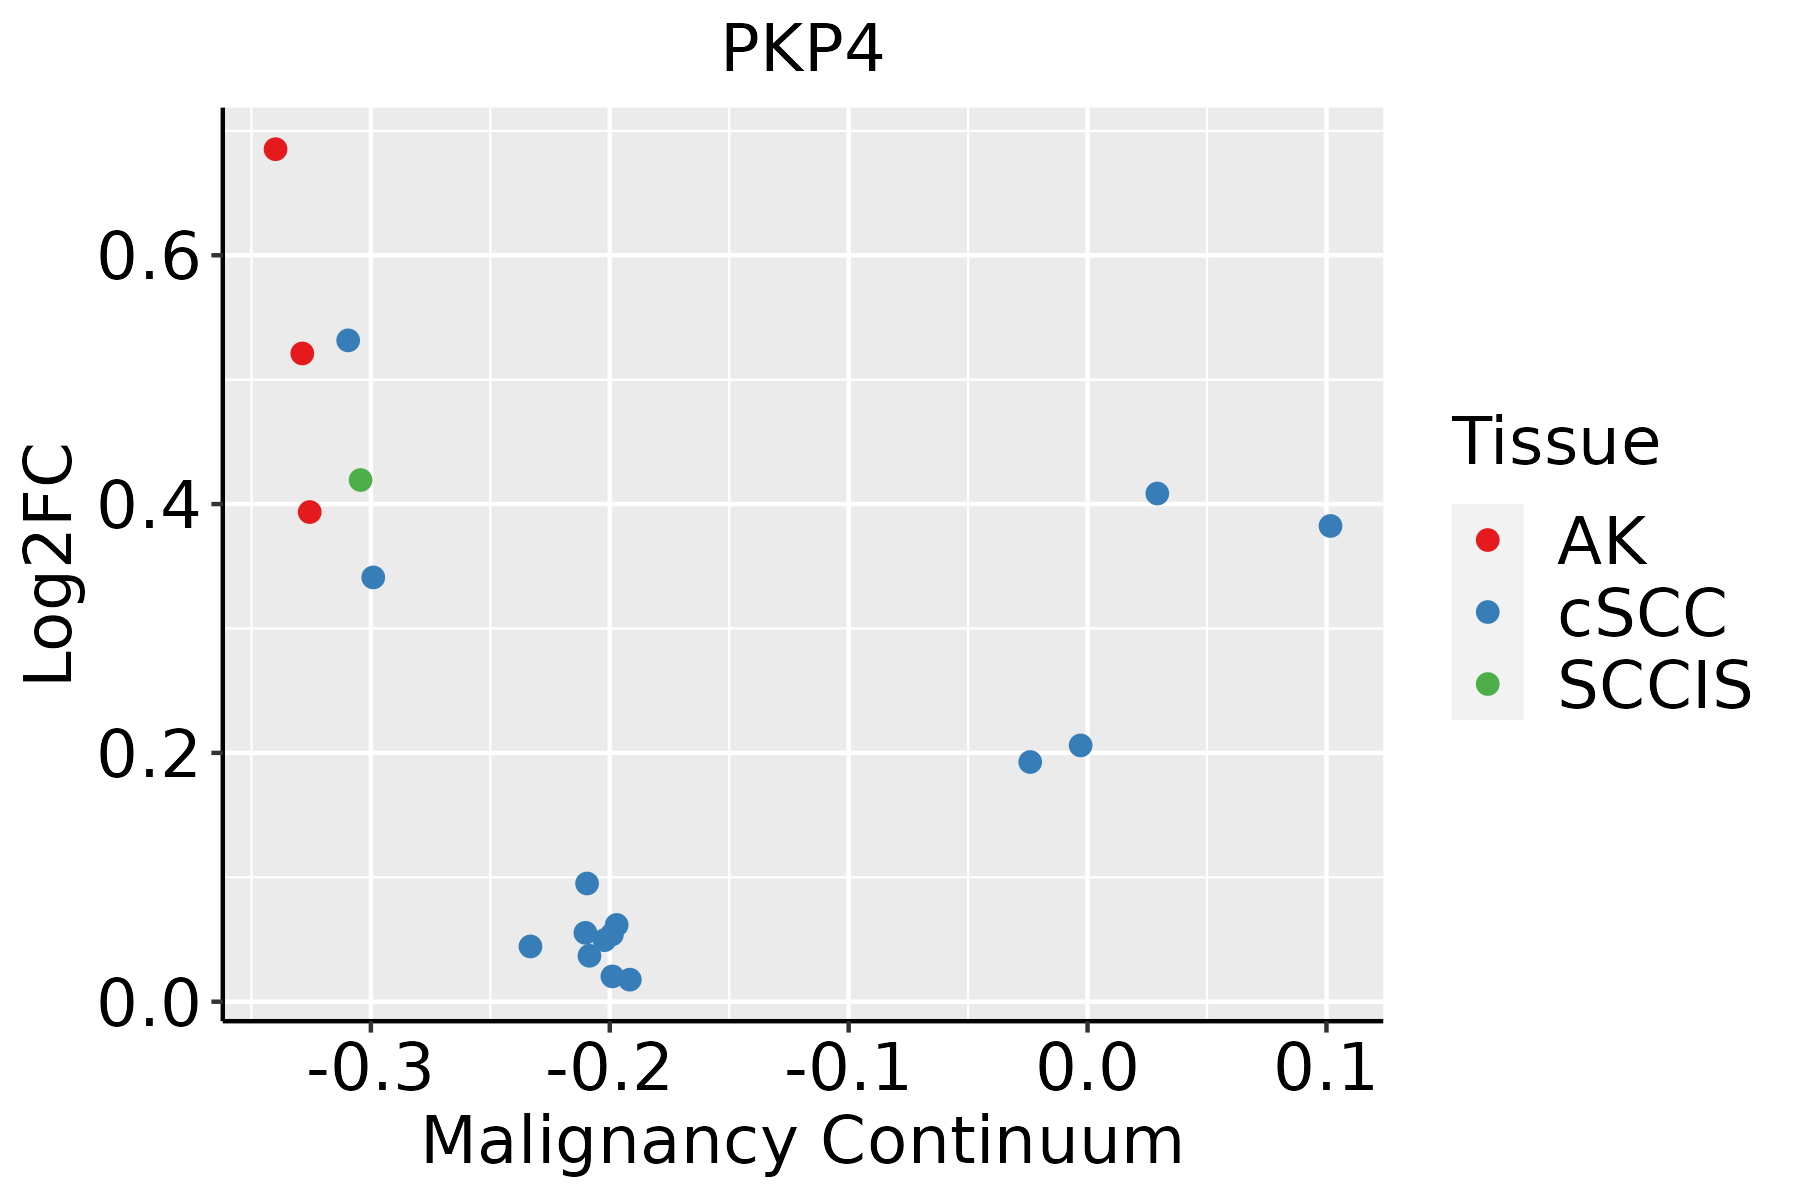
AK: Actinic keratosis
cSCC: Cutaneous squamous cell carcinoma
SCCIS:squamous cell carcinoma in situ
ThyroidThe image shows the transcriptomic changes along malignancy continuum.log2FC in expression of this searched gene in stem-like cells from each diseased tissue sample relative to stem-like cells in normal samples in each tissue plotted against the malignancy continuum. Samples are colored based on if they are from different disease stage.
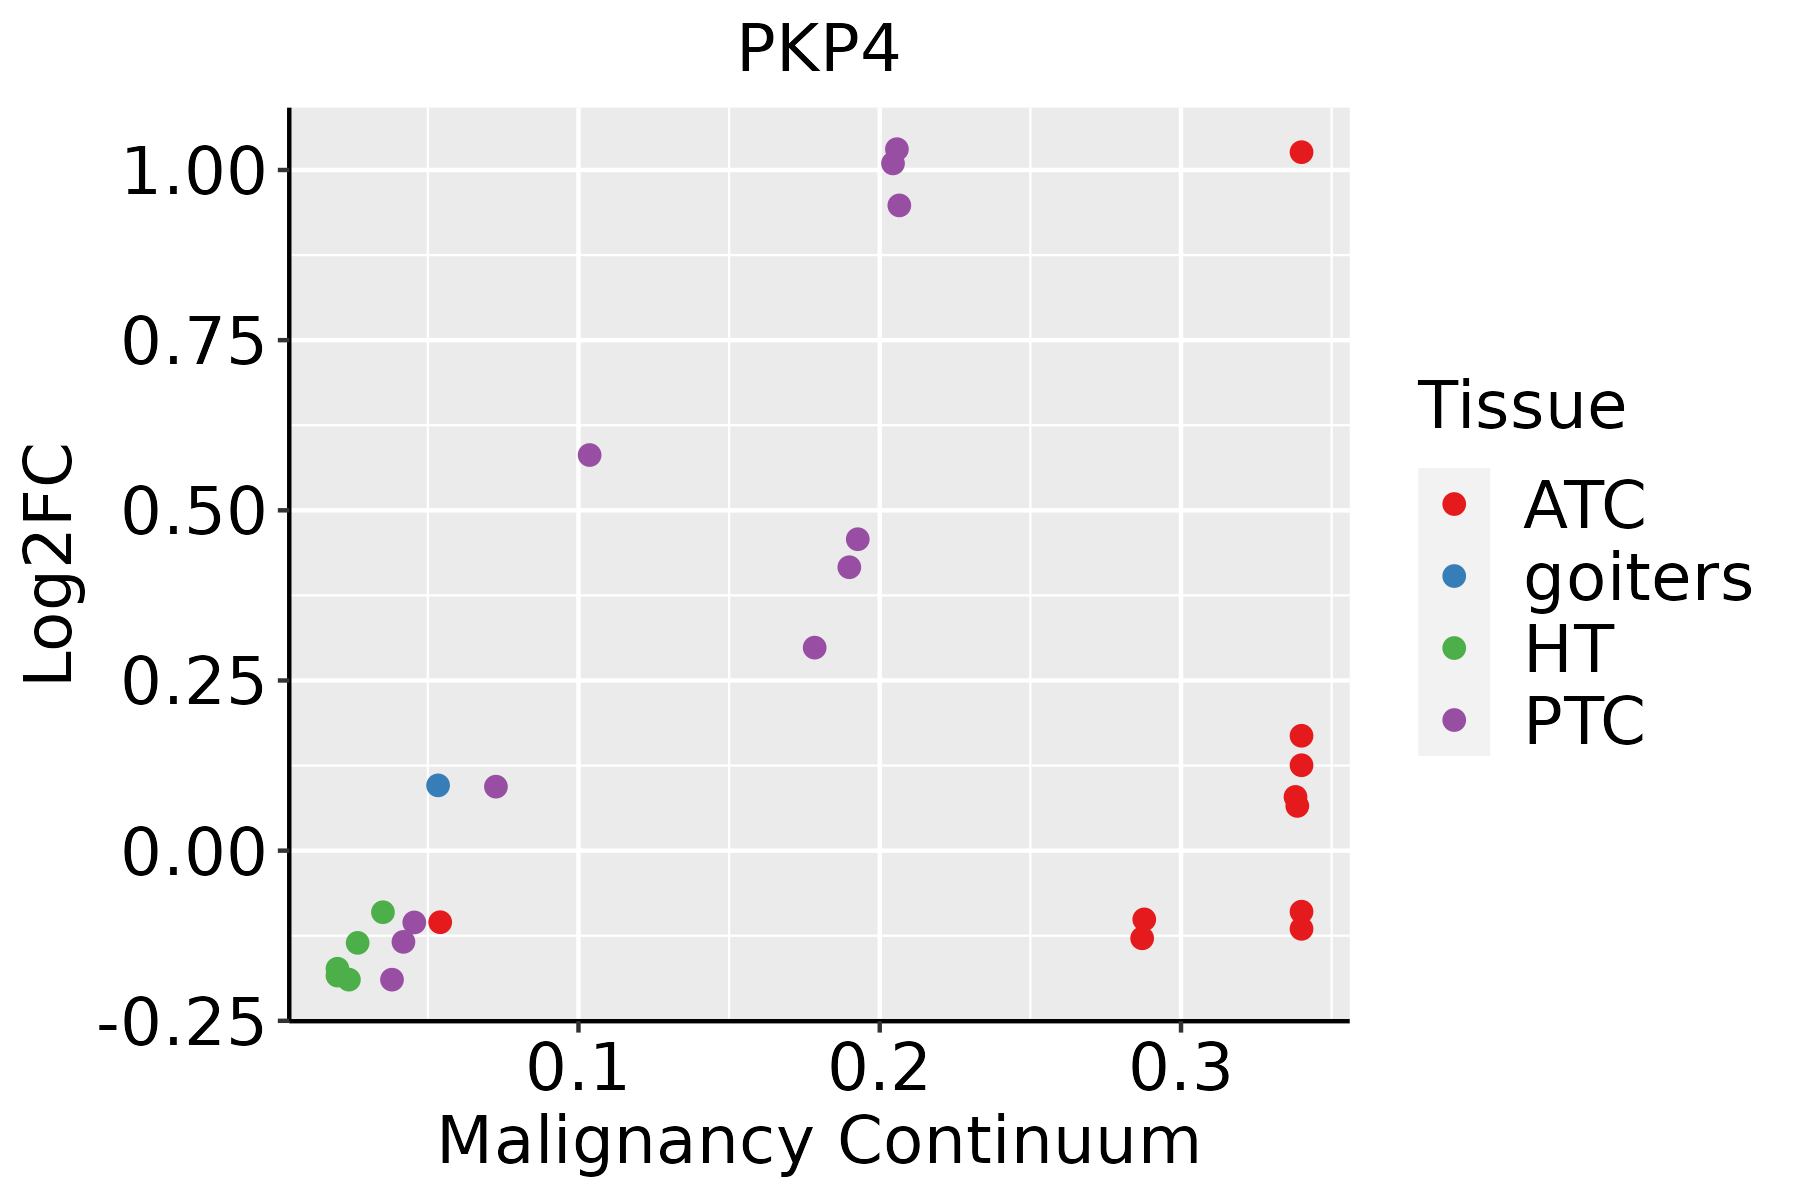
ATC: Anaplastic thyroid cancer
HT: Hashimoto's thyroiditis
PTC: Papillary thyroid cancer
∗log2FC in expression of this searched gene in stem-like cells from each diseased tissue sample relative to stem-like cells in normal samples in each tissue plotted against the malignancy continuum. Samples are colored based on if they are from different disease stage.

Top

Malignant transformation related pathway analysis

check buttonFind out the enriched GO biological processes and KEGG pathways involved in transition from healthy to precancer to cancer
check button Figure of enriched GO biological processes.
TissueDisease StageEnriched GO biological Processes
ColorectumADGO analysis - Figure of enriched GO biological processes: Top 15 enriched GO BP terms are showed in the bar plot of each disease state in each tissue. Each row represents a significant GO biological process which is colored according to the -log10(p.adjust).
ColorectumSERGO analysis - Figure of enriched GO biological processes: Top 15 enriched GO BP terms are showed in the bar plot of each disease state in each tissue. Each row represents a significant GO biological process which is colored according to the -log10(p.adjust).
ColorectumMSSGO analysis - Figure of enriched GO biological processes: Top 15 enriched GO BP terms are showed in the bar plot of each disease state in each tissue. Each row represents a significant GO biological process which is colored according to the -log10(p.adjust).
ColorectumMSI-HGO analysis - Figure of enriched GO biological processes: Top 15 enriched GO BP terms are showed in the bar plot of each disease state in each tissue. Each row represents a significant GO biological process which is colored according to the -log10(p.adjust).
ColorectumFAPGO analysis - Figure of enriched GO biological processes: Top 15 enriched GO BP terms are showed in the bar plot of each disease state in each tissue. Each row represents a significant GO biological process which is colored according to the -log10(p.adjust).
∗Top 15 enriched GO BP terms are showed in the bar plot of each disease state in each tissue. Each row represents a significant GO biological process which is colored according to the -log10(p.adjust).
Page: 1 2 3 4 5 6 7 8 9 

check button Enriched GO biological processes.
GO IDTissueDisease StageDescriptionGene RatioBg Ratiopvaluep.adjustCount
GO:00452169CervixCCcell-cell junction organization53/2311200/187233.83e-082.53e-0653
GO:00430877CervixCCregulation of GTPase activity79/2311348/187234.21e-082.60e-0679
GO:00343298CervixCCcell junction assembly88/2311420/187233.42e-071.38e-0588
GO:00070439CervixCCcell-cell junction assembly39/2311146/187231.86e-065.94e-0539
GO:00457876CervixCCpositive regulation of cell cycle66/2311313/187237.78e-061.81e-0466
GO:00900685CervixCCpositive regulation of cell cycle process50/2311236/187238.25e-051.11e-0350
GO:00435476CervixCCpositive regulation of GTPase activity53/2311255/187238.72e-051.16e-0353
GO:00513021CervixCCregulation of cell division39/2311177/187232.05e-042.33e-0339
GO:00009107CervixCCcytokinesis37/2311173/187235.40e-045.23e-0337
GO:0032465CervixCCregulation of cytokinesis22/231192/187231.55e-031.20e-0222
GO:0045216ColorectumADcell-cell junction organization80/3918200/187235.57e-104.58e-0880
GO:0034329ColorectumADcell junction assembly136/3918420/187232.02e-081.15e-06136
GO:0007043ColorectumADcell-cell junction assembly57/3918146/187234.18e-071.61e-0557
GO:0043087ColorectumADregulation of GTPase activity110/3918348/187231.64e-065.03e-05110
GO:0000910ColorectumADcytokinesis59/3918173/187233.74e-056.75e-0459
GO:0043547ColorectumADpositive regulation of GTPase activity75/3918255/187237.95e-047.91e-0375
GO:0045787ColorectumADpositive regulation of cell cycle85/3918313/187234.76e-033.22e-0285
GO:00452161ColorectumSERcell-cell junction organization63/2897200/187239.15e-097.80e-0763
GO:00070431ColorectumSERcell-cell junction assembly45/2897146/187232.23e-069.31e-0545
GO:00343291ColorectumSERcell junction assembly100/2897420/187234.23e-061.61e-04100
Page: 1 2 3 4 5 6 7 8 9 

check button Enriched KEGG pathways.
Pathway IDTissueDisease StageDescriptionGene RatioBg Ratiopvaluep.adjustqvalueCount
Page: 1 

Top

Cell-cell communication analysis

check buttonIdentification of potential cell-cell interactions between two cell types and their ligand-receptor pairs for different disease states
LigandReceptorLRpairPathwayTissueDisease Stage
Page: 1 

Top

Single-cell gene regulatory network inference analysis

check buttonFind out the significant the regulons (TFs) and the target genes of each regulon across cell types for different disease states
TFCell TypeTissueDisease StageTarget GeneRSSRegulon Activity
∗The dot plots of a searched regulon are shown for all cell subpopulations in each disease state of each tissue based on the regulon specific score inferred using pySCENIC and by calculating the average expression.
Page: 1 

Top

Somatic mutation of malignant transformation related genes

check buttonAnnotation of somatic variants for genes involved in malignant transformation
Hugo SymbolVariant ClassVariant ClassificationdbSNP RSHGVScHGVSpHGVSp ShortSWISSPROTBIOTYPESIFTPolyPhenTumor Sample BarcodeTissueHistologySexAgeStageTherapy TypesDrugsOutcome
PKP4SNVMissense_Mutationc.1141N>Cp.Asp381Hisp.D381HQ99569protein_codingdeleterious(0.02)probably_damaging(0.959)TCGA-A8-A09G-01Breastbreast invasive carcinomaFemale>=65III/IVUnknownUnknownSD
PKP4SNVMissense_Mutationrs766638824c.754N>Ap.Asp252Asnp.D252NQ99569protein_codingtolerated(0.08)benign(0.205)TCGA-A8-A09N-01Breastbreast invasive carcinomaFemale<65III/IVUnknownUnknownSD
PKP4SNVMissense_Mutationrs750000750c.1837N>Ap.Val613Ilep.V613IQ99569protein_codingdeleterious(0)benign(0.245)TCGA-AC-A3QQ-01Breastbreast invasive carcinomaFemale<65I/IIUnknownUnknownSD
PKP4SNVMissense_Mutationnovelc.923C>Ap.Thr308Asnp.T308NQ99569protein_codingdeleterious(0.01)benign(0.033)TCGA-AC-A3W7-01Breastbreast invasive carcinomaFemale>=65I/IIHormone TherapyfemaraSD
PKP4SNVMissense_Mutationnovelc.521N>Tp.Asn174Ilep.N174IQ99569protein_codingtolerated(0.44)benign(0.003)TCGA-AN-A046-01Breastbreast invasive carcinomaFemale>=65I/IIUnknownUnknownSD
PKP4SNVMissense_Mutationrs375821441c.1961N>Ap.Arg654Glnp.R654QQ99569protein_codingtolerated(0.96)benign(0.055)TCGA-AN-A046-01Breastbreast invasive carcinomaFemale>=65I/IIUnknownUnknownSD
PKP4SNVMissense_Mutationc.3175N>Tp.Arg1059Cysp.R1059CQ99569protein_codingdeleterious(0)possibly_damaging(0.549)TCGA-AN-A046-01Breastbreast invasive carcinomaFemale>=65I/IIUnknownUnknownSD
PKP4SNVMissense_Mutationc.2645G>Ap.Arg882Lysp.R882KQ99569protein_codingdeleterious(0)possibly_damaging(0.801)TCGA-AN-A0FV-01Breastbreast invasive carcinomaFemale<65I/IIUnknownUnknownSD
PKP4SNVMissense_Mutationc.2032G>Ap.Asp678Asnp.D678NQ99569protein_codingdeleterious(0.03)benign(0.019)TCGA-AR-A0TT-01Breastbreast invasive carcinomaFemale<65III/IVChemotherapydoxorubicinSD
PKP4SNVMissense_Mutationc.2799N>Cp.Glu933Aspp.E933DQ99569protein_codingtolerated(1)benign(0.003)TCGA-AR-A24Q-01Breastbreast invasive carcinomaFemale<65I/IIChemotherapydoxorubicinSD
Page: 1 2 3 4 5 6 7 8 9 10 11 12 13 

Top

Related drugs of malignant transformation related genes

check buttonIdentification of chemicals and drugs interact with genes involved in malignant transfromation
(DGIdb 4.0)
Entrez IDSymbolCategoryInteraction TypesDrug Claim NameDrug NamePMIDs
Page: 1