
|
|||||
|
 | |
| |
| |
| |
| |
| |
|
Gene: PKP2 |
Gene summary for PKP2 |
| Gene information | Species | Human | Gene symbol | PKP2 | Gene ID | 5318 |
| Gene name | plakophilin 2 | |
| Gene Alias | ARVD9 | |
| Cytomap | 12p11.21 | |
| Gene Type | protein-coding | GO ID | GO:0001508 | UniProtAcc | Q99959 |
Top |
Malignant transformation analysis |
| Identification of the aberrant gene expression in precancerous and cancerous lesions by comparing the gene expression of stem-like cells in diseased tissues with normal stem cells |
| Entrez ID | Symbol | Replicates | Species | Organ | Tissue | Adj P-value | Log2FC | Malignancy |
| 5318 | PKP2 | HTA11_3410_2000001011 | Human | Colorectum | AD | 3.31e-15 | -6.59e-01 | 0.0155 |
| 5318 | PKP2 | HTA11_347_2000001011 | Human | Colorectum | AD | 5.33e-21 | 8.75e-01 | -0.1954 |
| 5318 | PKP2 | HTA11_83_2000001011 | Human | Colorectum | SER | 8.56e-04 | 5.38e-01 | -0.1526 |
| 5318 | PKP2 | HTA11_866_3004761011 | Human | Colorectum | AD | 1.73e-10 | -6.37e-01 | 0.096 |
| 5318 | PKP2 | HTA11_10711_2000001011 | Human | Colorectum | AD | 2.05e-02 | -4.72e-01 | 0.0338 |
| 5318 | PKP2 | HTA11_99999965062_69753 | Human | Colorectum | MSI-H | 3.04e-02 | 7.72e-01 | 0.3487 |
| 5318 | PKP2 | HTA11_99999971662_82457 | Human | Colorectum | MSS | 2.49e-03 | -3.45e-01 | 0.3859 |
| 5318 | PKP2 | HTA11_99999973899_84307 | Human | Colorectum | MSS | 1.88e-05 | -7.32e-01 | 0.2585 |
| 5318 | PKP2 | HTA11_99999974143_84620 | Human | Colorectum | MSS | 1.11e-28 | -7.68e-01 | 0.3005 |
| 5318 | PKP2 | F007 | Human | Colorectum | FAP | 2.31e-08 | -6.99e-01 | 0.1176 |
| 5318 | PKP2 | A002-C-010 | Human | Colorectum | FAP | 1.10e-09 | -4.26e-01 | 0.242 |
| 5318 | PKP2 | A001-C-207 | Human | Colorectum | FAP | 3.47e-04 | -4.59e-01 | 0.1278 |
| 5318 | PKP2 | A015-C-203 | Human | Colorectum | FAP | 1.08e-35 | -7.11e-01 | -0.1294 |
| 5318 | PKP2 | A015-C-204 | Human | Colorectum | FAP | 1.89e-03 | -3.52e-01 | -0.0228 |
| 5318 | PKP2 | A014-C-040 | Human | Colorectum | FAP | 1.19e-04 | -5.22e-01 | -0.1184 |
| 5318 | PKP2 | A002-C-201 | Human | Colorectum | FAP | 1.38e-18 | -6.39e-01 | 0.0324 |
| 5318 | PKP2 | A002-C-203 | Human | Colorectum | FAP | 1.17e-10 | -4.81e-01 | 0.2786 |
| 5318 | PKP2 | A001-C-119 | Human | Colorectum | FAP | 1.13e-09 | -6.61e-01 | -0.1557 |
| 5318 | PKP2 | A001-C-108 | Human | Colorectum | FAP | 1.14e-20 | -3.68e-01 | -0.0272 |
| 5318 | PKP2 | A002-C-205 | Human | Colorectum | FAP | 3.48e-29 | -7.25e-01 | -0.1236 |
| Page: 1 2 3 4 5 |
| Tissue | Expression Dynamics | Abbreviation |
| Colorectum (GSE201348) |  | FAP: Familial adenomatous polyposis |
| CRC: Colorectal cancer | ||
| Colorectum (HTA11) |  | AD: Adenomas |
| SER: Sessile serrated lesions | ||
| MSI-H: Microsatellite-high colorectal cancer | ||
| MSS: Microsatellite stable colorectal cancer | ||
| Esophagus | 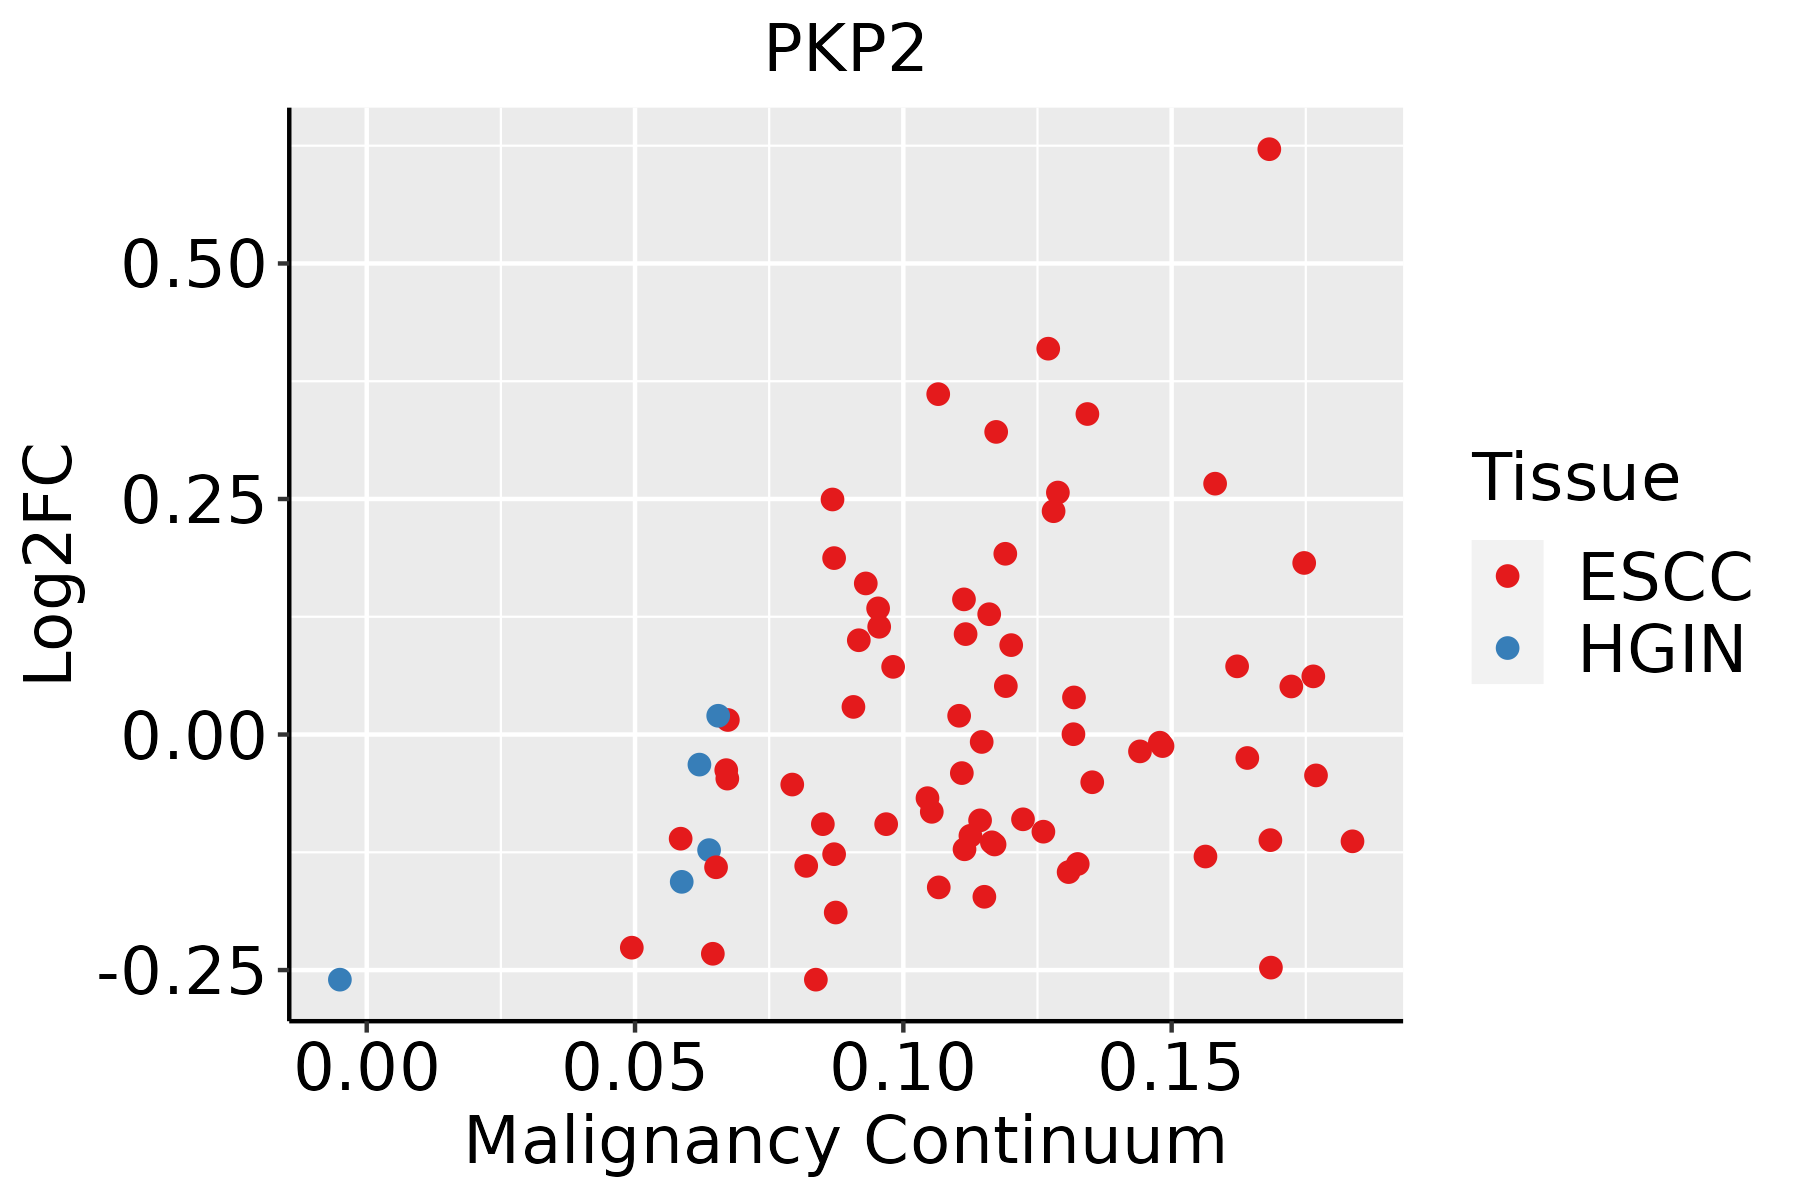 | ESCC: Esophageal squamous cell carcinoma |
| HGIN: High-grade intraepithelial neoplasias | ||
| LGIN: Low-grade intraepithelial neoplasias | ||
| Liver | 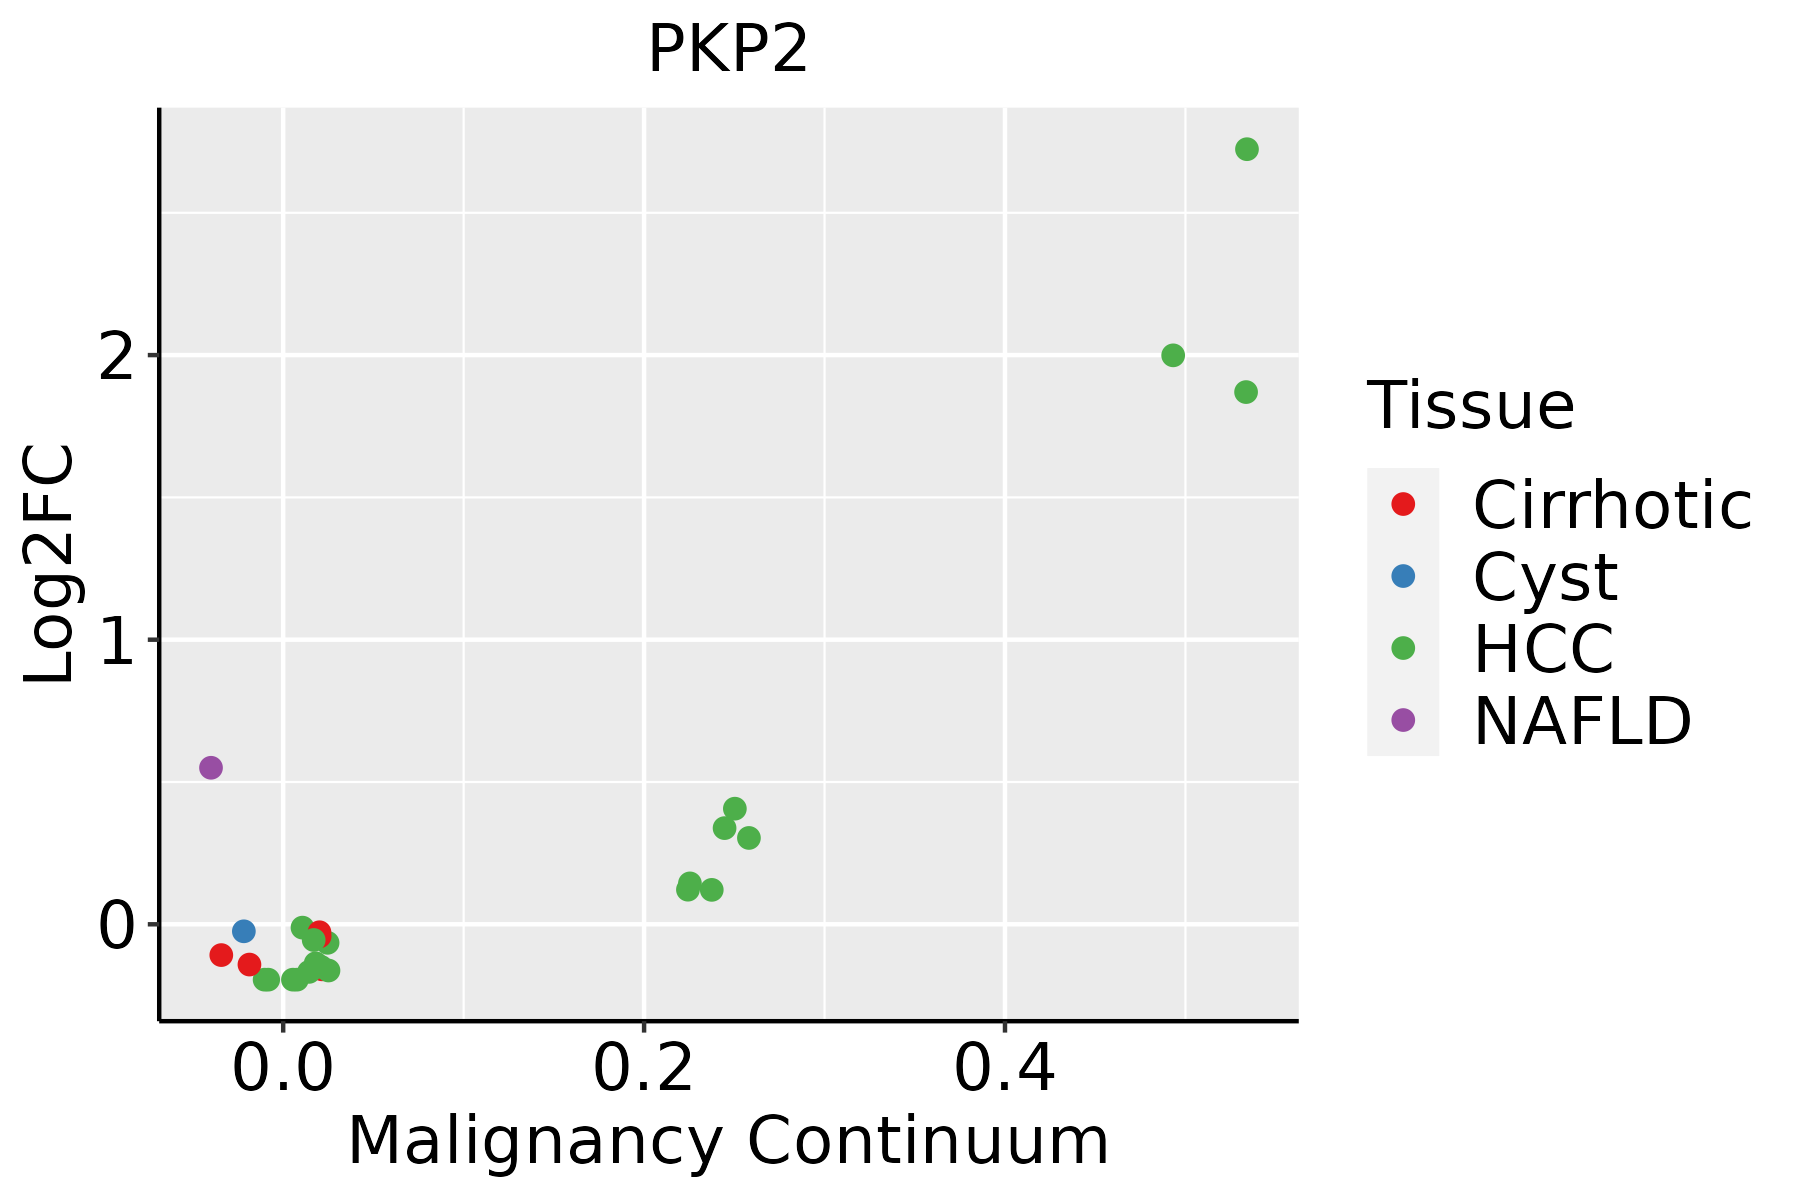 | HCC: Hepatocellular carcinoma |
| NAFLD: Non-alcoholic fatty liver disease | ||
| Oral Cavity | 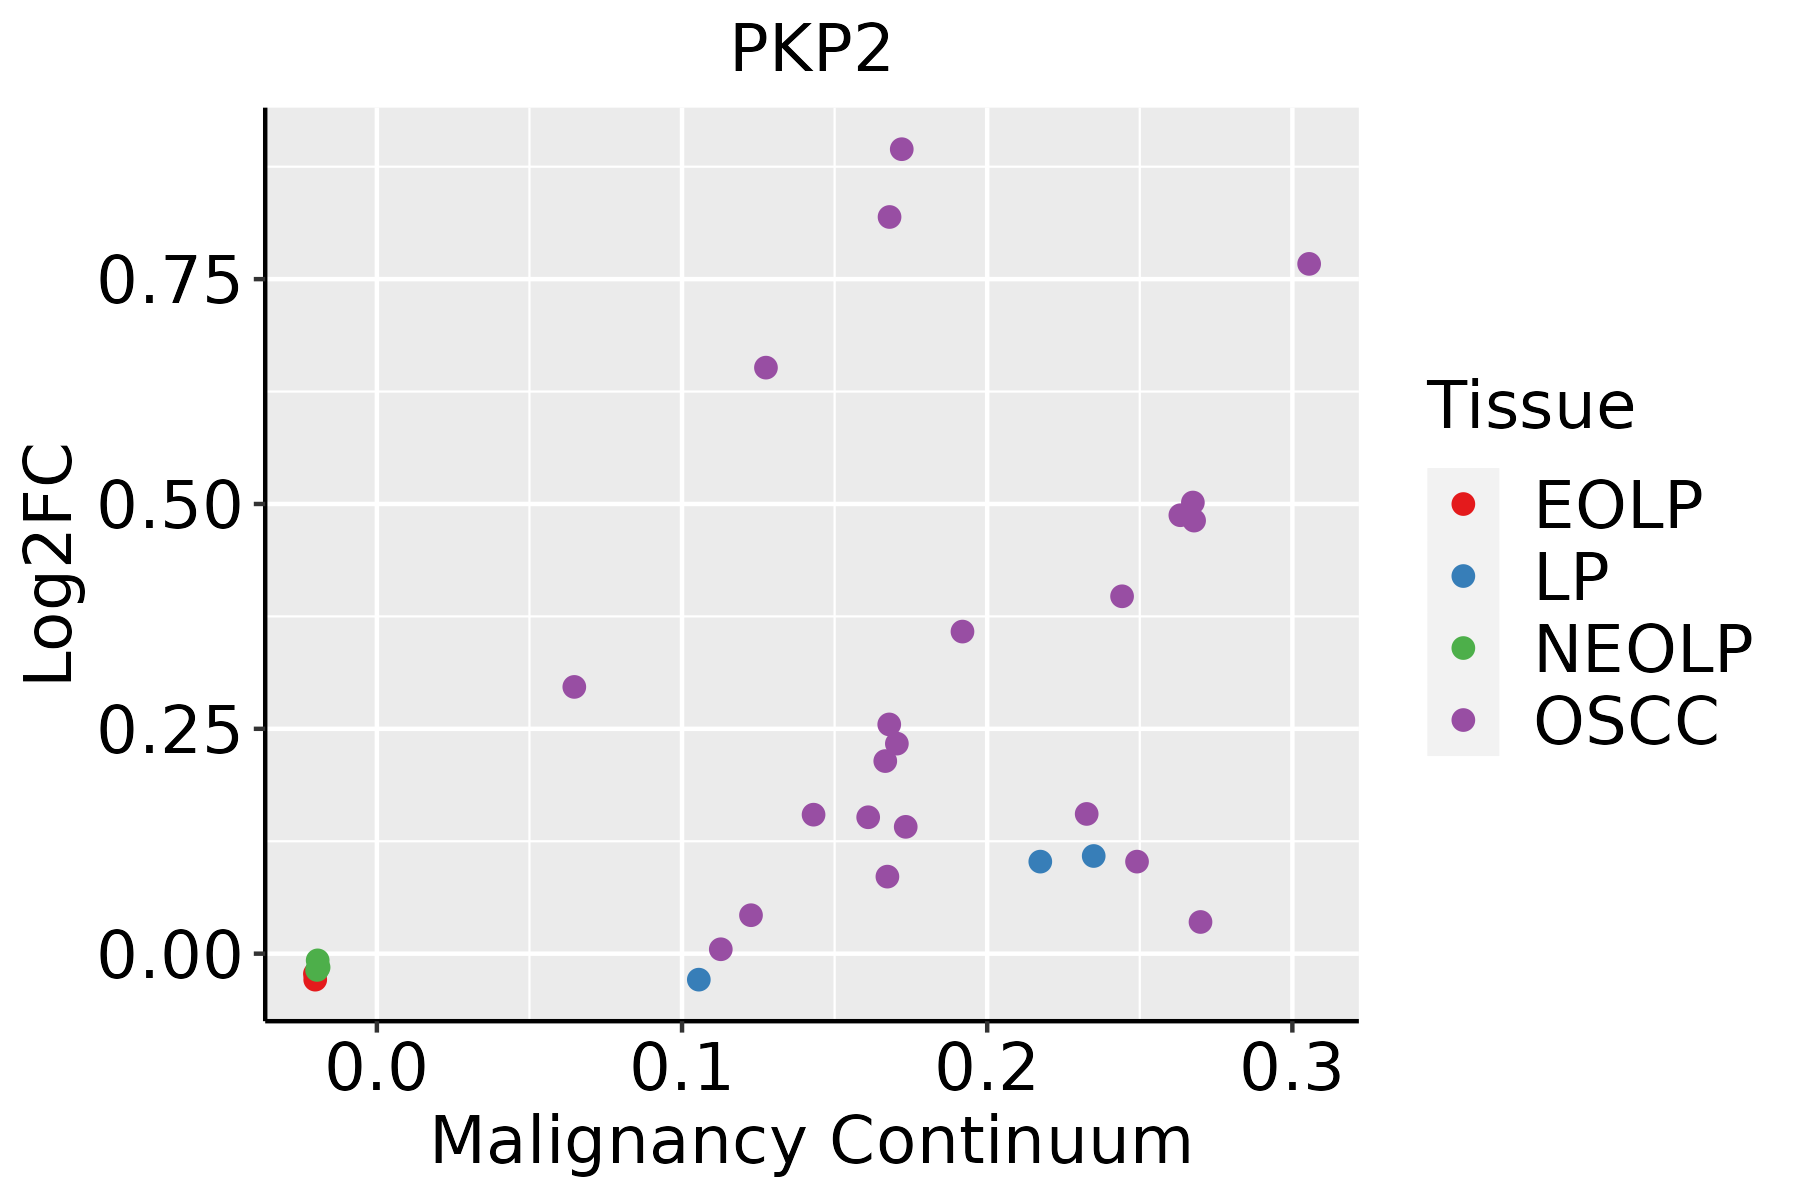 | EOLP: Erosive Oral lichen planus |
| LP: leukoplakia | ||
| NEOLP: Non-erosive oral lichen planus | ||
| OSCC: Oral squamous cell carcinoma |
| ∗log2FC in expression of this searched gene in stem-like cells from each diseased tissue sample relative to stem-like cells in normal samples in each tissue plotted against the malignancy continuum. Samples are colored based on if they are from different disease stage. |
Top |
Malignant transformation related pathway analysis |
| Find out the enriched GO biological processes and KEGG pathways involved in transition from healthy to precancer to cancer |
| Tissue | Disease Stage | Enriched GO biological Processes |
| Colorectum | AD |  |
| Colorectum | SER |  |
| Colorectum | MSS |  |
| Colorectum | MSI-H |  |
| Colorectum | FAP |  |
| ∗Top 15 enriched GO BP terms are showed in the bar plot of each disease state in each tissue. Each row represents a significant GO biological process which is colored according to the -log10(p.adjust). |
| Page: 1 2 3 4 5 6 7 8 9 |
| GO ID | Tissue | Disease Stage | Description | Gene Ratio | Bg Ratio | pvalue | p.adjust | Count |
| GO:0072659 | Colorectum | AD | protein localization to plasma membrane | 122/3918 | 284/18723 | 2.86e-17 | 1.49e-14 | 122 |
| GO:1990778 | Colorectum | AD | protein localization to cell periphery | 129/3918 | 333/18723 | 5.51e-14 | 1.15e-11 | 129 |
| GO:0032970 | Colorectum | AD | regulation of actin filament-based process | 142/3918 | 397/18723 | 4.05e-12 | 5.90e-10 | 142 |
| GO:0045216 | Colorectum | AD | cell-cell junction organization | 80/3918 | 200/18723 | 5.57e-10 | 4.58e-08 | 80 |
| GO:0034329 | Colorectum | AD | cell junction assembly | 136/3918 | 420/18723 | 2.02e-08 | 1.15e-06 | 136 |
| GO:0007043 | Colorectum | AD | cell-cell junction assembly | 57/3918 | 146/18723 | 4.18e-07 | 1.61e-05 | 57 |
| GO:0034109 | Colorectum | AD | homotypic cell-cell adhesion | 40/3918 | 90/18723 | 4.37e-07 | 1.67e-05 | 40 |
| GO:0002028 | Colorectum | AD | regulation of sodium ion transport | 36/3918 | 90/18723 | 2.89e-05 | 5.37e-04 | 36 |
| GO:0098901 | Colorectum | AD | regulation of cardiac muscle cell action potential | 15/3918 | 27/18723 | 8.20e-05 | 1.29e-03 | 15 |
| GO:0098911 | Colorectum | AD | regulation of ventricular cardiac muscle cell action potential | 9/3918 | 12/18723 | 9.01e-05 | 1.38e-03 | 9 |
| GO:0002934 | Colorectum | AD | desmosome organization | 8/3918 | 10/18723 | 1.09e-04 | 1.62e-03 | 8 |
| GO:0030048 | Colorectum | AD | actin filament-based movement | 44/3918 | 127/18723 | 2.31e-04 | 2.99e-03 | 44 |
| GO:0010765 | Colorectum | AD | positive regulation of sodium ion transport | 17/3918 | 35/18723 | 2.48e-04 | 3.13e-03 | 17 |
| GO:0090257 | Colorectum | AD | regulation of muscle system process | 73/3918 | 252/18723 | 1.46e-03 | 1.24e-02 | 73 |
| GO:0086004 | Colorectum | AD | regulation of cardiac muscle cell contraction | 15/3918 | 34/18723 | 1.96e-03 | 1.58e-02 | 15 |
| GO:00726591 | Colorectum | SER | protein localization to plasma membrane | 92/2897 | 284/18723 | 6.36e-13 | 1.86e-10 | 92 |
| GO:00329701 | Colorectum | SER | regulation of actin filament-based process | 115/2897 | 397/18723 | 4.16e-12 | 8.80e-10 | 115 |
| GO:19907781 | Colorectum | SER | protein localization to cell periphery | 98/2897 | 333/18723 | 6.09e-11 | 9.57e-09 | 98 |
| GO:00452161 | Colorectum | SER | cell-cell junction organization | 63/2897 | 200/18723 | 9.15e-09 | 7.80e-07 | 63 |
| GO:00070431 | Colorectum | SER | cell-cell junction assembly | 45/2897 | 146/18723 | 2.23e-06 | 9.31e-05 | 45 |
| Page: 1 2 3 4 5 6 7 8 9 10 11 |
| Pathway ID | Tissue | Disease Stage | Description | Gene Ratio | Bg Ratio | pvalue | p.adjust | qvalue | Count |
| hsa05412 | Colorectum | FAP | Arrhythmogenic right ventricular cardiomyopathy | 23/1404 | 77/8465 | 2.58e-03 | 1.19e-02 | 7.23e-03 | 23 |
| hsa054121 | Colorectum | FAP | Arrhythmogenic right ventricular cardiomyopathy | 23/1404 | 77/8465 | 2.58e-03 | 1.19e-02 | 7.23e-03 | 23 |
| hsa054122 | Colorectum | CRC | Arrhythmogenic right ventricular cardiomyopathy | 18/1091 | 77/8465 | 7.90e-03 | 3.77e-02 | 2.55e-02 | 18 |
| hsa054123 | Colorectum | CRC | Arrhythmogenic right ventricular cardiomyopathy | 18/1091 | 77/8465 | 7.90e-03 | 3.77e-02 | 2.55e-02 | 18 |
| Page: 1 |
Top |
Cell-cell communication analysis |
| Identification of potential cell-cell interactions between two cell types and their ligand-receptor pairs for different disease states |
| Ligand | Receptor | LRpair | Pathway | Tissue | Disease Stage |
| Page: 1 |
Top |
Single-cell gene regulatory network inference analysis |
| Find out the significant the regulons (TFs) and the target genes of each regulon across cell types for different disease states |
| TF | Cell Type | Tissue | Disease Stage | Target Gene | RSS | Regulon Activity |
| ∗The dot plots of a searched regulon are shown for all cell subpopulations in each disease state of each tissue based on the regulon specific score inferred using pySCENIC and by calculating the average expression. |
| Page: 1 |
Top |
Somatic mutation of malignant transformation related genes |
| Annotation of somatic variants for genes involved in malignant transformation |
| Hugo Symbol | Variant Class | Variant Classification | dbSNP RS | HGVSc | HGVSp | HGVSp Short | SWISSPROT | BIOTYPE | SIFT | PolyPhen | Tumor Sample Barcode | Tissue | Histology | Sex | Age | Stage | Therapy Types | Drugs | Outcome |
| PKP2 | SNV | Missense_Mutation | rs368986542 | c.2293N>C | p.Glu765Gln | p.E765Q | Q99959 | protein_coding | deleterious(0.01) | possibly_damaging(0.761) | TCGA-A2-A0CX-01 | Breast | breast invasive carcinoma | Female | <65 | I/II | Chemotherapy | adriamycin | SD |
| PKP2 | SNV | Missense_Mutation | novel | c.1548N>T | p.Lys516Asn | p.K516N | Q99959 | protein_coding | deleterious(0) | probably_damaging(0.992) | TCGA-AN-A046-01 | Breast | breast invasive carcinoma | Female | >=65 | I/II | Unknown | Unknown | SD |
| PKP2 | SNV | Missense_Mutation | rs397517027 | c.473N>A | p.Arg158Lys | p.R158K | Q99959 | protein_coding | tolerated(0.37) | benign(0.018) | TCGA-BH-A0HF-01 | Breast | breast invasive carcinoma | Female | >=65 | I/II | Hormone Therapy | arimidex | SD |
| PKP2 | SNV | Missense_Mutation | rs144018320 | c.2150N>T | p.Pro717Leu | p.P717L | Q99959 | protein_coding | deleterious(0) | probably_damaging(0.961) | TCGA-BH-A0HY-01 | Breast | breast invasive carcinoma | Female | <65 | I/II | Hormone Therapy | taxotere | CR |
| PKP2 | SNV | Missense_Mutation | c.2306N>G | p.Glu769Gly | p.E769G | Q99959 | protein_coding | deleterious(0.03) | benign(0.003) | TCGA-E9-A1ND-01 | Breast | breast invasive carcinoma | Female | >=65 | I/II | Hormone Therapy | aromasin | SD | |
| PKP2 | SNV | Missense_Mutation | rs370868564 | c.1064N>A | p.Arg355Gln | p.R355Q | Q99959 | protein_coding | deleterious(0.02) | possibly_damaging(0.732) | TCGA-OL-A5DA-01 | Breast | breast invasive carcinoma | Female | <65 | I/II | Unknown | Unknown | SD |
| PKP2 | insertion | Frame_Shift_Ins | novel | c.1726_1727insGAAGTTGGAGAATATGTCT | p.Met576ArgfsTer11 | p.M576Rfs*11 | Q99959 | protein_coding | TCGA-A2-A0CP-01 | Breast | breast invasive carcinoma | Female | <65 | I/II | Chemotherapy | cytoxan | SD | ||
| PKP2 | deletion | Frame_Shift_Del | novel | c.385delN | p.Gln129SerfsTer13 | p.Q129Sfs*13 | Q99959 | protein_coding | TCGA-AQ-A7U7-01 | Breast | breast invasive carcinoma | Female | <65 | III/IV | Targeted Molecular therapy | rituximab | CR | ||
| PKP2 | SNV | Missense_Mutation | c.1936N>C | p.Gly646Arg | p.G646R | Q99959 | protein_coding | deleterious(0) | probably_damaging(0.997) | TCGA-C5-A1BJ-01 | Cervix | cervical & endocervical cancer | Female | <65 | I/II | Unknown | Unknown | SD | |
| PKP2 | SNV | Missense_Mutation | novel | c.475N>A | p.Ala159Thr | p.A159T | Q99959 | protein_coding | tolerated(0.44) | benign(0.015) | TCGA-C5-A905-01 | Cervix | cervical & endocervical cancer | Female | <65 | I/II | Unknown | Unknown | SD |
| Page: 1 2 3 4 5 6 7 8 9 10 |
Top |
Related drugs of malignant transformation related genes |
| Identification of chemicals and drugs interact with genes involved in malignant transfromation |
| (DGIdb 4.0) |
| Entrez ID | Symbol | Category | Interaction Types | Drug Claim Name | Drug Name | PMIDs |
| Page: 1 |

Copyright 2023-Present -The University of Texas Health Science Center at Houston |