
|
|||||
|
 | |
| |
| |
| |
| |
| |
|
Gene: PKNOX1 |
Gene summary for PKNOX1 |
| Gene information | Species | Human | Gene symbol | PKNOX1 | Gene ID | 5316 |
| Gene name | PBX/knotted 1 homeobox 1 | |
| Gene Alias | PREP1 | |
| Cytomap | 21q22.3 | |
| Gene Type | protein-coding | GO ID | GO:0001525 | UniProtAcc | B4DGV5 |
Top |
Malignant transformation analysis |
| Identification of the aberrant gene expression in precancerous and cancerous lesions by comparing the gene expression of stem-like cells in diseased tissues with normal stem cells |
| Entrez ID | Symbol | Replicates | Species | Organ | Tissue | Adj P-value | Log2FC | Malignancy |
| 5316 | PKNOX1 | LZE4T | Human | Esophagus | ESCC | 3.56e-05 | 1.65e-01 | 0.0811 |
| 5316 | PKNOX1 | LZE7T | Human | Esophagus | ESCC | 2.67e-08 | 2.53e-01 | 0.0667 |
| 5316 | PKNOX1 | LZE24T | Human | Esophagus | ESCC | 1.36e-06 | 2.44e-01 | 0.0596 |
| 5316 | PKNOX1 | P1T-E | Human | Esophagus | ESCC | 7.15e-05 | 3.84e-01 | 0.0875 |
| 5316 | PKNOX1 | P2T-E | Human | Esophagus | ESCC | 1.17e-17 | 3.34e-01 | 0.1177 |
| 5316 | PKNOX1 | P4T-E | Human | Esophagus | ESCC | 3.48e-12 | 2.50e-01 | 0.1323 |
| 5316 | PKNOX1 | P5T-E | Human | Esophagus | ESCC | 2.09e-13 | 1.50e-01 | 0.1327 |
| 5316 | PKNOX1 | P8T-E | Human | Esophagus | ESCC | 1.16e-15 | 1.55e-01 | 0.0889 |
| 5316 | PKNOX1 | P9T-E | Human | Esophagus | ESCC | 5.69e-12 | 2.24e-01 | 0.1131 |
| 5316 | PKNOX1 | P10T-E | Human | Esophagus | ESCC | 2.56e-22 | 3.50e-01 | 0.116 |
| 5316 | PKNOX1 | P11T-E | Human | Esophagus | ESCC | 6.79e-07 | 3.28e-01 | 0.1426 |
| 5316 | PKNOX1 | P12T-E | Human | Esophagus | ESCC | 2.15e-14 | 2.55e-01 | 0.1122 |
| 5316 | PKNOX1 | P15T-E | Human | Esophagus | ESCC | 4.49e-07 | 2.10e-01 | 0.1149 |
| 5316 | PKNOX1 | P16T-E | Human | Esophagus | ESCC | 2.43e-06 | 1.37e-01 | 0.1153 |
| 5316 | PKNOX1 | P20T-E | Human | Esophagus | ESCC | 1.24e-11 | 3.05e-01 | 0.1124 |
| 5316 | PKNOX1 | P21T-E | Human | Esophagus | ESCC | 1.14e-15 | 2.74e-01 | 0.1617 |
| 5316 | PKNOX1 | P22T-E | Human | Esophagus | ESCC | 1.65e-08 | 1.30e-01 | 0.1236 |
| 5316 | PKNOX1 | P23T-E | Human | Esophagus | ESCC | 1.21e-09 | 1.81e-01 | 0.108 |
| 5316 | PKNOX1 | P24T-E | Human | Esophagus | ESCC | 1.13e-10 | 1.70e-01 | 0.1287 |
| 5316 | PKNOX1 | P26T-E | Human | Esophagus | ESCC | 3.93e-09 | 1.72e-01 | 0.1276 |
| Page: 1 2 3 |
| Tissue | Expression Dynamics | Abbreviation |
| Esophagus | 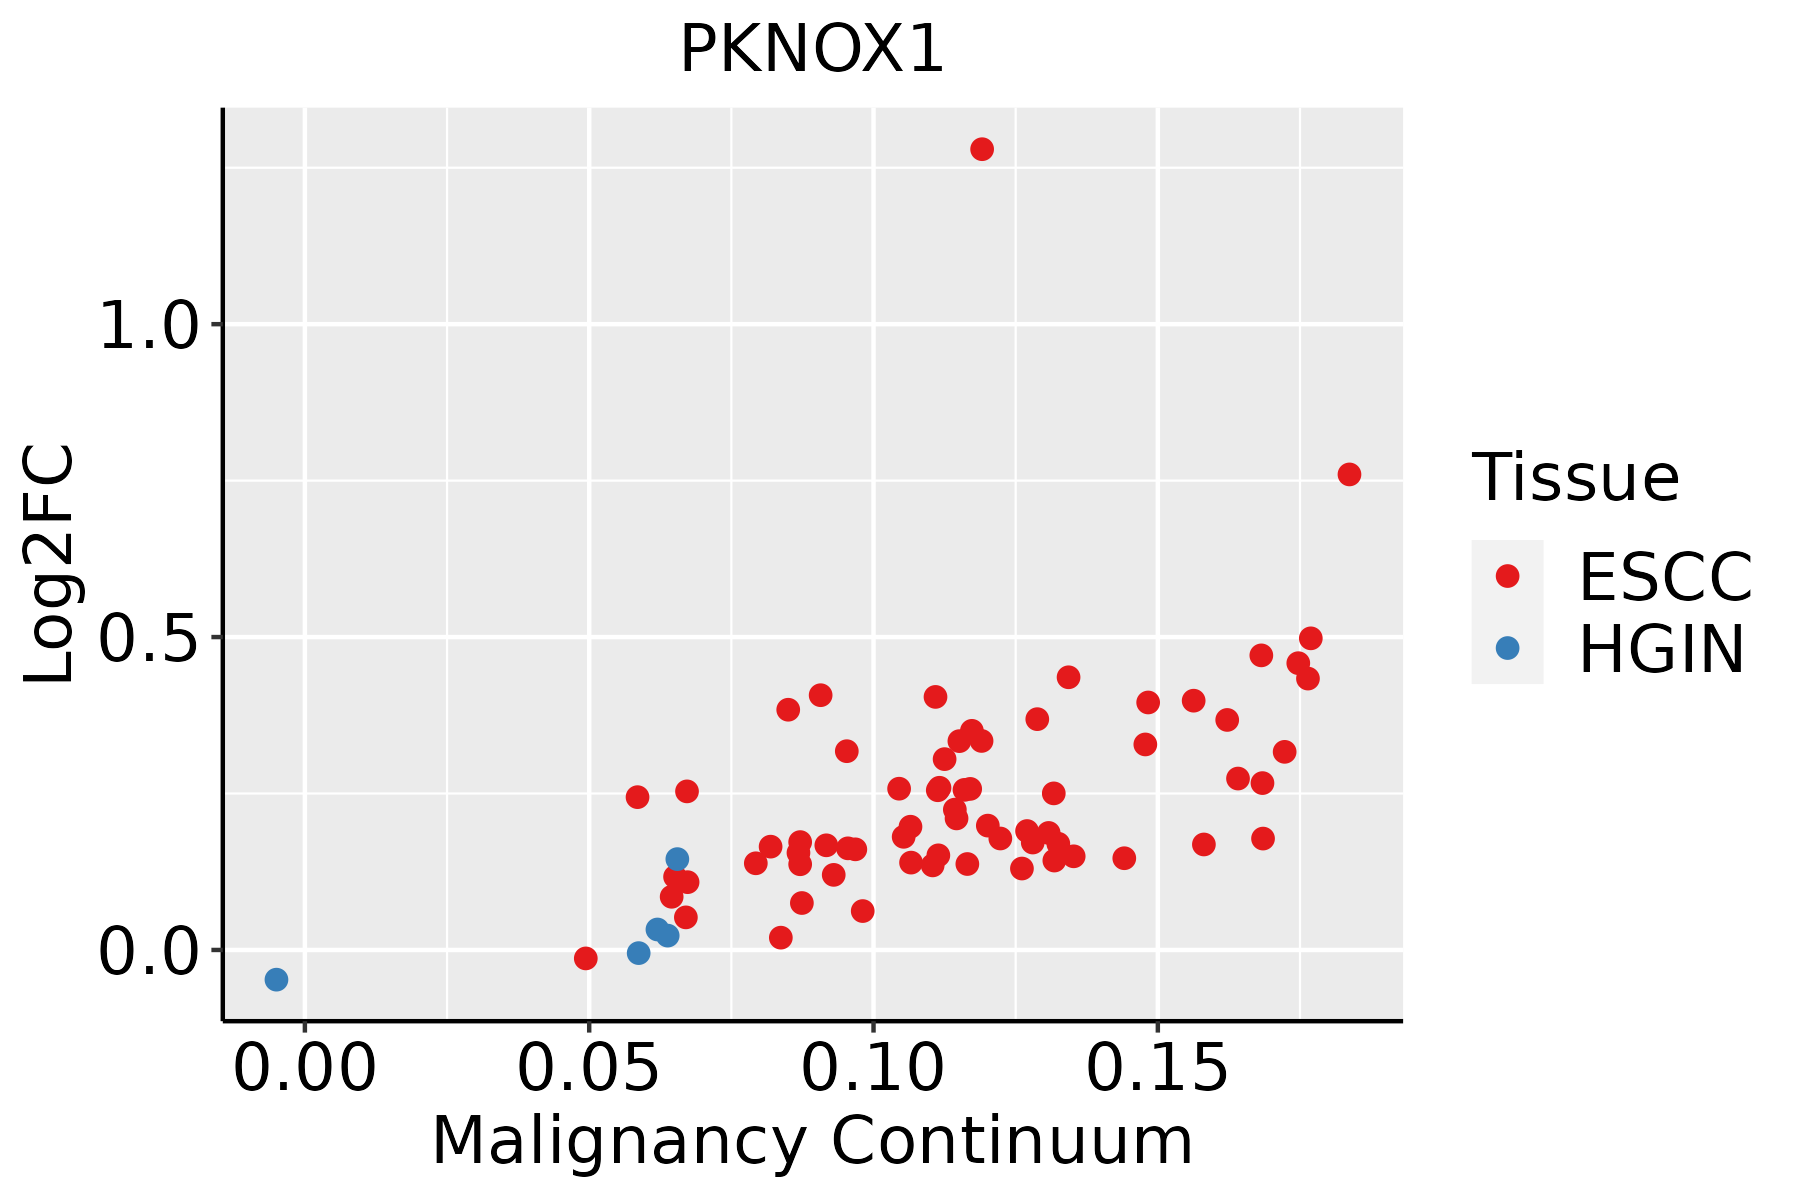 | ESCC: Esophageal squamous cell carcinoma |
| HGIN: High-grade intraepithelial neoplasias | ||
| LGIN: Low-grade intraepithelial neoplasias |
| ∗log2FC in expression of this searched gene in stem-like cells from each diseased tissue sample relative to stem-like cells in normal samples in each tissue plotted against the malignancy continuum. Samples are colored based on if they are from different disease stage. |
Top |
Malignant transformation related pathway analysis |
| Find out the enriched GO biological processes and KEGG pathways involved in transition from healthy to precancer to cancer |
| Tissue | Disease Stage | Enriched GO biological Processes |
| Colorectum | AD |  |
| Colorectum | SER |  |
| Colorectum | MSS |  |
| Colorectum | MSI-H |  |
| Colorectum | FAP |  |
| ∗Top 15 enriched GO BP terms are showed in the bar plot of each disease state in each tissue. Each row represents a significant GO biological process which is colored according to the -log10(p.adjust). |
| Page: 1 2 3 4 5 6 7 8 9 |
| GO ID | Tissue | Disease Stage | Description | Gene Ratio | Bg Ratio | pvalue | p.adjust | Count |
| GO:0030099111 | Esophagus | ESCC | myeloid cell differentiation | 232/8552 | 381/18723 | 1.22e-09 | 2.90e-08 | 232 |
| GO:0002262111 | Esophagus | ESCC | myeloid cell homeostasis | 104/8552 | 157/18723 | 1.49e-07 | 2.36e-06 | 104 |
| GO:0034101111 | Esophagus | ESCC | erythrocyte homeostasis | 88/8552 | 129/18723 | 1.81e-07 | 2.84e-06 | 88 |
| GO:0048872111 | Esophagus | ESCC | homeostasis of number of cells | 163/8552 | 272/18723 | 1.40e-06 | 1.69e-05 | 163 |
| GO:0030218111 | Esophagus | ESCC | erythrocyte differentiation | 80/8552 | 120/18723 | 2.69e-06 | 3.08e-05 | 80 |
| GO:004211018 | Esophagus | ESCC | T cell activation | 256/8552 | 487/18723 | 1.18e-03 | 5.87e-03 | 256 |
| GO:19031317 | Esophagus | ESCC | mononuclear cell differentiation | 226/8552 | 426/18723 | 1.20e-03 | 5.88e-03 | 226 |
| GO:00302176 | Esophagus | ESCC | T cell differentiation | 137/8552 | 257/18723 | 8.09e-03 | 2.87e-02 | 137 |
| GO:00300984 | Esophagus | ESCC | lymphocyte differentiation | 192/8552 | 374/18723 | 1.52e-02 | 4.93e-02 | 192 |
| Page: 1 |
| Pathway ID | Tissue | Disease Stage | Description | Gene Ratio | Bg Ratio | pvalue | p.adjust | qvalue | Count |
| Page: 1 |
Top |
Cell-cell communication analysis |
| Identification of potential cell-cell interactions between two cell types and their ligand-receptor pairs for different disease states |
| Ligand | Receptor | LRpair | Pathway | Tissue | Disease Stage |
| Page: 1 |
Top |
Single-cell gene regulatory network inference analysis |
| Find out the significant the regulons (TFs) and the target genes of each regulon across cell types for different disease states |
| TF | Cell Type | Tissue | Disease Stage | Target Gene | RSS | Regulon Activity |
| PKNOX1 | CD8TEFF | Endometrium | ADJ | UTP6,IER5L,TXNDC16, etc. | 1.10e-02 |  |
| PKNOX1 | CD8TCM | Endometrium | EEC | UTP6,IER5L,TXNDC16, etc. | 1.72e-02 |  |
| PKNOX1 | CD8TEXINT | Endometrium | Healthy | UTP6,IER5L,TXNDC16, etc. | 3.32e-02 |  |
| PKNOX1 | MVA | Endometrium | ADJ | RBM38,CCDC157,BAG4, etc. | 0.00e+00 | |
| PKNOX1 | ICAF | Endometrium | ADJ | RBM38,CCDC157,BAG4, etc. | 0.00e+00 | |
| PKNOX1 | MYOFIB | Endometrium | ADJ | RBM38,CCDC157,BAG4, etc. | -4.44e-16 | |
| PKNOX1 | ICAF | Endometrium | AEH | RBM38,CCDC157,BAG4, etc. | 0.00e+00 |  |
| PKNOX1 | MYOFIB | Endometrium | AEH | RBM38,CCDC157,BAG4, etc. | 0.00e+00 | |
| PKNOX1 | MYOFIB | Endometrium | EEC | RBM38,CCDC157,BAG4, etc. | 1.41e-03 | |
| PKNOX1 | LYMEND | Endometrium | Healthy | RBM38,CCDC157,BAG4, etc. | 1.18e-03 | |
| ∗The dot plots of a searched regulon are shown for all cell subpopulations in each disease state of each tissue based on the regulon specific score inferred using pySCENIC and by calculating the average expression. |
| Page: 1 2 |
Top |
Somatic mutation of malignant transformation related genes |
| Annotation of somatic variants for genes involved in malignant transformation |
| Hugo Symbol | Variant Class | Variant Classification | dbSNP RS | HGVSc | HGVSp | HGVSp Short | SWISSPROT | BIOTYPE | SIFT | PolyPhen | Tumor Sample Barcode | Tissue | Histology | Sex | Age | Stage | Therapy Types | Drugs | Outcome |
| PKNOX1 | SNV | Missense_Mutation | novel | c.257N>T | p.Ser86Phe | p.S86F | P55347 | protein_coding | deleterious(0) | probably_damaging(0.996) | TCGA-5L-AAT1-01 | Breast | breast invasive carcinoma | Female | <65 | III/IV | Hormone Therapy | letrozol | SD |
| PKNOX1 | SNV | Missense_Mutation | c.649N>A | p.Val217Ile | p.V217I | P55347 | protein_coding | tolerated(0.29) | benign(0.217) | TCGA-A8-A07R-01 | Breast | breast invasive carcinoma | Female | >=65 | III/IV | Ancillary | zoledronic | SD | |
| PKNOX1 | SNV | Missense_Mutation | novel | c.223G>A | p.Glu75Lys | p.E75K | P55347 | protein_coding | deleterious(0) | probably_damaging(0.985) | TCGA-C8-A12K-01 | Breast | breast invasive carcinoma | Female | >=65 | I/II | Unknown | Unknown | SD |
| PKNOX1 | SNV | Missense_Mutation | c.1237G>C | p.Glu413Gln | p.E413Q | P55347 | protein_coding | tolerated_low_confidence(0.12) | benign(0.026) | TCGA-D8-A1JA-01 | Breast | breast invasive carcinoma | Female | <65 | III/IV | Chemotherapy | adriamycin | PD | |
| PKNOX1 | SNV | Missense_Mutation | novel | c.823N>T | p.Arg275Trp | p.R275W | P55347 | protein_coding | deleterious(0) | probably_damaging(0.996) | TCGA-2W-A8YY-01 | Cervix | cervical & endocervical cancer | Female | <65 | I/II | Chemotherapy | cisplatin | CR |
| PKNOX1 | SNV | Missense_Mutation | novel | c.188N>A | p.Leu63Gln | p.L63Q | P55347 | protein_coding | deleterious(0) | probably_damaging(0.998) | TCGA-C5-A2LZ-01 | Cervix | cervical & endocervical cancer | Female | >=65 | III/IV | Unknown | Unknown | PD |
| PKNOX1 | SNV | Missense_Mutation | c.321N>G | p.Phe107Leu | p.F107L | P55347 | protein_coding | tolerated(0.23) | probably_damaging(0.97) | TCGA-EK-A3GK-01 | Cervix | cervical & endocervical cancer | Female | <65 | I/II | Unknown | Unknown | SD | |
| PKNOX1 | SNV | Missense_Mutation | c.1033T>G | p.Phe345Val | p.F345V | P55347 | protein_coding | deleterious(0) | possibly_damaging(0.766) | TCGA-A6-5665-01 | Colorectum | colon adenocarcinoma | Female | >=65 | I/II | Unknown | Unknown | PD | |
| PKNOX1 | SNV | Missense_Mutation | novel | c.812N>T | p.Thr271Met | p.T271M | P55347 | protein_coding | deleterious(0) | probably_damaging(0.976) | TCGA-AA-3980-01 | Colorectum | colon adenocarcinoma | Female | >=65 | I/II | Unknown | Unknown | SD |
| PKNOX1 | SNV | Missense_Mutation | novel | c.999N>T | p.Lys333Asn | p.K333N | P55347 | protein_coding | deleterious(0.01) | benign(0.088) | TCGA-CA-6717-01 | Colorectum | colon adenocarcinoma | Male | <65 | I/II | Chemotherapy | oxaliplatin | CR |
| Page: 1 2 3 4 5 |
Top |
Related drugs of malignant transformation related genes |
| Identification of chemicals and drugs interact with genes involved in malignant transfromation |
| (DGIdb 4.0) |
| Entrez ID | Symbol | Category | Interaction Types | Drug Claim Name | Drug Name | PMIDs |
| Page: 1 |

Copyright 2023-Present -The University of Texas Health Science Center at Houston |