
|
|||||
|
 | |
| |
| |
| |
| |
| |
|
Gene: PKN2 |
Gene summary for PKN2 |
| Gene information | Species | Human | Gene symbol | PKN2 | Gene ID | 5586 |
| Gene name | protein kinase N2 | |
| Gene Alias | PAK2 | |
| Cytomap | 1p22.2 | |
| Gene Type | protein-coding | GO ID | GO:0000278 | UniProtAcc | Q16513 |
Top |
Malignant transformation analysis |
| Identification of the aberrant gene expression in precancerous and cancerous lesions by comparing the gene expression of stem-like cells in diseased tissues with normal stem cells |
| Entrez ID | Symbol | Replicates | Species | Organ | Tissue | Adj P-value | Log2FC | Malignancy |
| 5586 | PKN2 | CA_HPV_1 | Human | Cervix | CC | 2.09e-03 | -1.54e-01 | 0.0264 |
| 5586 | PKN2 | CA_HPV_3 | Human | Cervix | CC | 4.43e-03 | -1.74e-02 | 0.0414 |
| 5586 | PKN2 | CCI_1 | Human | Cervix | CC | 1.03e-02 | 1.19e+00 | 0.528 |
| 5586 | PKN2 | CCI_2 | Human | Cervix | CC | 9.29e-11 | 1.18e+00 | 0.5249 |
| 5586 | PKN2 | CCI_3 | Human | Cervix | CC | 3.81e-07 | 9.86e-01 | 0.516 |
| 5586 | PKN2 | T1 | Human | Cervix | CC | 1.21e-02 | -2.39e-01 | 0.0918 |
| 5586 | PKN2 | HTA11_3410_2000001011 | Human | Colorectum | AD | 3.46e-16 | -6.18e-01 | 0.0155 |
| 5586 | PKN2 | HTA11_3361_2000001011 | Human | Colorectum | AD | 3.23e-09 | -5.59e-01 | -0.1207 |
| 5586 | PKN2 | HTA11_5216_2000001011 | Human | Colorectum | SER | 7.10e-04 | -6.38e-01 | -0.1462 |
| 5586 | PKN2 | HTA11_7862_2000001011 | Human | Colorectum | AD | 1.62e-04 | -6.91e-01 | -0.0179 |
| 5586 | PKN2 | HTA11_866_3004761011 | Human | Colorectum | AD | 4.35e-17 | -6.59e-01 | 0.096 |
| 5586 | PKN2 | HTA11_8622_2000001021 | Human | Colorectum | SER | 6.25e-07 | -7.72e-01 | 0.0528 |
| 5586 | PKN2 | HTA11_10711_2000001011 | Human | Colorectum | AD | 1.08e-03 | -4.27e-01 | 0.0338 |
| 5586 | PKN2 | HTA11_7696_3000711011 | Human | Colorectum | AD | 4.09e-04 | -3.76e-01 | 0.0674 |
| 5586 | PKN2 | HTA11_6818_2000001021 | Human | Colorectum | AD | 4.56e-03 | -5.51e-01 | 0.0588 |
| 5586 | PKN2 | HTA11_99999970781_79442 | Human | Colorectum | MSS | 1.16e-22 | -6.47e-01 | 0.294 |
| 5586 | PKN2 | HTA11_99999971662_82457 | Human | Colorectum | MSS | 1.87e-08 | -4.28e-01 | 0.3859 |
| 5586 | PKN2 | HTA11_99999973899_84307 | Human | Colorectum | MSS | 1.24e-03 | -5.73e-01 | 0.2585 |
| 5586 | PKN2 | HTA11_99999974143_84620 | Human | Colorectum | MSS | 3.41e-23 | -6.13e-01 | 0.3005 |
| 5586 | PKN2 | A001-C-207 | Human | Colorectum | FAP | 6.39e-04 | -1.48e-01 | 0.1278 |
| Page: 1 2 3 4 5 6 7 8 9 10 11 |
| Tissue | Expression Dynamics | Abbreviation |
| Cervix |  | CC: Cervix cancer |
| HSIL_HPV: HPV-infected high-grade squamous intraepithelial lesions | ||
| N_HPV: HPV-infected normal cervix | ||
| Colorectum (GSE201348) | 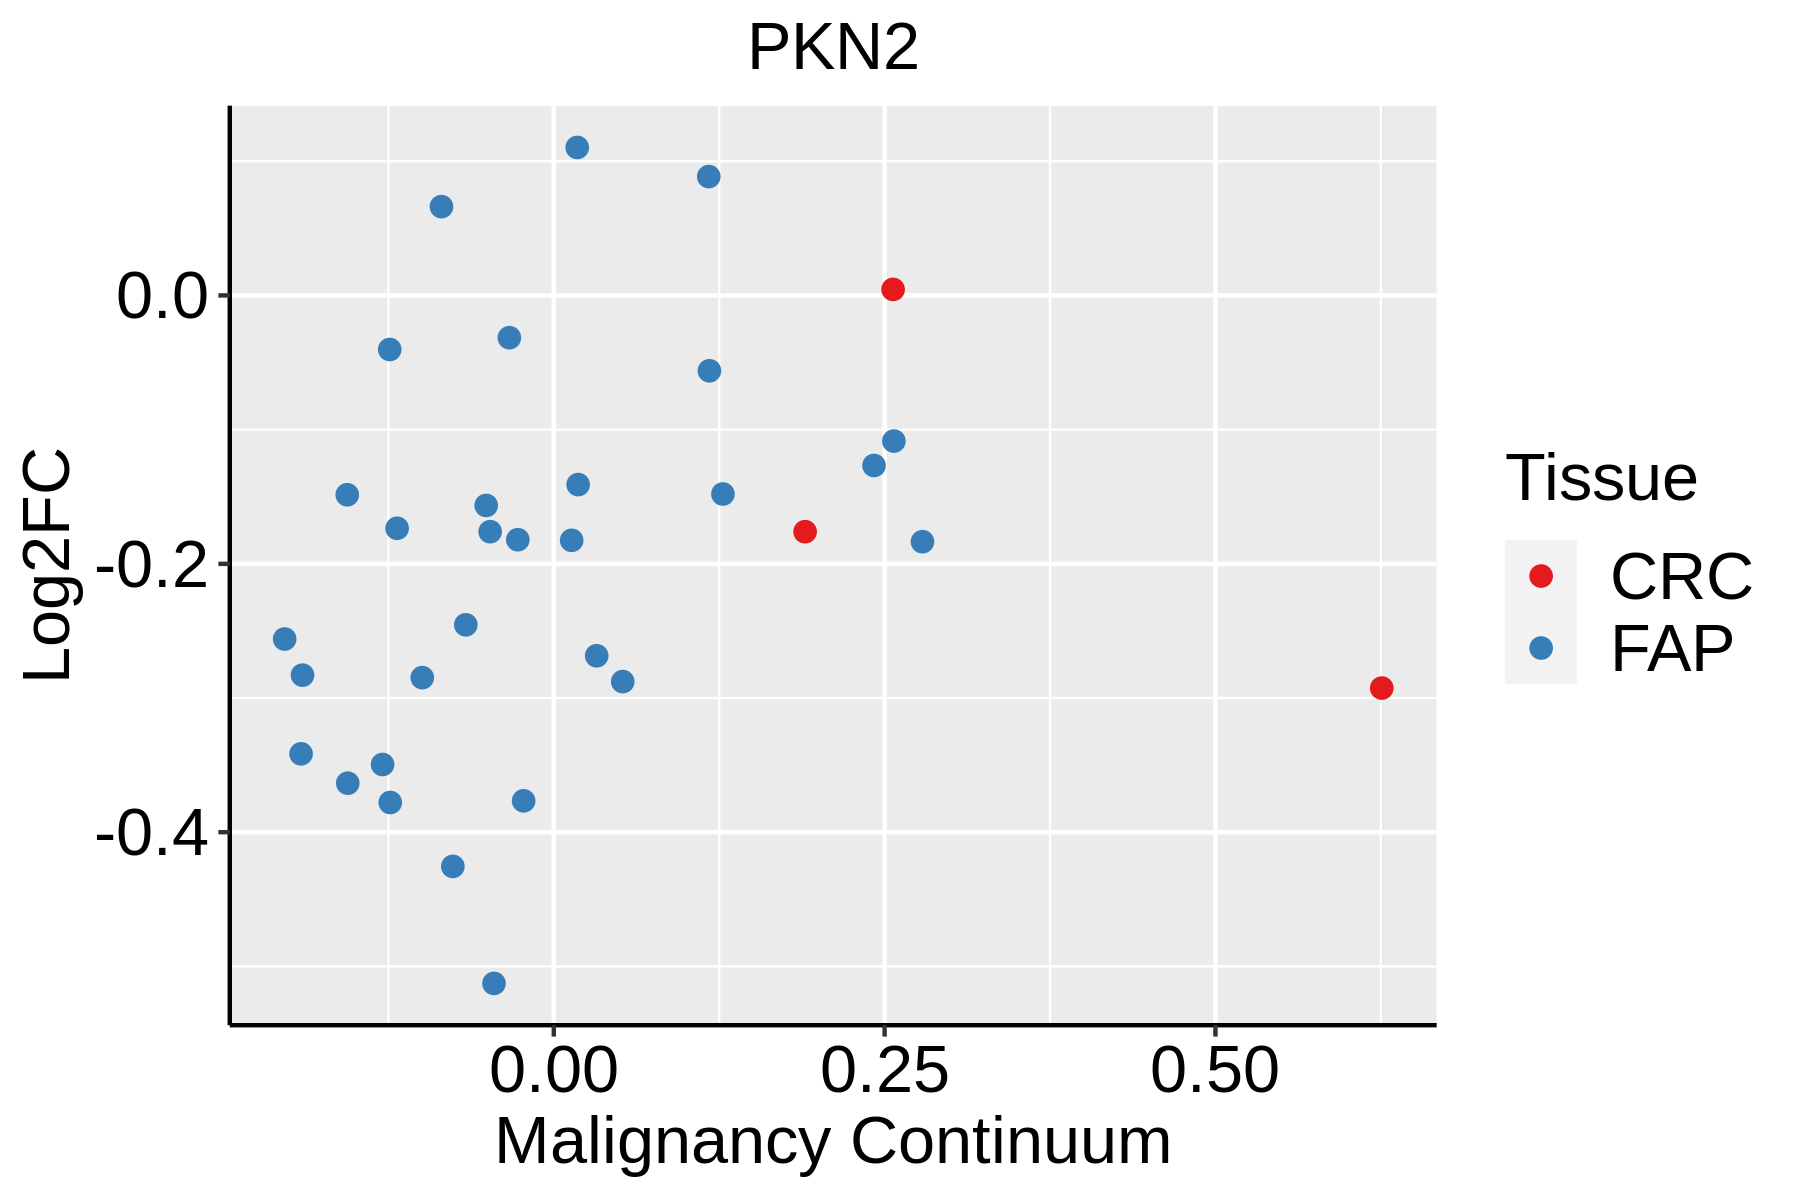 | FAP: Familial adenomatous polyposis |
| CRC: Colorectal cancer | ||
| Colorectum (HTA11) |  | AD: Adenomas |
| SER: Sessile serrated lesions | ||
| MSI-H: Microsatellite-high colorectal cancer | ||
| MSS: Microsatellite stable colorectal cancer | ||
| Esophagus | 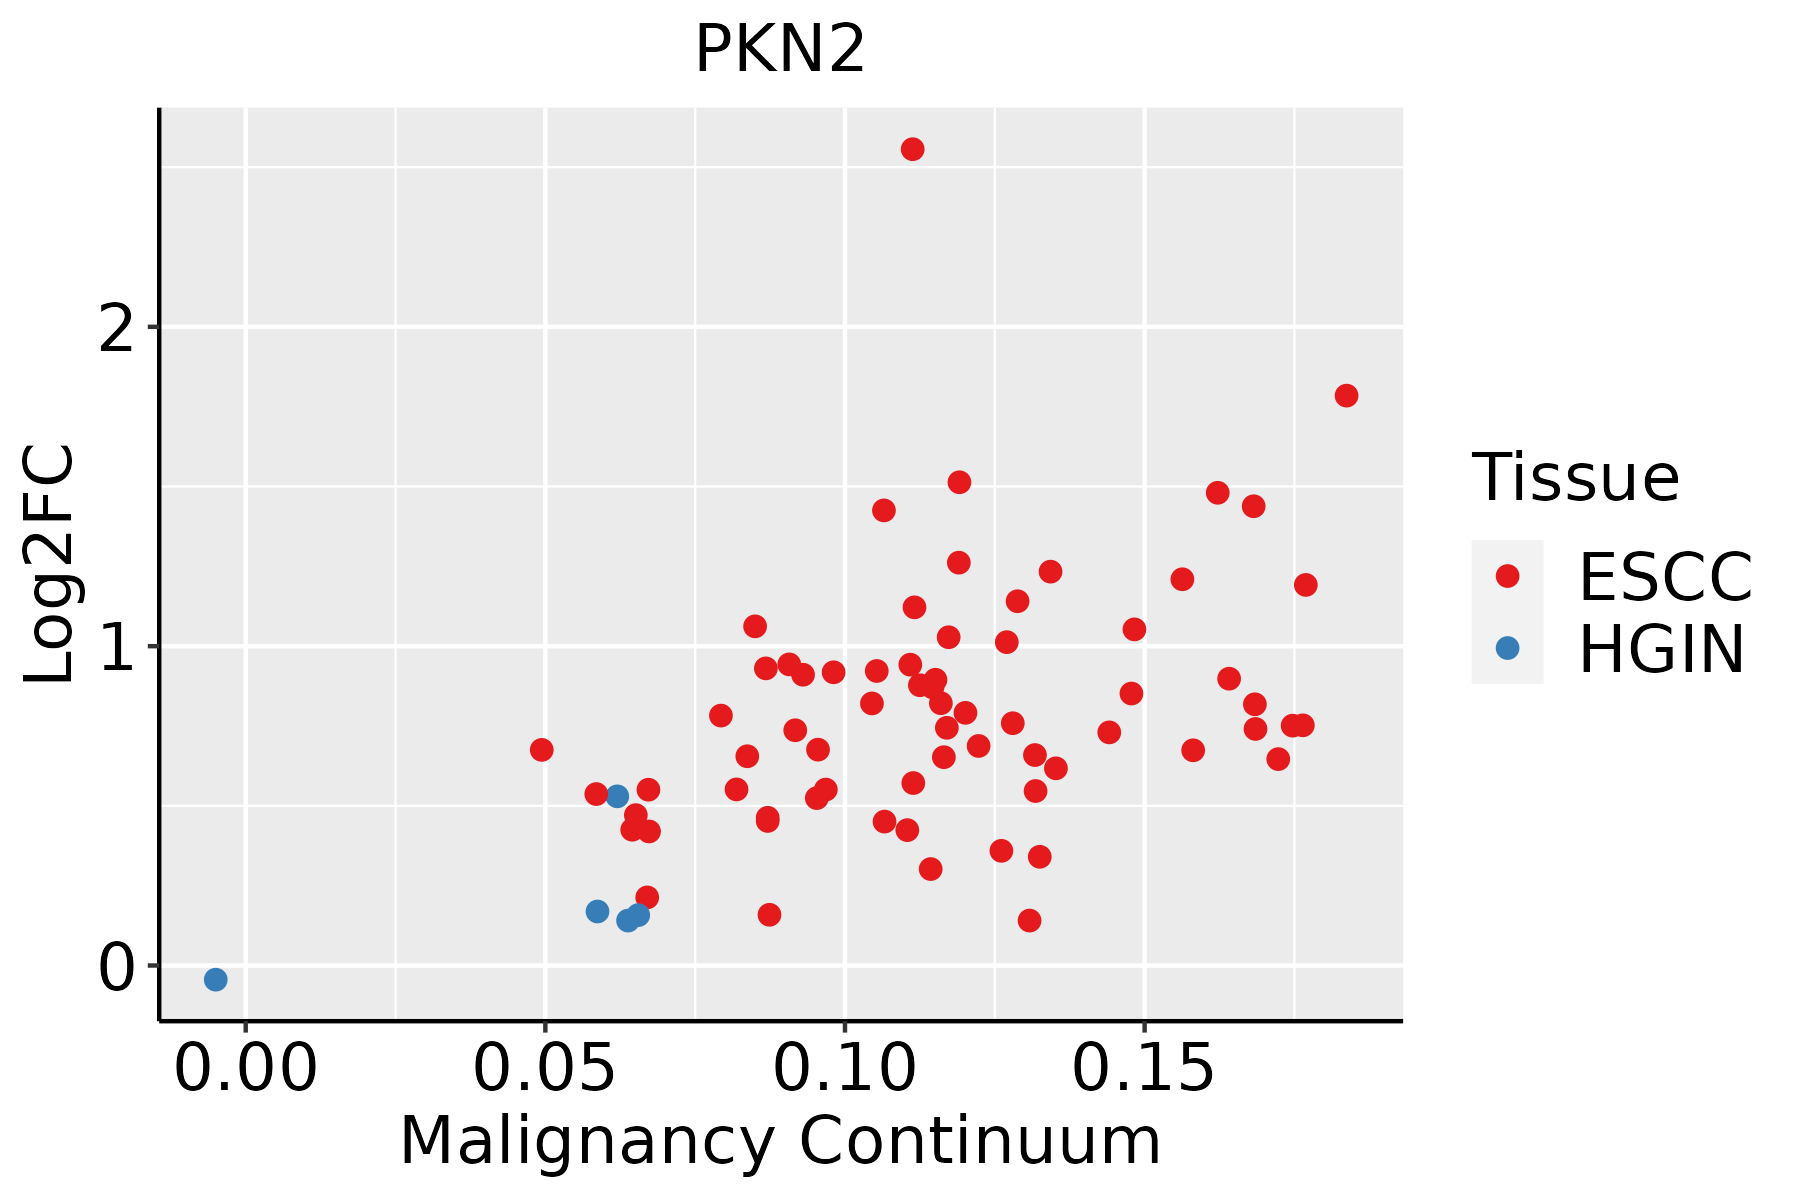 | ESCC: Esophageal squamous cell carcinoma |
| HGIN: High-grade intraepithelial neoplasias | ||
| LGIN: Low-grade intraepithelial neoplasias | ||
| GC | 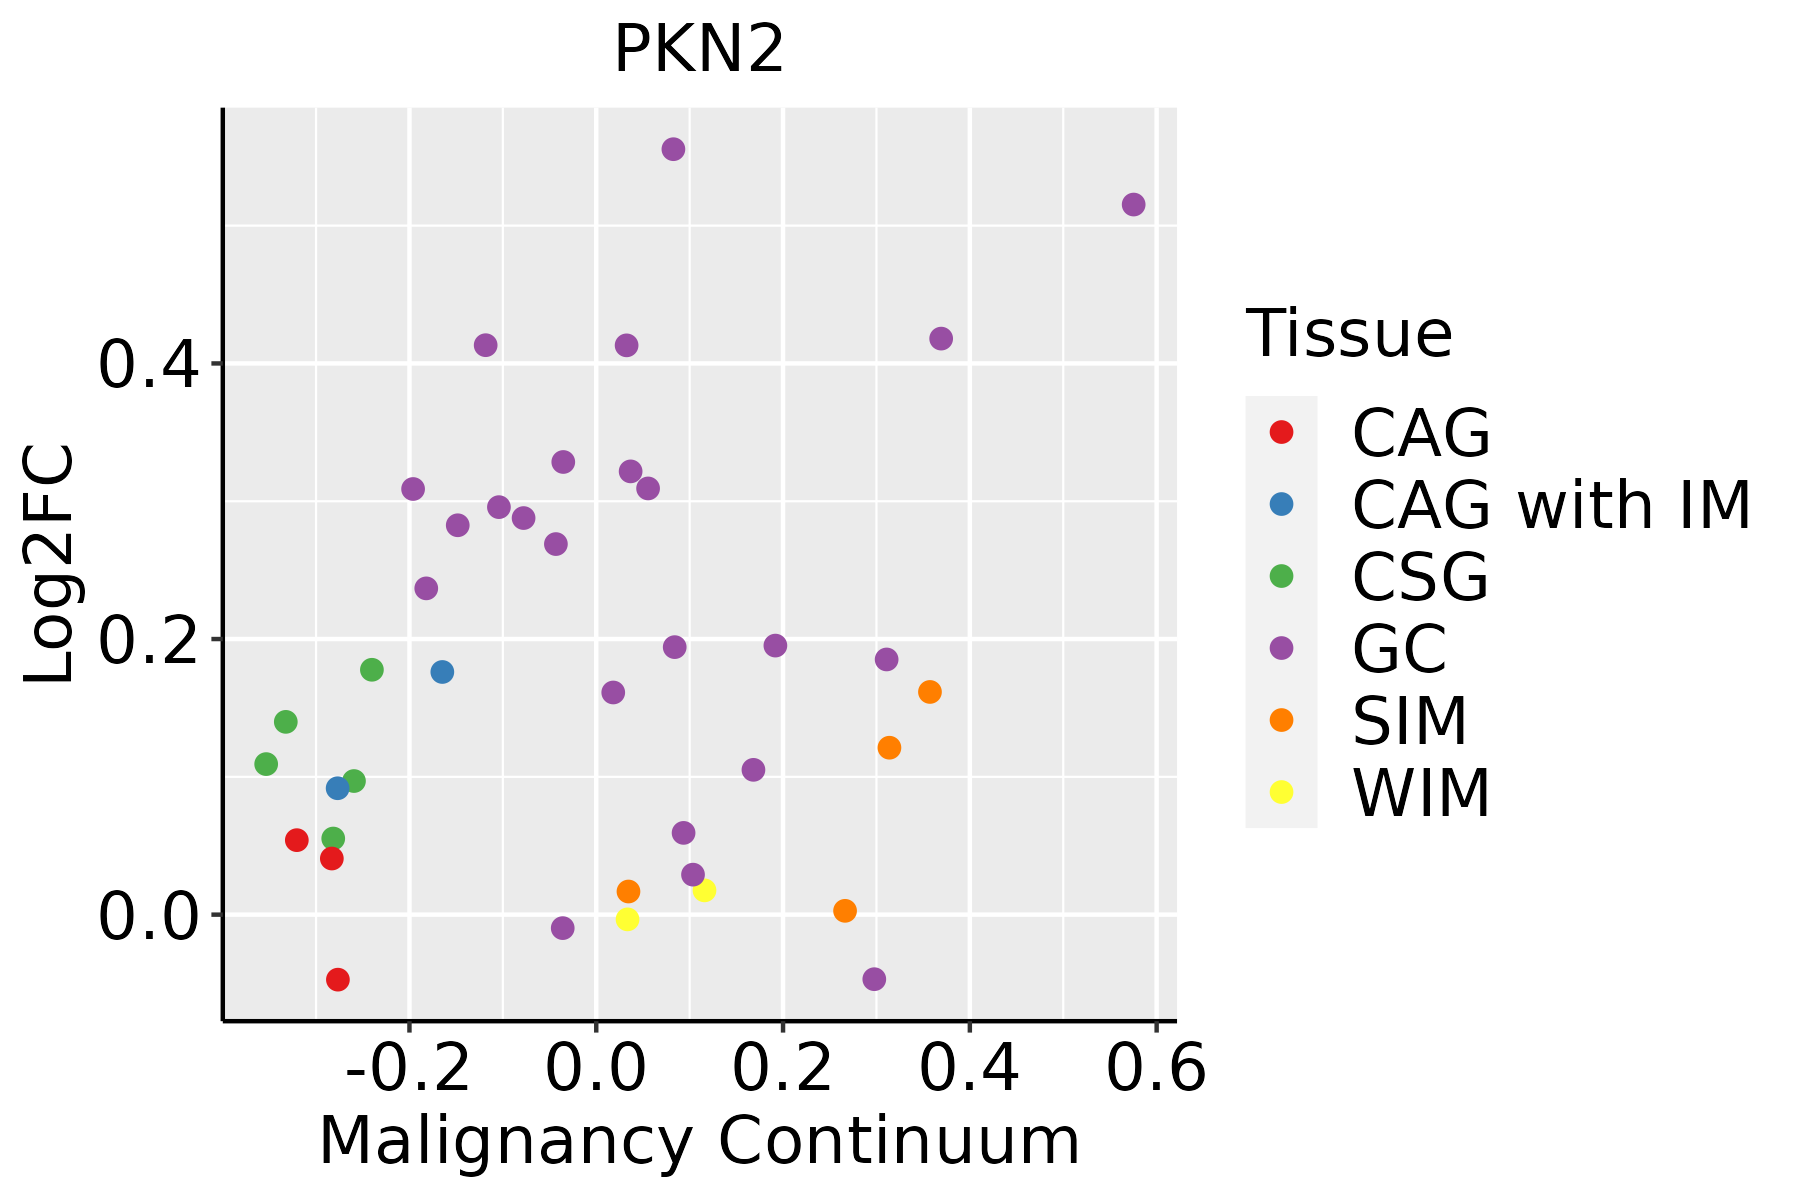 | CAG: Chronic atrophic gastritis |
| CAG with IM: Chronic atrophic gastritis with intestinal metaplasia | ||
| CSG: Chronic superficial gastritis | ||
| GC: Gastric cancer | ||
| SIM: Severe intestinal metaplasia | ||
| WIM: Wild intestinal metaplasia | ||
| Liver | 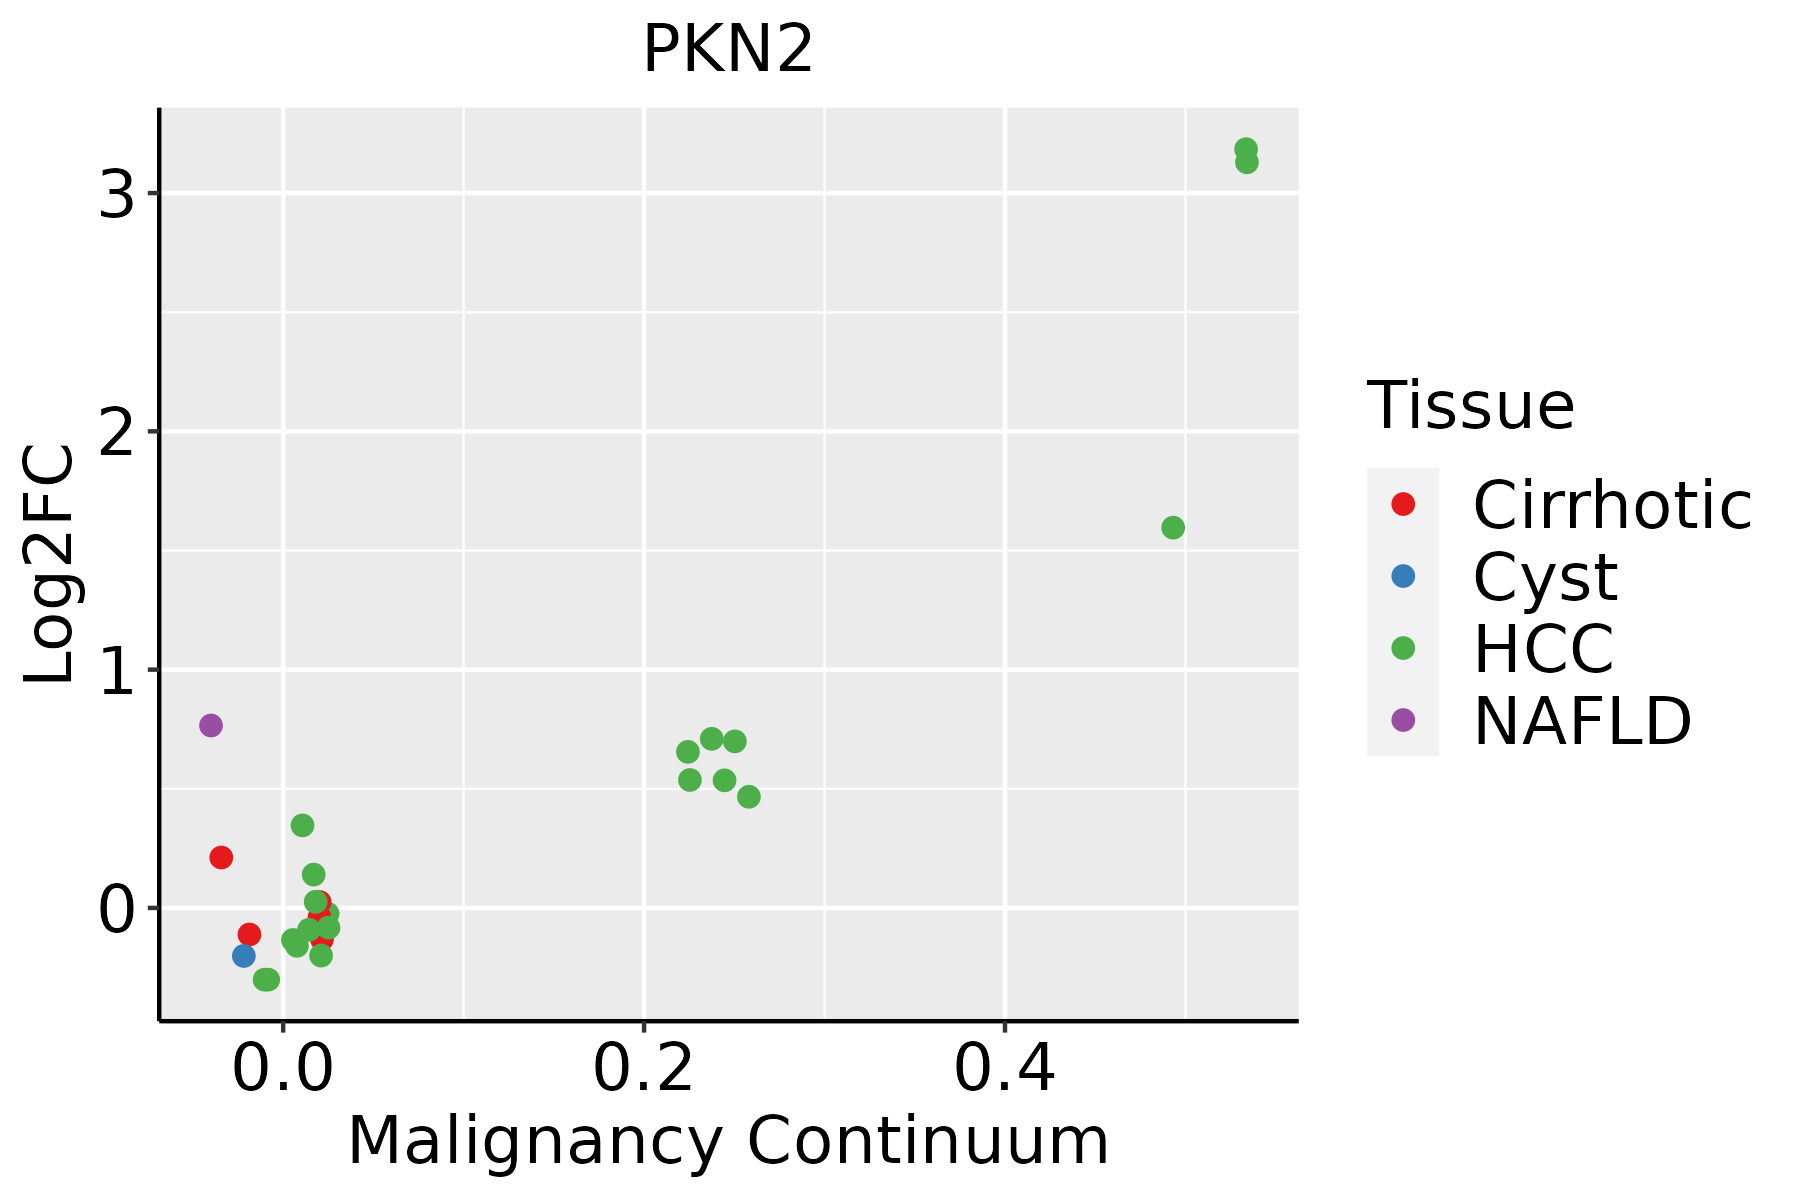 | HCC: Hepatocellular carcinoma |
| NAFLD: Non-alcoholic fatty liver disease | ||
| Lung | 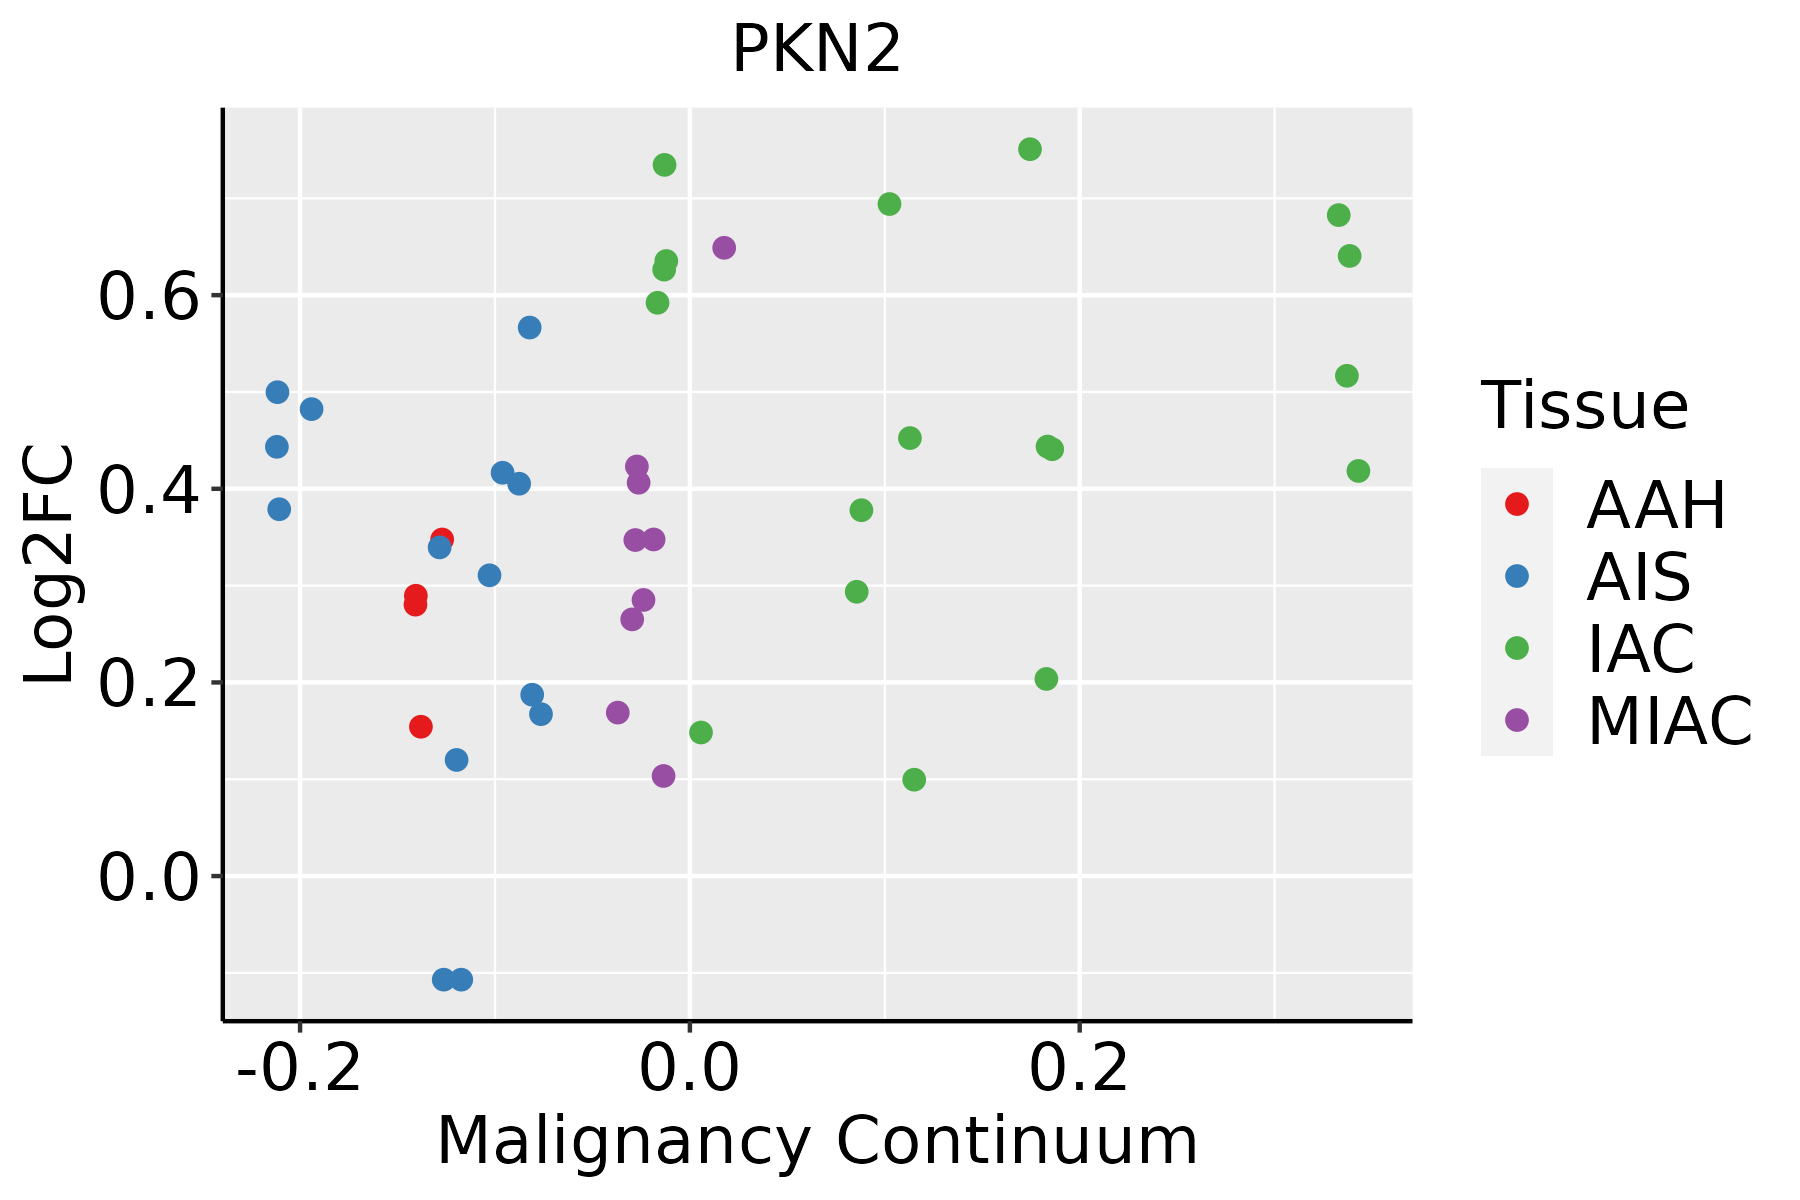 | AAH: Atypical adenomatous hyperplasia |
| AIS: Adenocarcinoma in situ | ||
| IAC: Invasive lung adenocarcinoma | ||
| MIA: Minimally invasive adenocarcinoma | ||
| Oral Cavity | 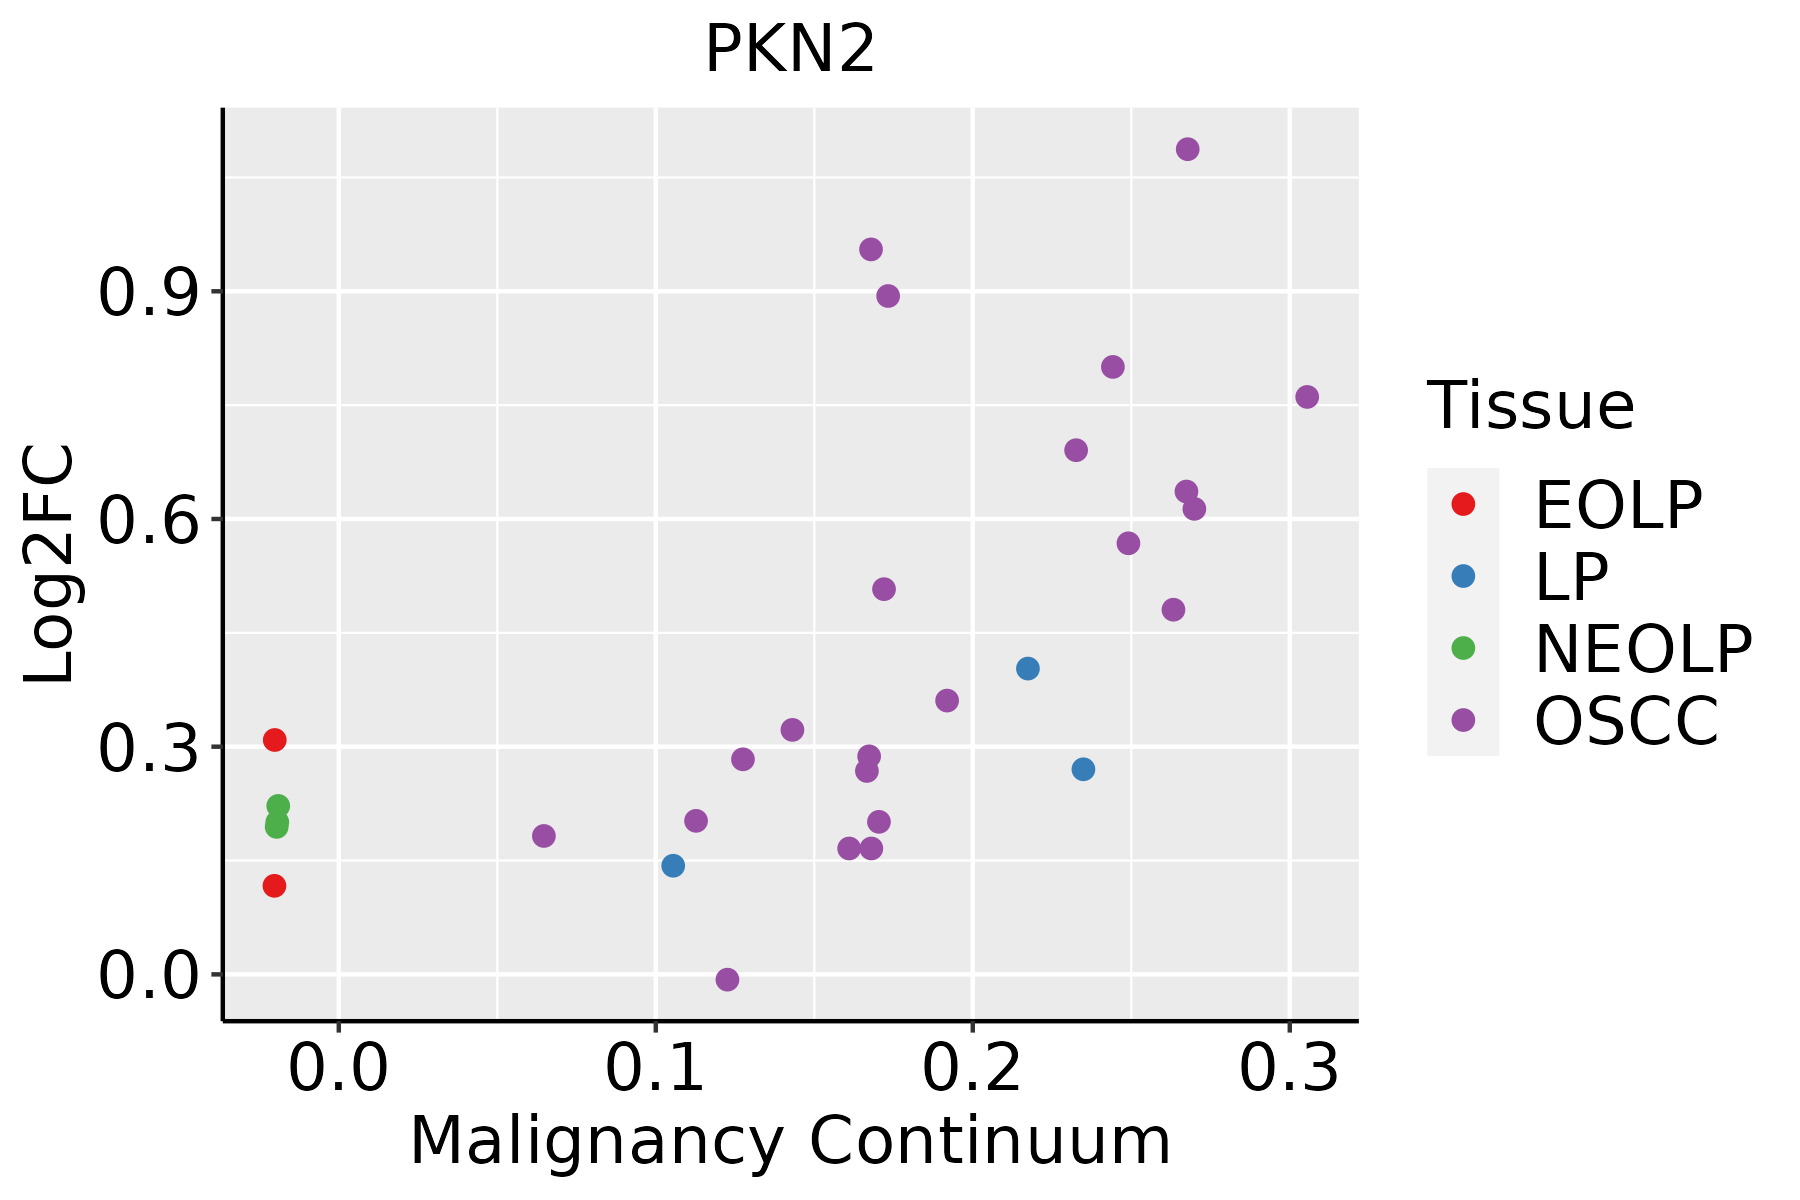 | EOLP: Erosive Oral lichen planus |
| LP: leukoplakia | ||
| NEOLP: Non-erosive oral lichen planus | ||
| OSCC: Oral squamous cell carcinoma | ||
| Prostate | 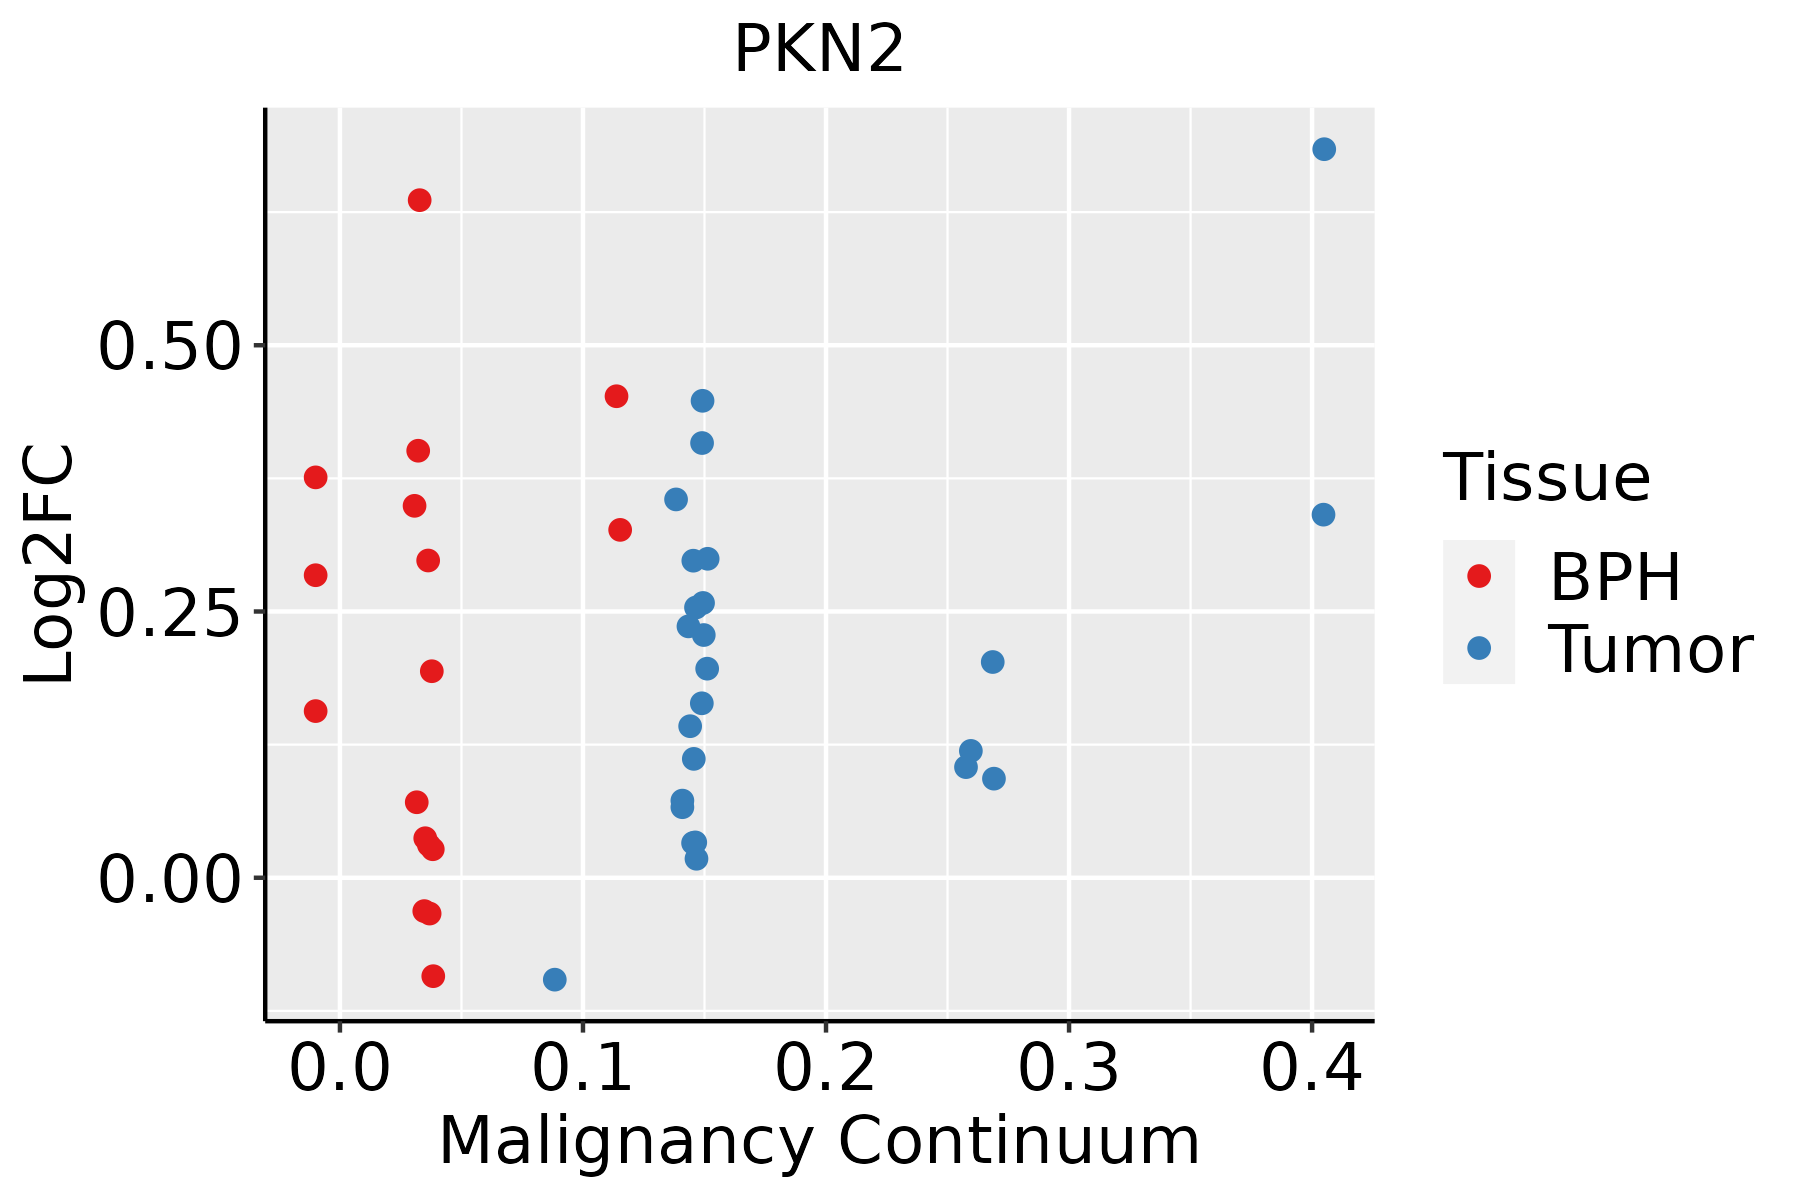 | BPH: Benign Prostatic Hyperplasia |
| Skin | 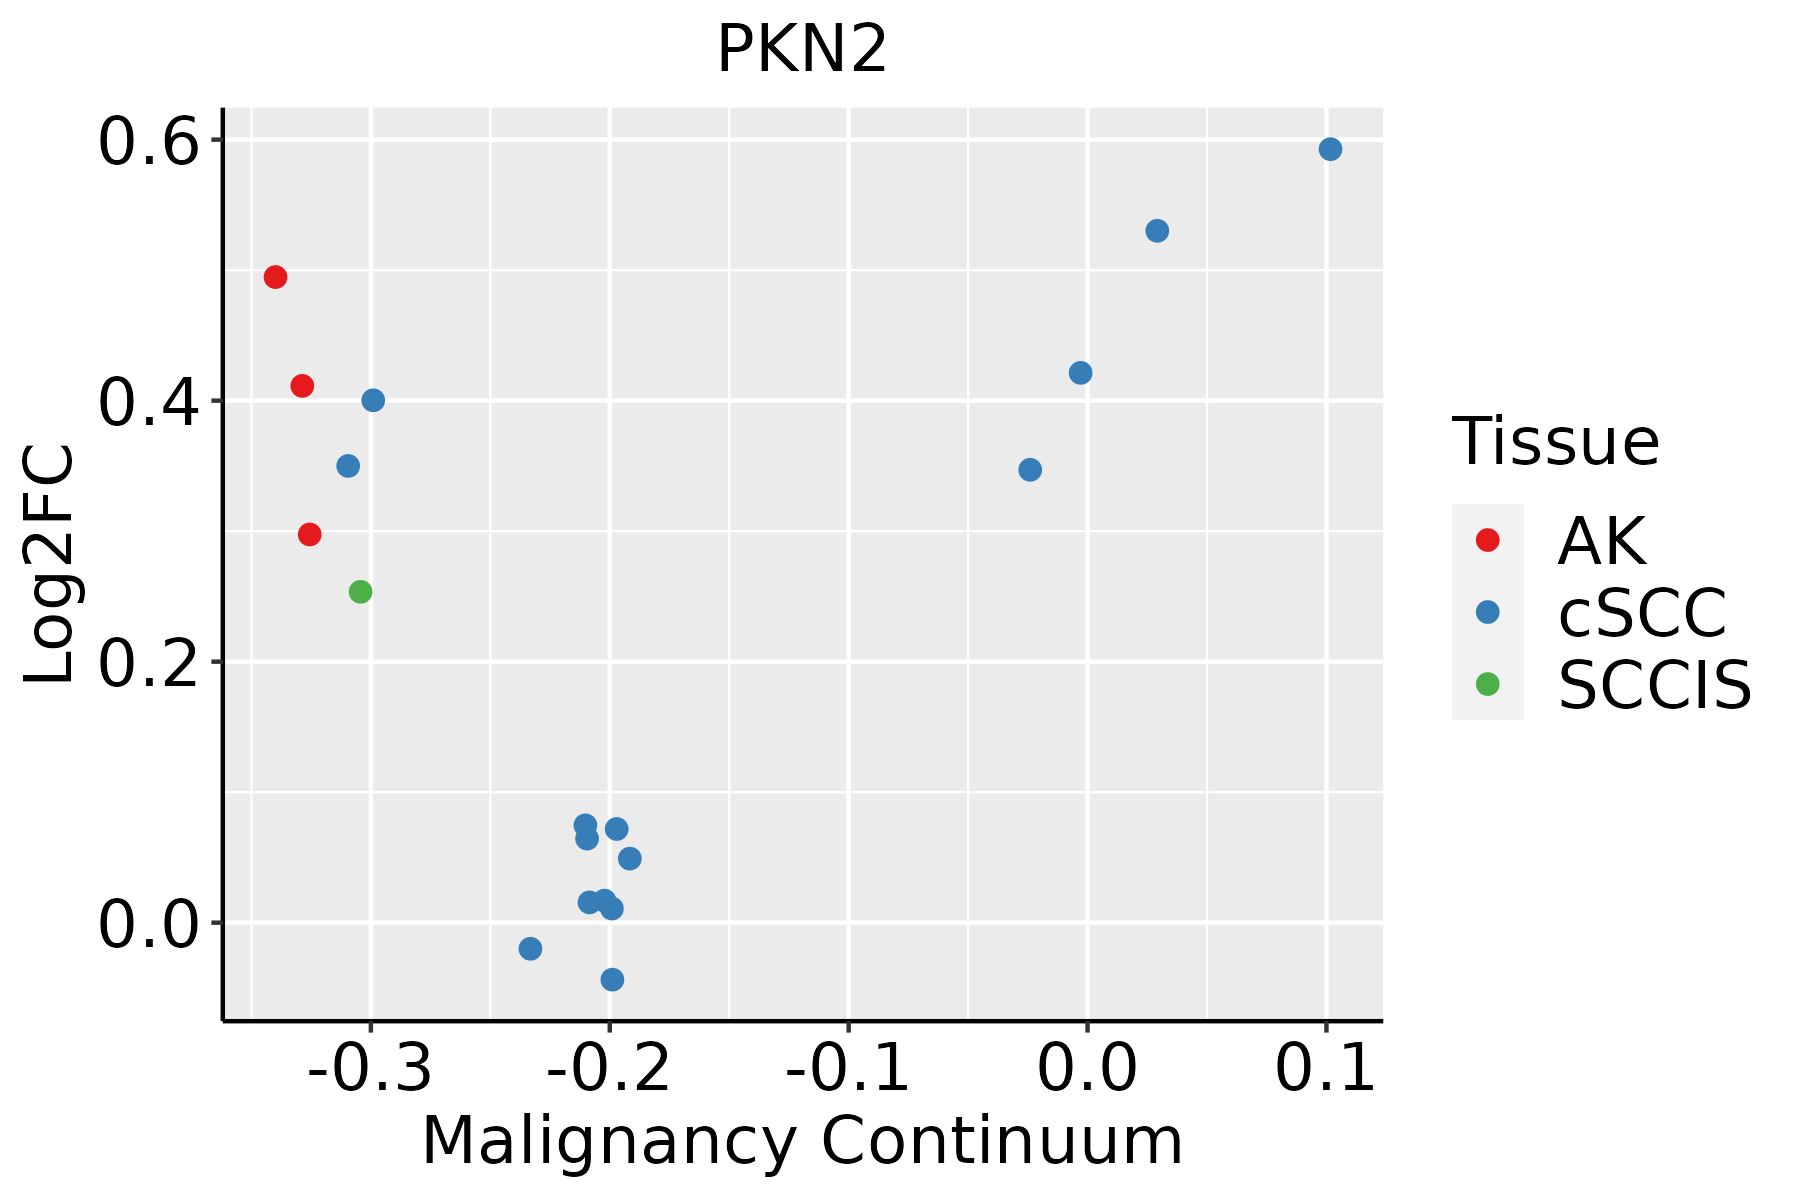 | AK: Actinic keratosis |
| cSCC: Cutaneous squamous cell carcinoma | ||
| SCCIS:squamous cell carcinoma in situ | ||
| Thyroid | 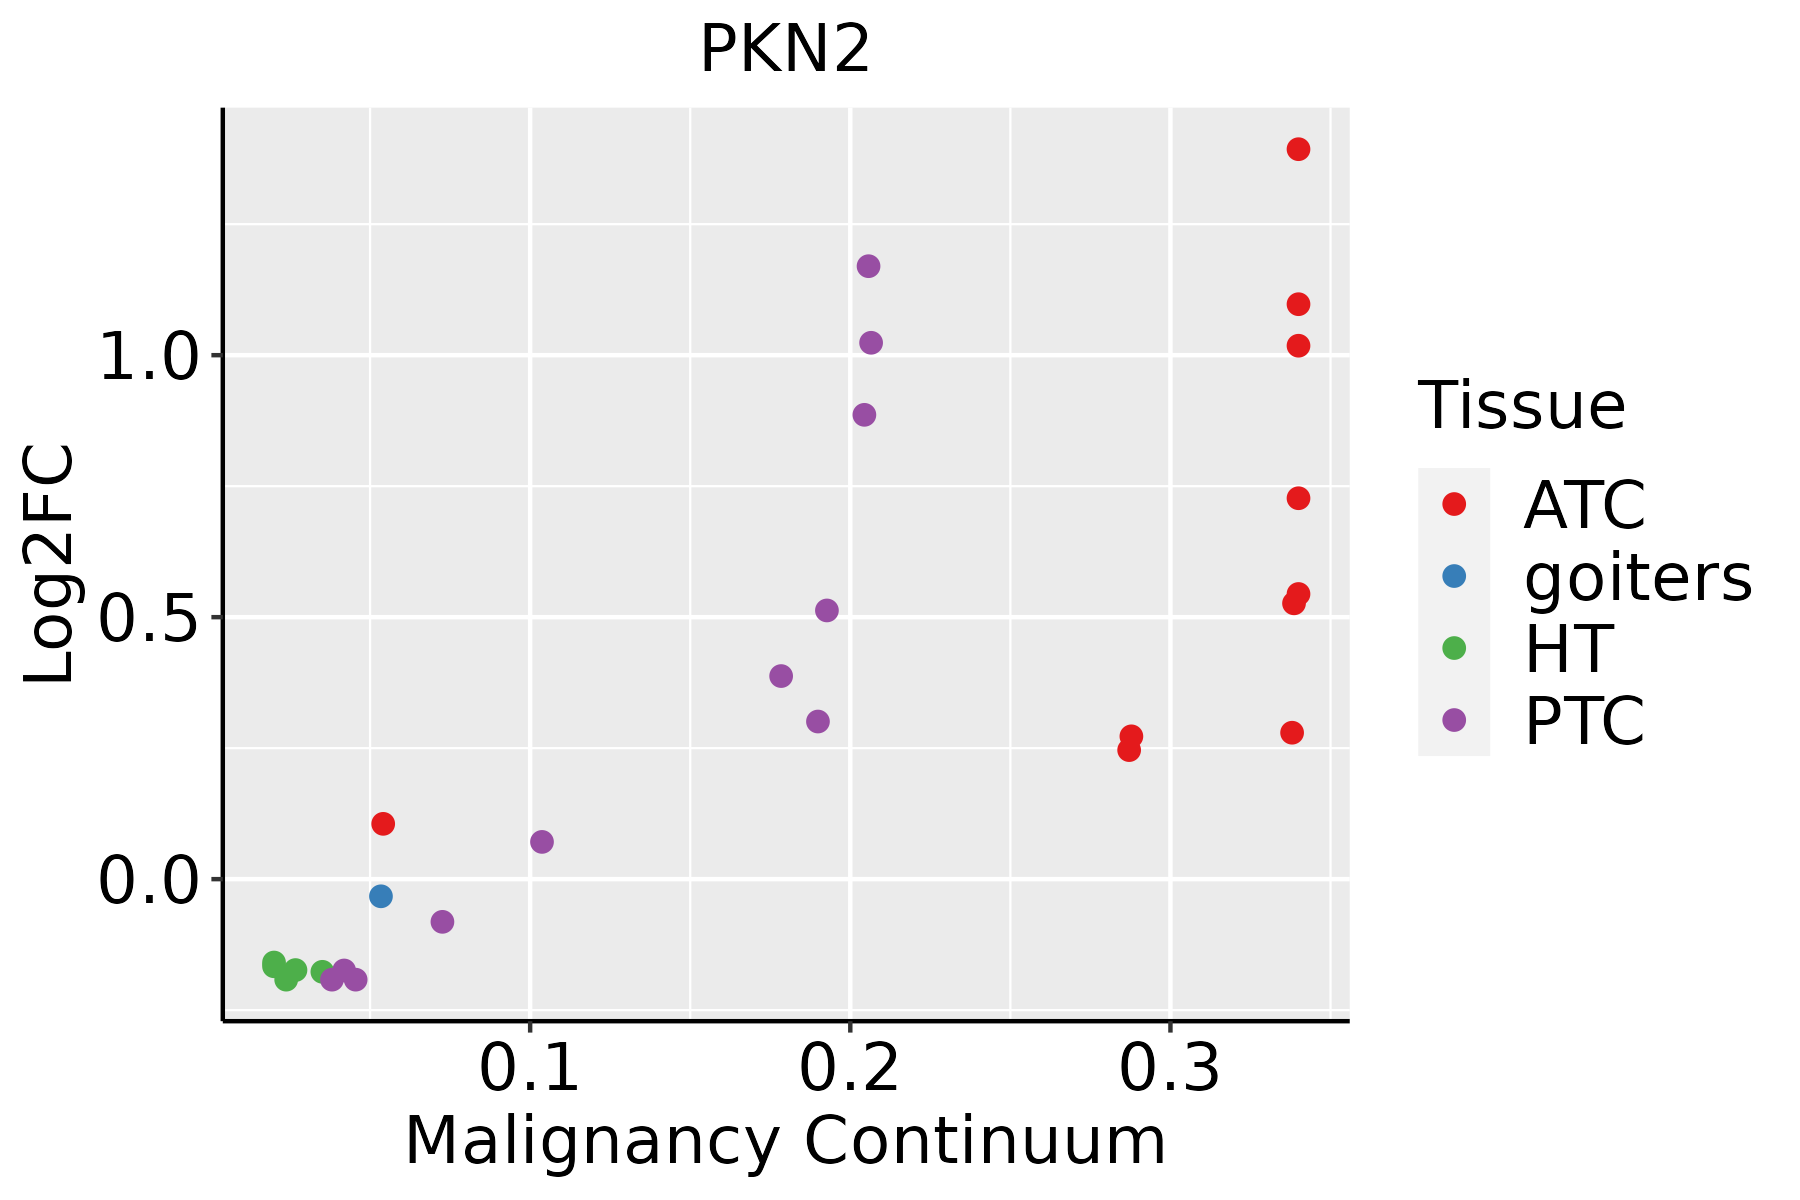 | ATC: Anaplastic thyroid cancer |
| HT: Hashimoto's thyroiditis | ||
| PTC: Papillary thyroid cancer |
| ∗log2FC in expression of this searched gene in stem-like cells from each diseased tissue sample relative to stem-like cells in normal samples in each tissue plotted against the malignancy continuum. Samples are colored based on if they are from different disease stage. |
Top |
Malignant transformation related pathway analysis |
| Find out the enriched GO biological processes and KEGG pathways involved in transition from healthy to precancer to cancer |
| Tissue | Disease Stage | Enriched GO biological Processes |
| Colorectum | AD |  |
| Colorectum | SER |  |
| Colorectum | MSS |  |
| Colorectum | MSI-H |  |
| Colorectum | FAP |  |
| ∗Top 15 enriched GO BP terms are showed in the bar plot of each disease state in each tissue. Each row represents a significant GO biological process which is colored according to the -log10(p.adjust). |
| Page: 1 2 3 4 5 6 7 8 9 |
| GO ID | Tissue | Disease Stage | Description | Gene Ratio | Bg Ratio | pvalue | p.adjust | Count |
| GO:001603210 | Cervix | CC | viral process | 109/2311 | 415/18723 | 5.40e-15 | 6.46e-12 | 109 |
| GO:001905810 | Cervix | CC | viral life cycle | 87/2311 | 317/18723 | 2.20e-13 | 1.20e-10 | 87 |
| GO:009013210 | Cervix | CC | epithelium migration | 90/2311 | 360/18723 | 2.45e-11 | 6.11e-09 | 90 |
| GO:00016679 | Cervix | CC | ameboidal-type cell migration | 110/2311 | 475/18723 | 2.66e-11 | 6.36e-09 | 110 |
| GO:001063110 | Cervix | CC | epithelial cell migration | 89/2311 | 357/18723 | 3.72e-11 | 8.54e-09 | 89 |
| GO:009013010 | Cervix | CC | tissue migration | 90/2311 | 365/18723 | 5.42e-11 | 1.05e-08 | 90 |
| GO:00452169 | Cervix | CC | cell-cell junction organization | 53/2311 | 200/18723 | 3.83e-08 | 2.53e-06 | 53 |
| GO:00343298 | Cervix | CC | cell junction assembly | 88/2311 | 420/18723 | 3.42e-07 | 1.38e-05 | 88 |
| GO:00070439 | Cervix | CC | cell-cell junction assembly | 39/2311 | 146/18723 | 1.86e-06 | 5.94e-05 | 39 |
| GO:001907910 | Cervix | CC | viral genome replication | 35/2311 | 131/18723 | 6.11e-06 | 1.49e-04 | 35 |
| GO:00457876 | Cervix | CC | positive regulation of cell cycle | 66/2311 | 313/18723 | 7.78e-06 | 1.81e-04 | 66 |
| GO:00073466 | Cervix | CC | regulation of mitotic cell cycle | 88/2311 | 457/18723 | 1.26e-05 | 2.60e-04 | 88 |
| GO:00432978 | Cervix | CC | apical junction assembly | 24/2311 | 78/18723 | 1.36e-05 | 2.73e-04 | 24 |
| GO:00459316 | Cervix | CC | positive regulation of mitotic cell cycle | 32/2311 | 121/18723 | 1.88e-05 | 3.47e-04 | 32 |
| GO:00181057 | Cervix | CC | peptidyl-serine phosphorylation | 63/2311 | 315/18723 | 6.65e-05 | 9.47e-04 | 63 |
| GO:005079210 | Cervix | CC | regulation of viral process | 38/2311 | 164/18723 | 8.12e-05 | 1.10e-03 | 38 |
| GO:00900685 | Cervix | CC | positive regulation of cell cycle process | 50/2311 | 236/18723 | 8.25e-05 | 1.11e-03 | 50 |
| GO:00182096 | Cervix | CC | peptidyl-serine modification | 66/2311 | 338/18723 | 9.58e-05 | 1.25e-03 | 66 |
| GO:00513021 | Cervix | CC | regulation of cell division | 39/2311 | 177/18723 | 2.05e-04 | 2.33e-03 | 39 |
| GO:190390010 | Cervix | CC | regulation of viral life cycle | 33/2311 | 148/18723 | 4.86e-04 | 4.76e-03 | 33 |
| Page: 1 2 3 4 5 6 7 8 9 10 11 12 13 14 15 16 17 18 19 20 21 22 23 24 25 |
| Pathway ID | Tissue | Disease Stage | Description | Gene Ratio | Bg Ratio | pvalue | p.adjust | qvalue | Count |
| hsa0513516 | Cervix | CC | Yersinia infection | 39/1267 | 137/8465 | 3.27e-05 | 2.41e-04 | 1.42e-04 | 39 |
| hsa046213 | Cervix | CC | NOD-like receptor signaling pathway | 41/1267 | 186/8465 | 5.90e-03 | 1.95e-02 | 1.15e-02 | 41 |
| hsa0513517 | Cervix | CC | Yersinia infection | 39/1267 | 137/8465 | 3.27e-05 | 2.41e-04 | 1.42e-04 | 39 |
| hsa0462112 | Cervix | CC | NOD-like receptor signaling pathway | 41/1267 | 186/8465 | 5.90e-03 | 1.95e-02 | 1.15e-02 | 41 |
| hsa05135 | Colorectum | AD | Yersinia infection | 58/2092 | 137/8465 | 3.90e-06 | 4.35e-05 | 2.78e-05 | 58 |
| hsa051351 | Colorectum | AD | Yersinia infection | 58/2092 | 137/8465 | 3.90e-06 | 4.35e-05 | 2.78e-05 | 58 |
| hsa051352 | Colorectum | SER | Yersinia infection | 43/1580 | 137/8465 | 2.15e-04 | 2.10e-03 | 1.52e-03 | 43 |
| hsa051353 | Colorectum | SER | Yersinia infection | 43/1580 | 137/8465 | 2.15e-04 | 2.10e-03 | 1.52e-03 | 43 |
| hsa051354 | Colorectum | MSS | Yersinia infection | 53/1875 | 137/8465 | 7.73e-06 | 8.93e-05 | 5.47e-05 | 53 |
| hsa051355 | Colorectum | MSS | Yersinia infection | 53/1875 | 137/8465 | 7.73e-06 | 8.93e-05 | 5.47e-05 | 53 |
| hsa051356 | Colorectum | FAP | Yersinia infection | 43/1404 | 137/8465 | 1.21e-05 | 1.62e-04 | 9.86e-05 | 43 |
| hsa04151 | Colorectum | FAP | PI3K-Akt signaling pathway | 75/1404 | 354/8465 | 1.23e-02 | 4.19e-02 | 2.55e-02 | 75 |
| hsa051357 | Colorectum | FAP | Yersinia infection | 43/1404 | 137/8465 | 1.21e-05 | 1.62e-04 | 9.86e-05 | 43 |
| hsa041511 | Colorectum | FAP | PI3K-Akt signaling pathway | 75/1404 | 354/8465 | 1.23e-02 | 4.19e-02 | 2.55e-02 | 75 |
| hsa051358 | Colorectum | CRC | Yersinia infection | 34/1091 | 137/8465 | 9.71e-05 | 1.57e-03 | 1.07e-03 | 34 |
| hsa041512 | Colorectum | CRC | PI3K-Akt signaling pathway | 64/1091 | 354/8465 | 2.70e-03 | 1.77e-02 | 1.20e-02 | 64 |
| hsa051359 | Colorectum | CRC | Yersinia infection | 34/1091 | 137/8465 | 9.71e-05 | 1.57e-03 | 1.07e-03 | 34 |
| hsa041513 | Colorectum | CRC | PI3K-Akt signaling pathway | 64/1091 | 354/8465 | 2.70e-03 | 1.77e-02 | 1.20e-02 | 64 |
| hsa046219 | Esophagus | HGIN | NOD-like receptor signaling pathway | 45/1383 | 186/8465 | 3.40e-03 | 2.54e-02 | 2.02e-02 | 45 |
| hsa0462114 | Esophagus | HGIN | NOD-like receptor signaling pathway | 45/1383 | 186/8465 | 3.40e-03 | 2.54e-02 | 2.02e-02 | 45 |
| Page: 1 2 3 4 |
Top |
Cell-cell communication analysis |
| Identification of potential cell-cell interactions between two cell types and their ligand-receptor pairs for different disease states |
| Ligand | Receptor | LRpair | Pathway | Tissue | Disease Stage |
| Page: 1 |
Top |
Single-cell gene regulatory network inference analysis |
| Find out the significant the regulons (TFs) and the target genes of each regulon across cell types for different disease states |
| TF | Cell Type | Tissue | Disease Stage | Target Gene | RSS | Regulon Activity |
| ∗The dot plots of a searched regulon are shown for all cell subpopulations in each disease state of each tissue based on the regulon specific score inferred using pySCENIC and by calculating the average expression. |
| Page: 1 |
Top |
Somatic mutation of malignant transformation related genes |
| Annotation of somatic variants for genes involved in malignant transformation |
| Hugo Symbol | Variant Class | Variant Classification | dbSNP RS | HGVSc | HGVSp | HGVSp Short | SWISSPROT | BIOTYPE | SIFT | PolyPhen | Tumor Sample Barcode | Tissue | Histology | Sex | Age | Stage | Therapy Types | Drugs | Outcome |
| PKN2 | SNV | Missense_Mutation | c.1450N>A | p.Glu484Lys | p.E484K | Q16513 | protein_coding | deleterious(0) | probably_damaging(0.985) | TCGA-5L-AAT1-01 | Breast | breast invasive carcinoma | Female | <65 | III/IV | Hormone Therapy | letrozol | SD | |
| PKN2 | SNV | Missense_Mutation | rs200905692 | c.2900C>T | p.Ser967Leu | p.S967L | Q16513 | protein_coding | tolerated(0.07) | benign(0.003) | TCGA-AN-A046-01 | Breast | breast invasive carcinoma | Female | >=65 | I/II | Unknown | Unknown | SD |
| PKN2 | SNV | Missense_Mutation | c.164A>C | p.Glu55Ala | p.E55A | Q16513 | protein_coding | tolerated(0.32) | probably_damaging(0.989) | TCGA-AR-A1AU-01 | Breast | breast invasive carcinoma | Female | <65 | III/IV | Chemotherapy | doxorubicin | SD | |
| PKN2 | SNV | Missense_Mutation | c.2692N>T | p.Arg898Trp | p.R898W | Q16513 | protein_coding | deleterious(0) | possibly_damaging(0.727) | TCGA-BH-A0DK-01 | Breast | breast invasive carcinoma | Female | <65 | I/II | Hormone Therapy | tamoxiphen | SD | |
| PKN2 | SNV | Missense_Mutation | c.2479G>A | p.Glu827Lys | p.E827K | Q16513 | protein_coding | deleterious(0) | probably_damaging(0.98) | TCGA-C8-A26Y-01 | Breast | breast invasive carcinoma | Female | >=65 | I/II | Unknown | Unknown | SD | |
| PKN2 | SNV | Missense_Mutation | c.2479N>C | p.Glu827Gln | p.E827Q | Q16513 | protein_coding | deleterious(0) | probably_damaging(0.932) | TCGA-D8-A1JD-01 | Breast | breast invasive carcinoma | Female | <65 | I/II | Chemotherapy | adriamycin | SD | |
| PKN2 | SNV | Missense_Mutation | novel | c.2371N>A | p.Asp791Asn | p.D791N | Q16513 | protein_coding | deleterious(0.01) | probably_damaging(0.971) | TCGA-S3-AA17-01 | Breast | breast invasive carcinoma | Female | <65 | I/II | Hormone Therapy | anastrozole | SD |
| PKN2 | insertion | Frame_Shift_Ins | novel | c.463_464insTCAAGACTAGCCTGGCCAAGATGGTGAAACC | p.Ala155ValfsTer57 | p.A155Vfs*57 | Q16513 | protein_coding | TCGA-A2-A0EY-01 | Breast | breast invasive carcinoma | Female | <65 | I/II | Chemotherapy | adriamycin | SD | ||
| PKN2 | insertion | Frame_Shift_Ins | novel | c.232_233insACATACAAAT | p.Ser78AsnfsTer17 | p.S78Nfs*17 | Q16513 | protein_coding | TCGA-AC-A3QQ-01 | Breast | breast invasive carcinoma | Female | <65 | I/II | Unknown | Unknown | SD | ||
| PKN2 | insertion | Frame_Shift_Ins | novel | c.1148_1149insC | p.Leu384SerfsTer5 | p.L384Sfs*5 | Q16513 | protein_coding | TCGA-AC-A3QQ-01 | Breast | breast invasive carcinoma | Female | <65 | I/II | Unknown | Unknown | SD |
| Page: 1 2 3 4 5 6 7 8 9 10 11 12 |
Top |
Related drugs of malignant transformation related genes |
| Identification of chemicals and drugs interact with genes involved in malignant transfromation |
| (DGIdb 4.0) |
| Entrez ID | Symbol | Category | Interaction Types | Drug Claim Name | Drug Name | PMIDs |
| 5586 | PKN2 | DRUGGABLE GENOME, KINASE, ENZYME, SERINE THREONINE KINASE | PF-562271 | PF-00562271 | ||
| 5586 | PKN2 | DRUGGABLE GENOME, KINASE, ENZYME, SERINE THREONINE KINASE | ERLOTINIB | ERLOTINIB | ||
| 5586 | PKN2 | DRUGGABLE GENOME, KINASE, ENZYME, SERINE THREONINE KINASE | DOVITINIB | DOVITINIB | ||
| 5586 | PKN2 | DRUGGABLE GENOME, KINASE, ENZYME, SERINE THREONINE KINASE | BAY-613606 | CHEMBL541400 | ||
| 5586 | PKN2 | DRUGGABLE GENOME, KINASE, ENZYME, SERINE THREONINE KINASE | inhibitor | 178101973 | ||
| 5586 | PKN2 | DRUGGABLE GENOME, KINASE, ENZYME, SERINE THREONINE KINASE | ENTRECTINIB | ENTRECTINIB | ||
| 5586 | PKN2 | DRUGGABLE GENOME, KINASE, ENZYME, SERINE THREONINE KINASE | RG-1530 | RG-1530 | ||
| 5586 | PKN2 | DRUGGABLE GENOME, KINASE, ENZYME, SERINE THREONINE KINASE | ILORASERTIB | ILORASERTIB | ||
| 5586 | PKN2 | DRUGGABLE GENOME, KINASE, ENZYME, SERINE THREONINE KINASE | 681640 | CHEMBL379975 | ||
| 5586 | PKN2 | DRUGGABLE GENOME, KINASE, ENZYME, SERINE THREONINE KINASE | DASATINIB | DASATINIB |
| Page: 1 2 3 |

Copyright 2023-Present -The University of Texas Health Science Center at Houston |