
|
|||||
|
 | |
| |
| |
| |
| |
| |
|
Gene: PKN1 |
Gene summary for PKN1 |
| Gene information | Species | Human | Gene symbol | PKN1 | Gene ID | 5585 |
| Gene name | protein kinase N1 | |
| Gene Alias | DBK | |
| Cytomap | 19p13.12 | |
| Gene Type | protein-coding | GO ID | GO:0001667 | UniProtAcc | Q16512 |
Top |
Malignant transformation analysis |
| Identification of the aberrant gene expression in precancerous and cancerous lesions by comparing the gene expression of stem-like cells in diseased tissues with normal stem cells |
| Entrez ID | Symbol | Replicates | Species | Organ | Tissue | Adj P-value | Log2FC | Malignancy |
| 5585 | PKN1 | LZE7T | Human | Esophagus | ESCC | 6.23e-14 | 3.54e-01 | 0.0667 |
| 5585 | PKN1 | LZE24T | Human | Esophagus | ESCC | 4.98e-03 | 1.12e-01 | 0.0596 |
| 5585 | PKN1 | P4T-E | Human | Esophagus | ESCC | 6.92e-05 | 1.45e-01 | 0.1323 |
| 5585 | PKN1 | P5T-E | Human | Esophagus | ESCC | 3.83e-05 | 1.40e-01 | 0.1327 |
| 5585 | PKN1 | P8T-E | Human | Esophagus | ESCC | 1.69e-13 | 2.40e-01 | 0.0889 |
| 5585 | PKN1 | P9T-E | Human | Esophagus | ESCC | 4.56e-03 | 1.31e-01 | 0.1131 |
| 5585 | PKN1 | P10T-E | Human | Esophagus | ESCC | 2.18e-06 | 1.23e-01 | 0.116 |
| 5585 | PKN1 | P12T-E | Human | Esophagus | ESCC | 1.28e-07 | 8.97e-02 | 0.1122 |
| 5585 | PKN1 | P15T-E | Human | Esophagus | ESCC | 1.70e-03 | 1.41e-01 | 0.1149 |
| 5585 | PKN1 | P16T-E | Human | Esophagus | ESCC | 2.14e-03 | 1.52e-02 | 0.1153 |
| 5585 | PKN1 | P19T-E | Human | Esophagus | ESCC | 8.57e-03 | 3.60e-01 | 0.1662 |
| 5585 | PKN1 | P22T-E | Human | Esophagus | ESCC | 1.89e-07 | 9.56e-02 | 0.1236 |
| 5585 | PKN1 | P23T-E | Human | Esophagus | ESCC | 1.37e-05 | 2.39e-01 | 0.108 |
| 5585 | PKN1 | P28T-E | Human | Esophagus | ESCC | 1.16e-18 | 4.01e-01 | 0.1149 |
| 5585 | PKN1 | P32T-E | Human | Esophagus | ESCC | 2.03e-10 | 1.25e-01 | 0.1666 |
| 5585 | PKN1 | P36T-E | Human | Esophagus | ESCC | 1.08e-03 | 1.24e-01 | 0.1187 |
| 5585 | PKN1 | P38T-E | Human | Esophagus | ESCC | 1.33e-04 | 1.90e-01 | 0.127 |
| 5585 | PKN1 | P39T-E | Human | Esophagus | ESCC | 5.57e-08 | 9.65e-02 | 0.0894 |
| 5585 | PKN1 | P40T-E | Human | Esophagus | ESCC | 1.43e-05 | 1.78e-01 | 0.109 |
| 5585 | PKN1 | P42T-E | Human | Esophagus | ESCC | 6.69e-10 | 1.90e-01 | 0.1175 |
| Page: 1 2 3 |
| Tissue | Expression Dynamics | Abbreviation |
| Esophagus |  | ESCC: Esophageal squamous cell carcinoma |
| HGIN: High-grade intraepithelial neoplasias | ||
| LGIN: Low-grade intraepithelial neoplasias | ||
| Liver | 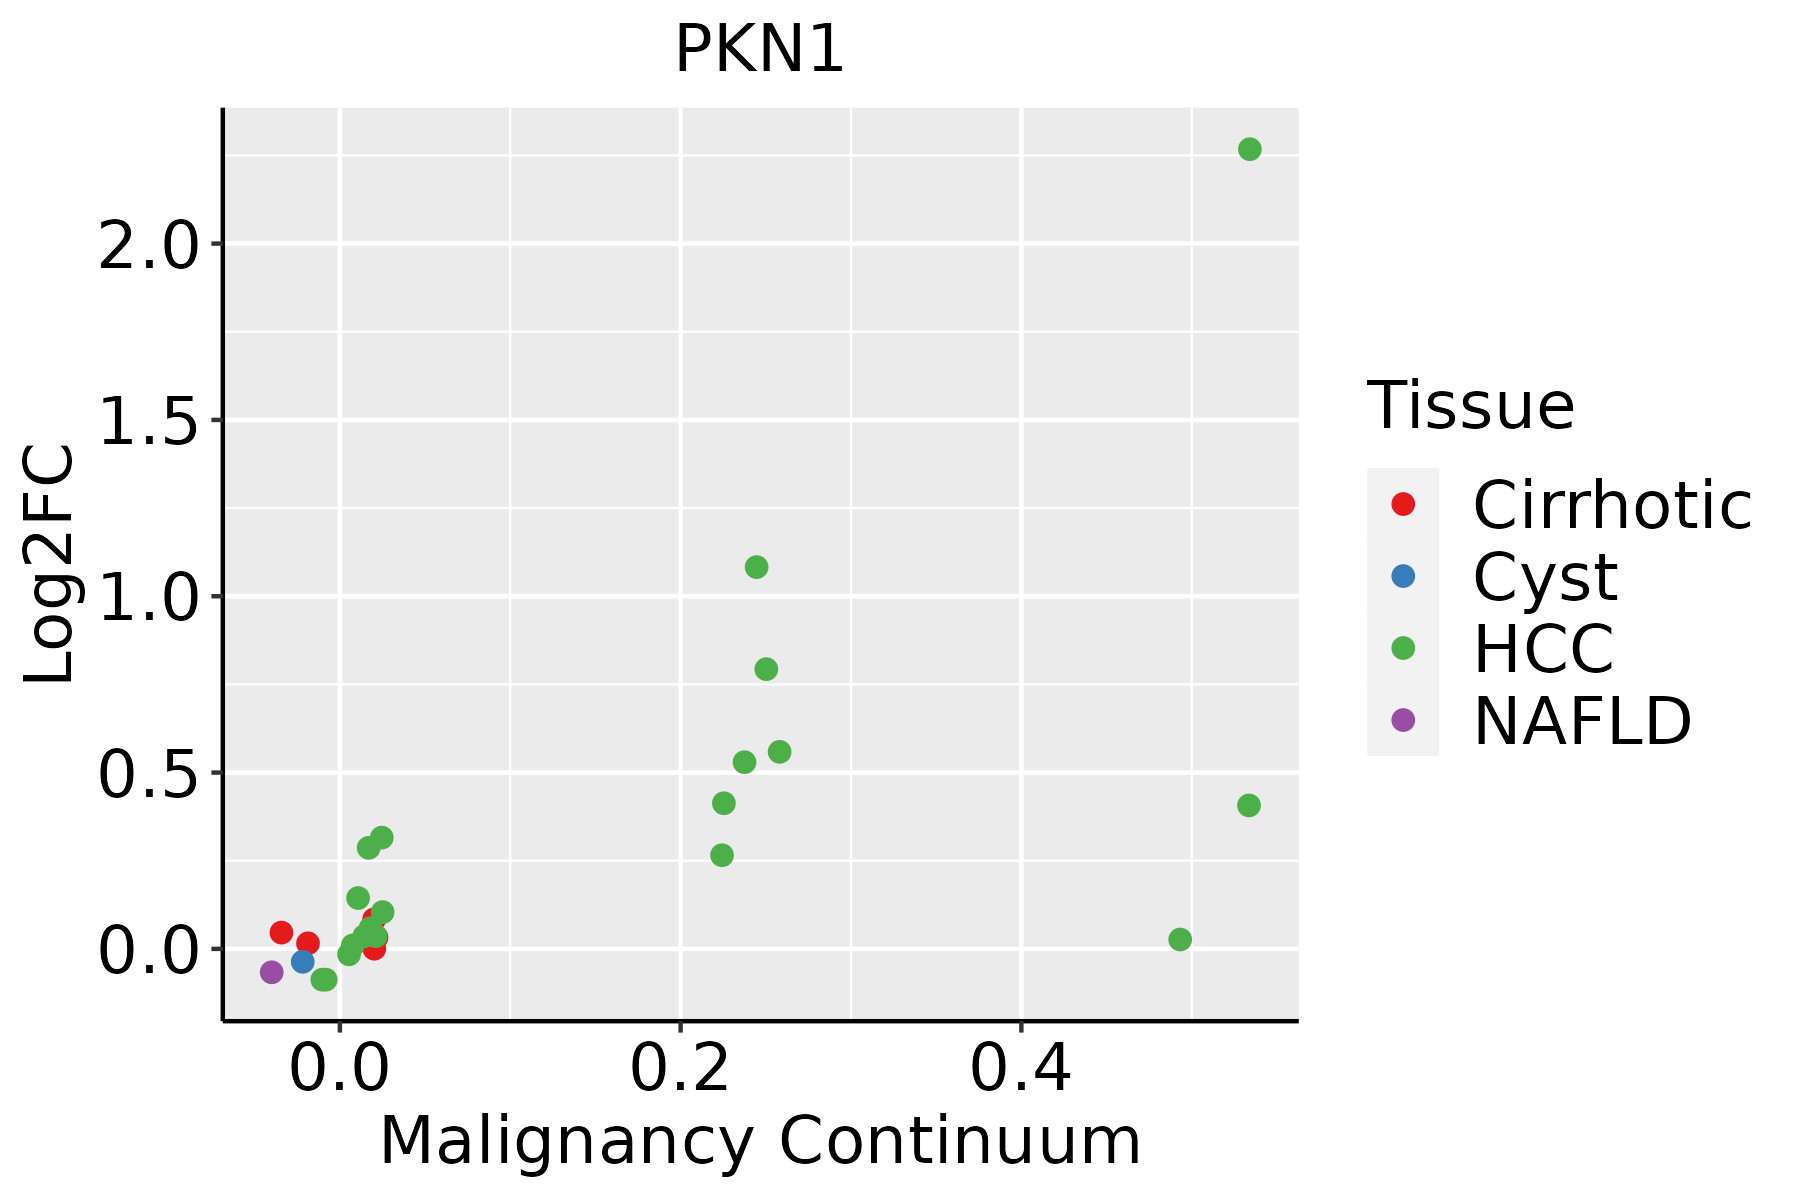 | HCC: Hepatocellular carcinoma |
| NAFLD: Non-alcoholic fatty liver disease | ||
| Thyroid | 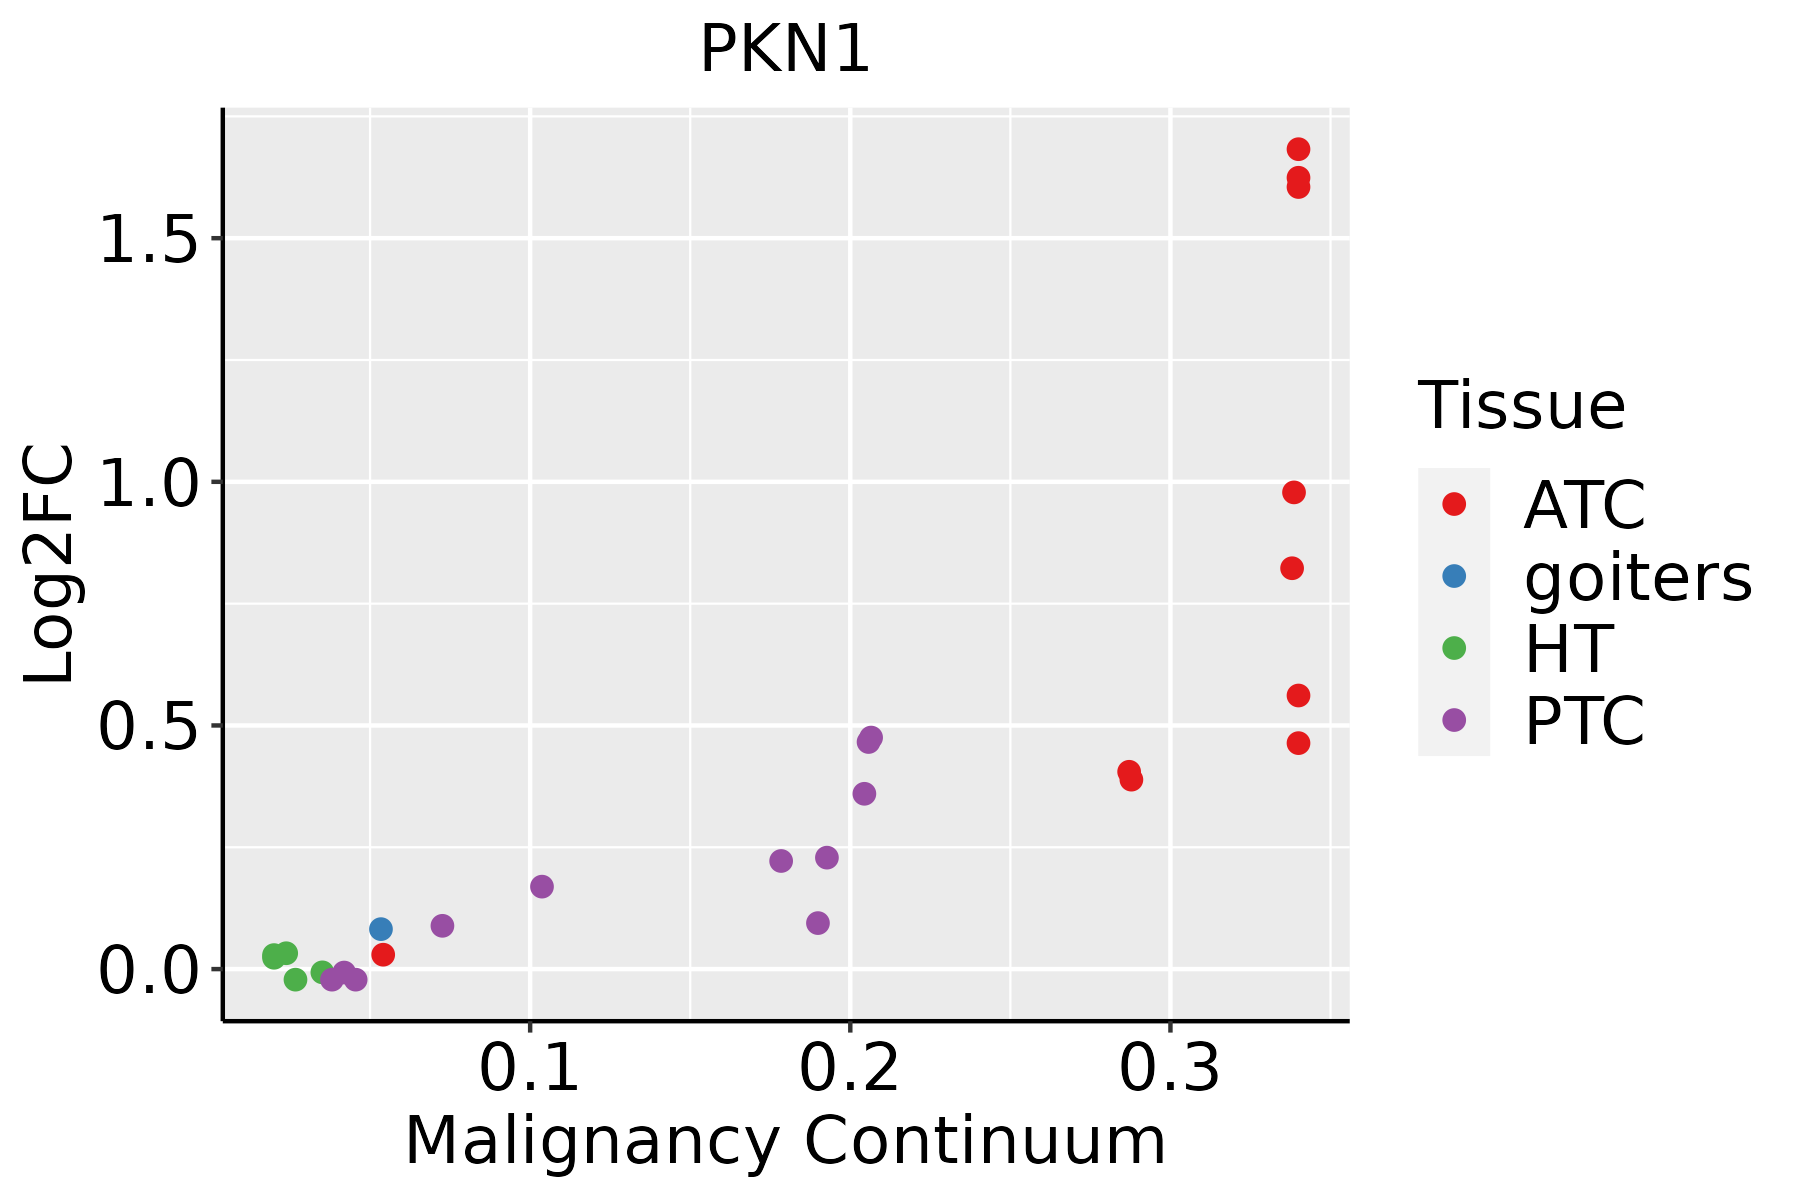 | ATC: Anaplastic thyroid cancer |
| HT: Hashimoto's thyroiditis | ||
| PTC: Papillary thyroid cancer |
| ∗log2FC in expression of this searched gene in stem-like cells from each diseased tissue sample relative to stem-like cells in normal samples in each tissue plotted against the malignancy continuum. Samples are colored based on if they are from different disease stage. |
Top |
Malignant transformation related pathway analysis |
| Find out the enriched GO biological processes and KEGG pathways involved in transition from healthy to precancer to cancer |
| Tissue | Disease Stage | Enriched GO biological Processes |
| Colorectum | AD |  |
| Colorectum | SER |  |
| Colorectum | MSS |  |
| Colorectum | MSI-H |  |
| Colorectum | FAP |  |
| ∗Top 15 enriched GO BP terms are showed in the bar plot of each disease state in each tissue. Each row represents a significant GO biological process which is colored according to the -log10(p.adjust). |
| Page: 1 2 3 4 5 6 7 8 9 |
| GO ID | Tissue | Disease Stage | Description | Gene Ratio | Bg Ratio | pvalue | p.adjust | Count |
| GO:00331438 | Esophagus | ESCC | regulation of intracellular steroid hormone receptor signaling pathway | 50/8552 | 74/18723 | 1.16e-04 | 8.04e-04 | 50 |
| GO:0048545111 | Esophagus | ESCC | response to steroid hormone | 204/8552 | 339/18723 | 4.47e-08 | 8.11e-07 | 204 |
| GO:000646920 | Esophagus | ESCC | negative regulation of protein kinase activity | 140/8552 | 212/18723 | 1.53e-09 | 3.56e-08 | 140 |
| GO:003367319 | Esophagus | ESCC | negative regulation of kinase activity | 154/8552 | 237/18723 | 1.38e-09 | 3.27e-08 | 154 |
| GO:0030522110 | Esophagus | ESCC | intracellular receptor signaling pathway | 170/8552 | 265/18723 | 8.58e-10 | 2.09e-08 | 170 |
| GO:0001933111 | Esophagus | ESCC | negative regulation of protein phosphorylation | 213/8552 | 342/18723 | 3.54e-10 | 9.76e-09 | 213 |
| GO:0042326111 | Esophagus | ESCC | negative regulation of phosphorylation | 237/8552 | 385/18723 | 1.86e-10 | 5.33e-09 | 237 |
| GO:0051348111 | Esophagus | ESCC | negative regulation of transferase activity | 177/8552 | 268/18723 | 1.08e-11 | 4.00e-10 | 177 |
| GO:0045936111 | Esophagus | ESCC | negative regulation of phosphate metabolic process | 273/8552 | 441/18723 | 3.18e-12 | 1.25e-10 | 273 |
| GO:0010563111 | Esophagus | ESCC | negative regulation of phosphorus metabolic process | 274/8552 | 442/18723 | 2.32e-12 | 9.41e-11 | 274 |
| GO:001657015 | Esophagus | ESCC | histone modification | 323/8552 | 463/18723 | 2.61e-26 | 7.88e-24 | 323 |
| GO:0071383110 | Esophagus | ESCC | cellular response to steroid hormone stimulus | 127/8552 | 204/18723 | 1.26e-06 | 1.55e-05 | 127 |
| GO:0048872111 | Esophagus | ESCC | homeostasis of number of cells | 163/8552 | 272/18723 | 1.40e-06 | 1.69e-05 | 163 |
| GO:00182099 | Esophagus | ESCC | peptidyl-serine modification | 196/8552 | 338/18723 | 3.07e-06 | 3.47e-05 | 196 |
| GO:001810515 | Esophagus | ESCC | peptidyl-serine phosphorylation | 184/8552 | 315/18723 | 3.22e-06 | 3.61e-05 | 184 |
| GO:003051819 | Esophagus | ESCC | intracellular steroid hormone receptor signaling pathway | 76/8552 | 116/18723 | 1.25e-05 | 1.15e-04 | 76 |
| GO:004340119 | Esophagus | ESCC | steroid hormone mediated signaling pathway | 87/8552 | 136/18723 | 1.25e-05 | 1.15e-04 | 87 |
| GO:00069707 | Esophagus | ESCC | response to osmotic stress | 57/8552 | 84/18723 | 3.26e-05 | 2.70e-04 | 57 |
| GO:00607655 | Esophagus | ESCC | regulation of androgen receptor signaling pathway | 20/8552 | 28/18723 | 5.23e-03 | 1.97e-02 | 20 |
| GO:001063120 | Esophagus | ESCC | epithelial cell migration | 187/8552 | 357/18723 | 6.05e-03 | 2.23e-02 | 187 |
| Page: 1 2 3 4 5 6 |
| Pathway ID | Tissue | Disease Stage | Description | Gene Ratio | Bg Ratio | pvalue | p.adjust | qvalue | Count |
| hsa05132211 | Esophagus | ESCC | Salmonella infection | 191/4205 | 249/8465 | 6.51e-19 | 5.45e-17 | 2.79e-17 | 191 |
| hsa0513526 | Esophagus | ESCC | Yersinia infection | 100/4205 | 137/8465 | 1.80e-08 | 1.59e-07 | 8.12e-08 | 100 |
| hsa0462122 | Esophagus | ESCC | NOD-like receptor signaling pathway | 116/4205 | 186/8465 | 2.90e-04 | 1.03e-03 | 5.30e-04 | 116 |
| hsa041517 | Esophagus | ESCC | PI3K-Akt signaling pathway | 197/4205 | 354/8465 | 1.24e-02 | 2.83e-02 | 1.45e-02 | 197 |
| hsa05132310 | Esophagus | ESCC | Salmonella infection | 191/4205 | 249/8465 | 6.51e-19 | 5.45e-17 | 2.79e-17 | 191 |
| hsa05135111 | Esophagus | ESCC | Yersinia infection | 100/4205 | 137/8465 | 1.80e-08 | 1.59e-07 | 8.12e-08 | 100 |
| hsa0462132 | Esophagus | ESCC | NOD-like receptor signaling pathway | 116/4205 | 186/8465 | 2.90e-04 | 1.03e-03 | 5.30e-04 | 116 |
| hsa0415114 | Esophagus | ESCC | PI3K-Akt signaling pathway | 197/4205 | 354/8465 | 1.24e-02 | 2.83e-02 | 1.45e-02 | 197 |
| hsa0513242 | Liver | HCC | Salmonella infection | 178/4020 | 249/8465 | 5.90e-15 | 1.98e-13 | 1.10e-13 | 178 |
| hsa0513542 | Liver | HCC | Yersinia infection | 92/4020 | 137/8465 | 2.25e-06 | 2.19e-05 | 1.22e-05 | 92 |
| hsa0513252 | Liver | HCC | Salmonella infection | 178/4020 | 249/8465 | 5.90e-15 | 1.98e-13 | 1.10e-13 | 178 |
| hsa0513552 | Liver | HCC | Yersinia infection | 92/4020 | 137/8465 | 2.25e-06 | 2.19e-05 | 1.22e-05 | 92 |
| Page: 1 |
Top |
Cell-cell communication analysis |
| Identification of potential cell-cell interactions between two cell types and their ligand-receptor pairs for different disease states |
| Ligand | Receptor | LRpair | Pathway | Tissue | Disease Stage |
| Page: 1 |
Top |
Single-cell gene regulatory network inference analysis |
| Find out the significant the regulons (TFs) and the target genes of each regulon across cell types for different disease states |
| TF | Cell Type | Tissue | Disease Stage | Target Gene | RSS | Regulon Activity |
| ∗The dot plots of a searched regulon are shown for all cell subpopulations in each disease state of each tissue based on the regulon specific score inferred using pySCENIC and by calculating the average expression. |
| Page: 1 |
Top |
Somatic mutation of malignant transformation related genes |
| Annotation of somatic variants for genes involved in malignant transformation |
| Hugo Symbol | Variant Class | Variant Classification | dbSNP RS | HGVSc | HGVSp | HGVSp Short | SWISSPROT | BIOTYPE | SIFT | PolyPhen | Tumor Sample Barcode | Tissue | Histology | Sex | Age | Stage | Therapy Types | Drugs | Outcome |
| PKN1 | SNV | Missense_Mutation | c.1546N>G | p.Ile516Val | p.I516V | Q16512 | protein_coding | tolerated(0.15) | benign(0.013) | TCGA-AR-A255-01 | Breast | breast invasive carcinoma | Female | <65 | I/II | Targeted Molecular therapy | trastuzumab | SD | |
| PKN1 | SNV | Missense_Mutation | c.2516G>A | p.Arg839His | p.R839H | Q16512 | protein_coding | deleterious(0.01) | probably_damaging(0.996) | TCGA-BH-A0DD-01 | Breast | breast invasive carcinoma | Male | <65 | I/II | Chemotherapy | docetaxel | CR | |
| PKN1 | SNV | Missense_Mutation | c.2205G>C | p.Gln735His | p.Q735H | Q16512 | protein_coding | deleterious(0) | possibly_damaging(0.808) | TCGA-C8-A1HG-01 | Breast | breast invasive carcinoma | Female | <65 | I/II | Unknown | Unknown | SD | |
| PKN1 | insertion | In_Frame_Ins | novel | c.2613_2614insTGCATGCATGTGCACACTGCCCGTTGT | p.Ala871_Glu872insCysMetHisValHisThrAlaArgCys | p.A871_E872insCMHVHTARC | Q16512 | protein_coding | TCGA-A7-A0CG-01 | Breast | breast invasive carcinoma | Female | >=65 | I/II | Unknown | Unknown | SD | ||
| PKN1 | insertion | Frame_Shift_Ins | novel | c.546_547insAATGCATGGAAGTACATTT | p.Ile183AsnfsTer8 | p.I183Nfs*8 | Q16512 | protein_coding | TCGA-A8-A095-01 | Breast | breast invasive carcinoma | Female | <65 | I/II | Chemotherapy | 5-fluorouracil | CR | ||
| PKN1 | insertion | Frame_Shift_Ins | novel | c.2158_2159insGGCACAGAGAGGTTCAGCAATTTACCCAAGGTCACAC | p.Glu720GlyfsTer84 | p.E720Gfs*84 | Q16512 | protein_coding | TCGA-AO-A0J5-01 | Breast | breast invasive carcinoma | Female | <65 | III/IV | Other, specify in notesBisphosphonate | zoledronic | PD | ||
| PKN1 | SNV | Missense_Mutation | novel | c.1540N>T | p.Met514Leu | p.M514L | Q16512 | protein_coding | tolerated(0.05) | possibly_damaging(0.817) | TCGA-A6-3809-01 | Colorectum | colon adenocarcinoma | Female | >=65 | I/II | Unknown | Unknown | SD |
| PKN1 | SNV | Missense_Mutation | rs371928270 | c.362N>T | p.Ala121Val | p.A121V | Q16512 | protein_coding | tolerated(0.27) | benign(0.015) | TCGA-A6-6780-01 | Colorectum | colon adenocarcinoma | Male | >=65 | I/II | Unknown | Unknown | SD |
| PKN1 | SNV | Missense_Mutation | c.1718C>T | p.Ser573Leu | p.S573L | Q16512 | protein_coding | tolerated(0.29) | benign(0) | TCGA-AA-A010-01 | Colorectum | colon adenocarcinoma | Female | <65 | I/II | Chemotherapy | folinic | CR | |
| PKN1 | SNV | Missense_Mutation | c.2165N>A | p.Arg722His | p.R722H | Q16512 | protein_coding | deleterious(0.02) | benign(0.073) | TCGA-AA-A01S-01 | Colorectum | colon adenocarcinoma | Female | <65 | III/IV | Unknown | Unknown | SD |
| Page: 1 2 3 4 5 6 7 8 9 |
Top |
Related drugs of malignant transformation related genes |
| Identification of chemicals and drugs interact with genes involved in malignant transfromation |
| (DGIdb 4.0) |
| Entrez ID | Symbol | Category | Interaction Types | Drug Claim Name | Drug Name | PMIDs |
| 5585 | PKN1 | DRUGGABLE GENOME, ENZYME, KINASE, SERINE THREONINE KINASE, CLINICALLY ACTIONABLE | inhibitor | 249565832 | ||
| 5585 | PKN1 | DRUGGABLE GENOME, ENZYME, KINASE, SERINE THREONINE KINASE, CLINICALLY ACTIONABLE | inhibitor | 135652717 | STAUROSPORINE | |
| 5585 | PKN1 | DRUGGABLE GENOME, ENZYME, KINASE, SERINE THREONINE KINASE, CLINICALLY ACTIONABLE | inhibitor | 178102304 | TOFACITINIB | |
| 5585 | PKN1 | DRUGGABLE GENOME, ENZYME, KINASE, SERINE THREONINE KINASE, CLINICALLY ACTIONABLE | inhibitor | 249565836 | ||
| 5585 | PKN1 | DRUGGABLE GENOME, ENZYME, KINASE, SERINE THREONINE KINASE, CLINICALLY ACTIONABLE | inhibitor | SOPHORETIN | QUERCETIN | |
| 5585 | PKN1 | DRUGGABLE GENOME, ENZYME, KINASE, SERINE THREONINE KINASE, CLINICALLY ACTIONABLE | INGENOL MEBUTATE |
| Page: 1 |

Copyright 2023-Present -The University of Texas Health Science Center at Houston |