
|
|||||
|
 | |
| |
| |
| |
| |
| |
|
Gene: PKMYT1 |
Gene summary for PKMYT1 |
| Gene information | Species | Human | Gene symbol | PKMYT1 | Gene ID | 9088 |
| Gene name | protein kinase, membrane associated tyrosine/threonine 1 | |
| Gene Alias | MYT1 | |
| Cytomap | 16p13.3 | |
| Gene Type | protein-coding | GO ID | GO:0000003 | UniProtAcc | Q99640 |
Top |
Malignant transformation analysis |
| Identification of the aberrant gene expression in precancerous and cancerous lesions by comparing the gene expression of stem-like cells in diseased tissues with normal stem cells |
| Entrez ID | Symbol | Replicates | Species | Organ | Tissue | Adj P-value | Log2FC | Malignancy |
| 9088 | PKMYT1 | LZE22T | Human | Esophagus | ESCC | 8.43e-03 | 5.33e-01 | 0.068 |
| 9088 | PKMYT1 | P1T-E | Human | Esophagus | ESCC | 1.14e-02 | 5.50e-01 | 0.0875 |
| 9088 | PKMYT1 | P2T-E | Human | Esophagus | ESCC | 2.78e-38 | 1.39e+00 | 0.1177 |
| 9088 | PKMYT1 | P4T-E | Human | Esophagus | ESCC | 7.56e-05 | 2.98e-01 | 0.1323 |
| 9088 | PKMYT1 | P5T-E | Human | Esophagus | ESCC | 5.88e-35 | 7.66e-01 | 0.1327 |
| 9088 | PKMYT1 | P8T-E | Human | Esophagus | ESCC | 8.84e-05 | 2.45e-01 | 0.0889 |
| 9088 | PKMYT1 | P10T-E | Human | Esophagus | ESCC | 3.50e-02 | 7.96e-02 | 0.116 |
| 9088 | PKMYT1 | P12T-E | Human | Esophagus | ESCC | 3.50e-02 | 1.22e-01 | 0.1122 |
| 9088 | PKMYT1 | P15T-E | Human | Esophagus | ESCC | 2.11e-09 | 5.47e-01 | 0.1149 |
| 9088 | PKMYT1 | P16T-E | Human | Esophagus | ESCC | 4.44e-08 | 2.14e-01 | 0.1153 |
| 9088 | PKMYT1 | P17T-E | Human | Esophagus | ESCC | 1.37e-10 | 7.53e-01 | 0.1278 |
| 9088 | PKMYT1 | P19T-E | Human | Esophagus | ESCC | 2.77e-03 | 6.18e-01 | 0.1662 |
| 9088 | PKMYT1 | P21T-E | Human | Esophagus | ESCC | 7.98e-13 | 5.19e-01 | 0.1617 |
| 9088 | PKMYT1 | P22T-E | Human | Esophagus | ESCC | 4.17e-05 | 1.96e-01 | 0.1236 |
| 9088 | PKMYT1 | P24T-E | Human | Esophagus | ESCC | 5.00e-17 | 4.91e-01 | 0.1287 |
| 9088 | PKMYT1 | P26T-E | Human | Esophagus | ESCC | 9.20e-06 | 3.64e-01 | 0.1276 |
| 9088 | PKMYT1 | P27T-E | Human | Esophagus | ESCC | 3.97e-04 | 1.55e-01 | 0.1055 |
| 9088 | PKMYT1 | P28T-E | Human | Esophagus | ESCC | 1.53e-19 | 4.90e-01 | 0.1149 |
| 9088 | PKMYT1 | P30T-E | Human | Esophagus | ESCC | 1.18e-02 | 8.48e-01 | 0.137 |
| 9088 | PKMYT1 | P31T-E | Human | Esophagus | ESCC | 7.31e-14 | 4.93e-01 | 0.1251 |
| Page: 1 2 3 4 |
| Tissue | Expression Dynamics | Abbreviation |
| Esophagus |  | ESCC: Esophageal squamous cell carcinoma |
| HGIN: High-grade intraepithelial neoplasias | ||
| LGIN: Low-grade intraepithelial neoplasias | ||
| Oral Cavity | 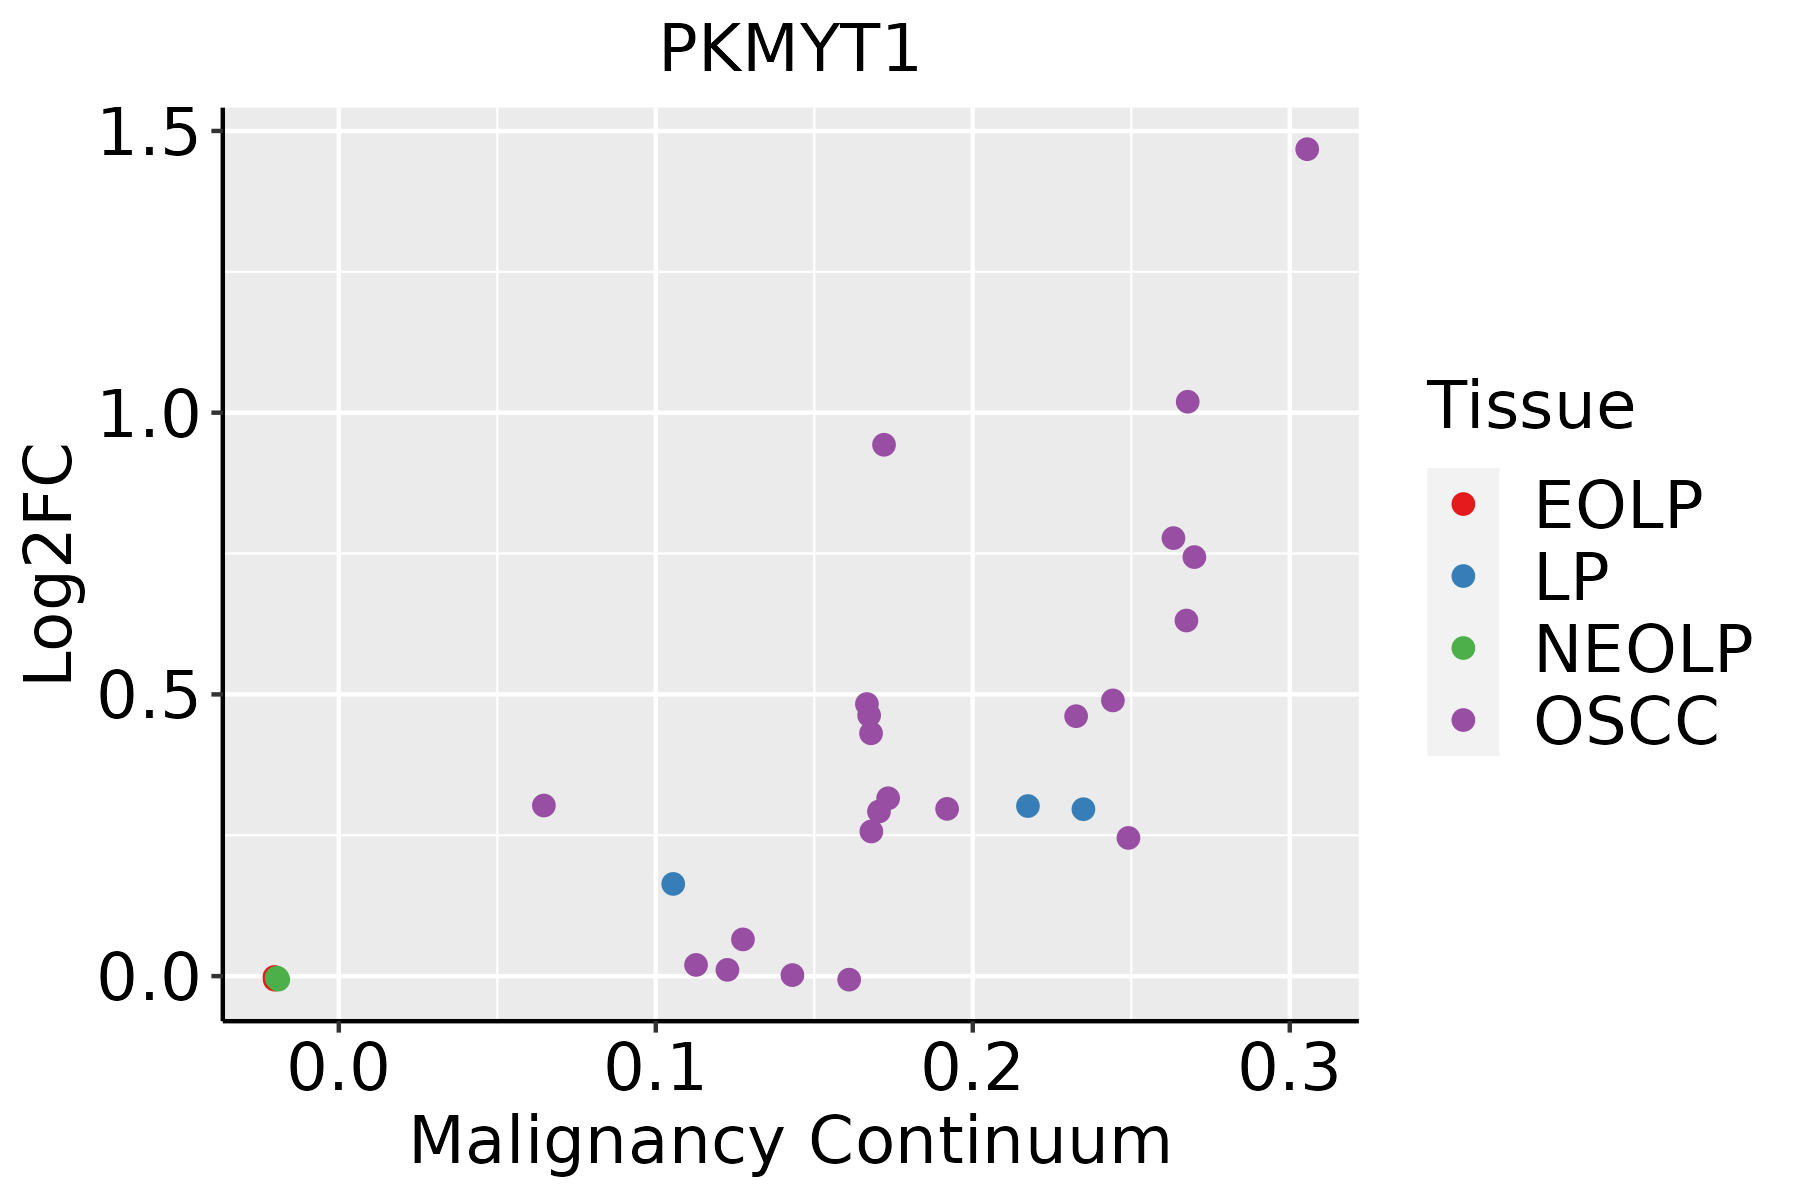 | EOLP: Erosive Oral lichen planus |
| LP: leukoplakia | ||
| NEOLP: Non-erosive oral lichen planus | ||
| OSCC: Oral squamous cell carcinoma | ||
| Skin | 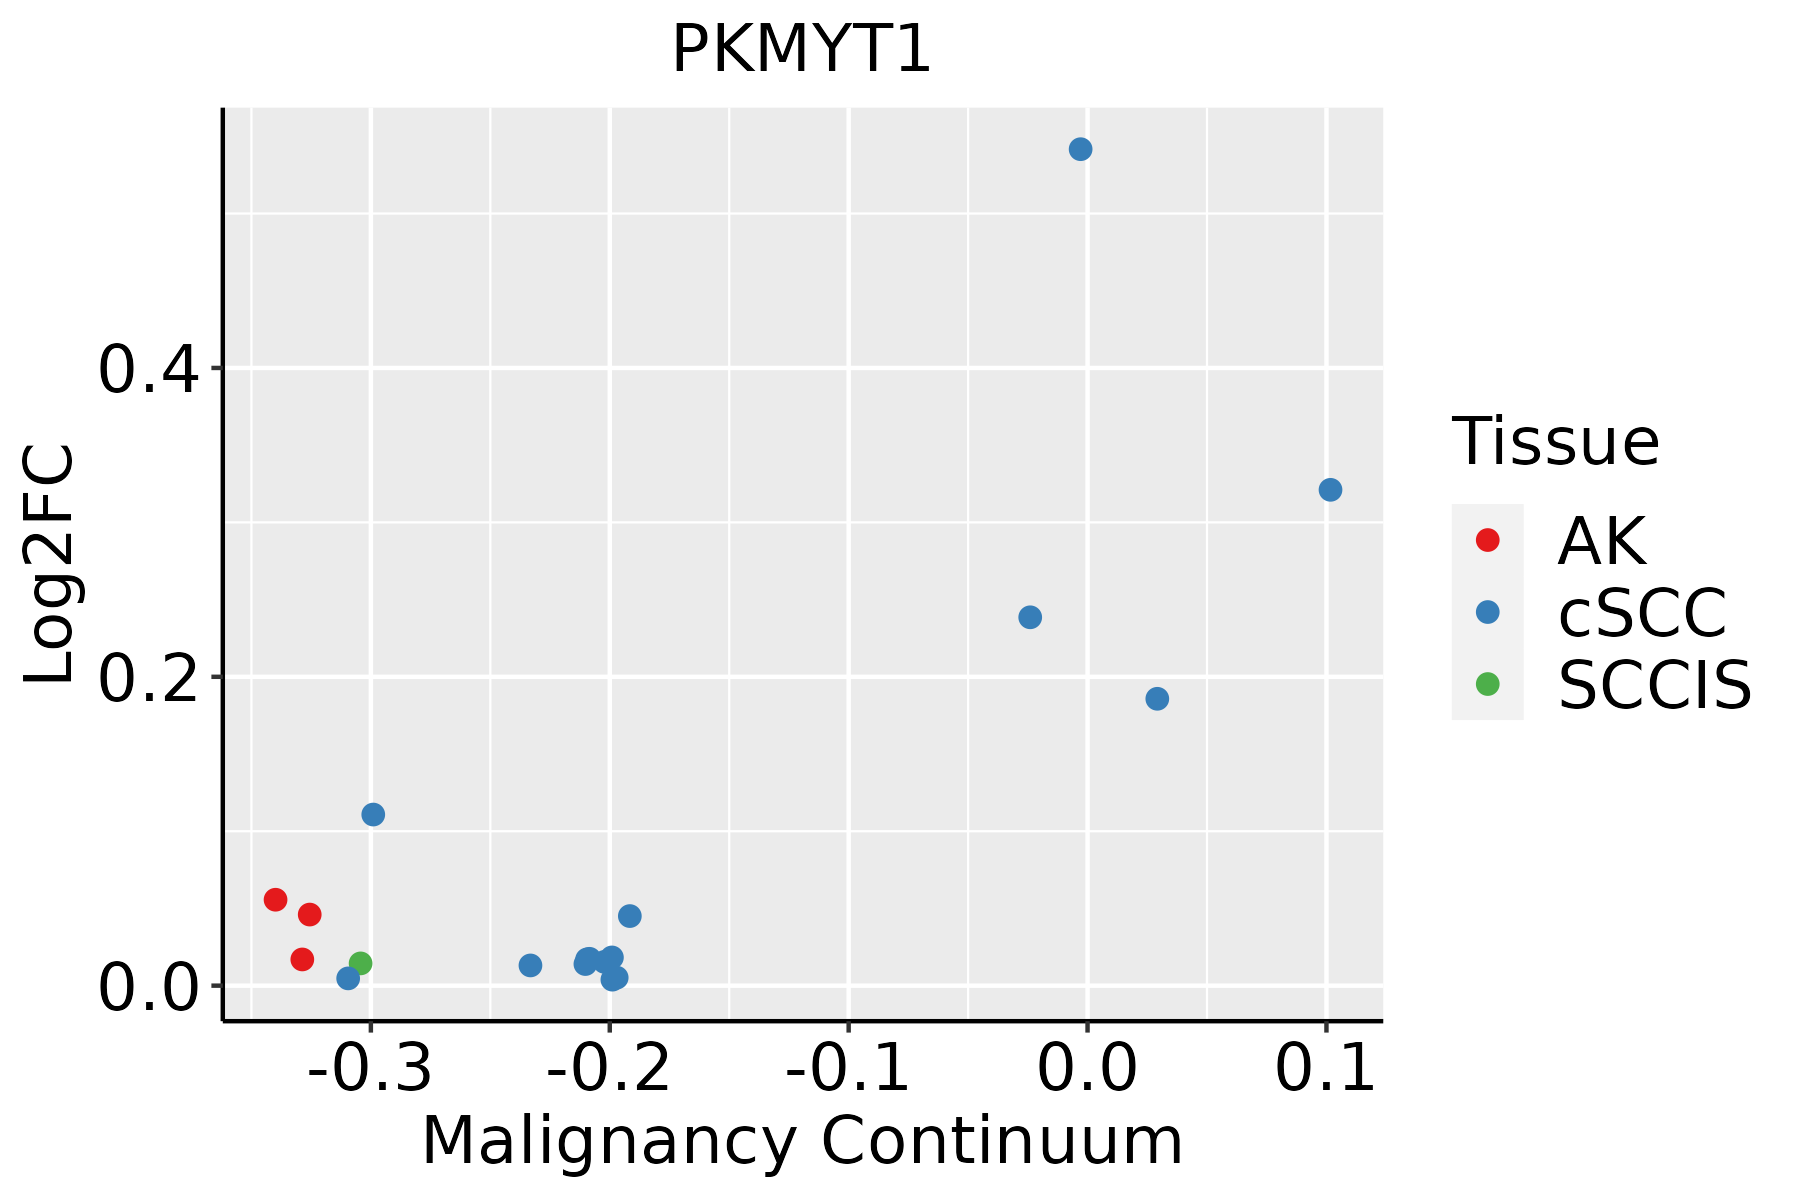 | AK: Actinic keratosis |
| cSCC: Cutaneous squamous cell carcinoma | ||
| SCCIS:squamous cell carcinoma in situ | ||
| Thyroid | 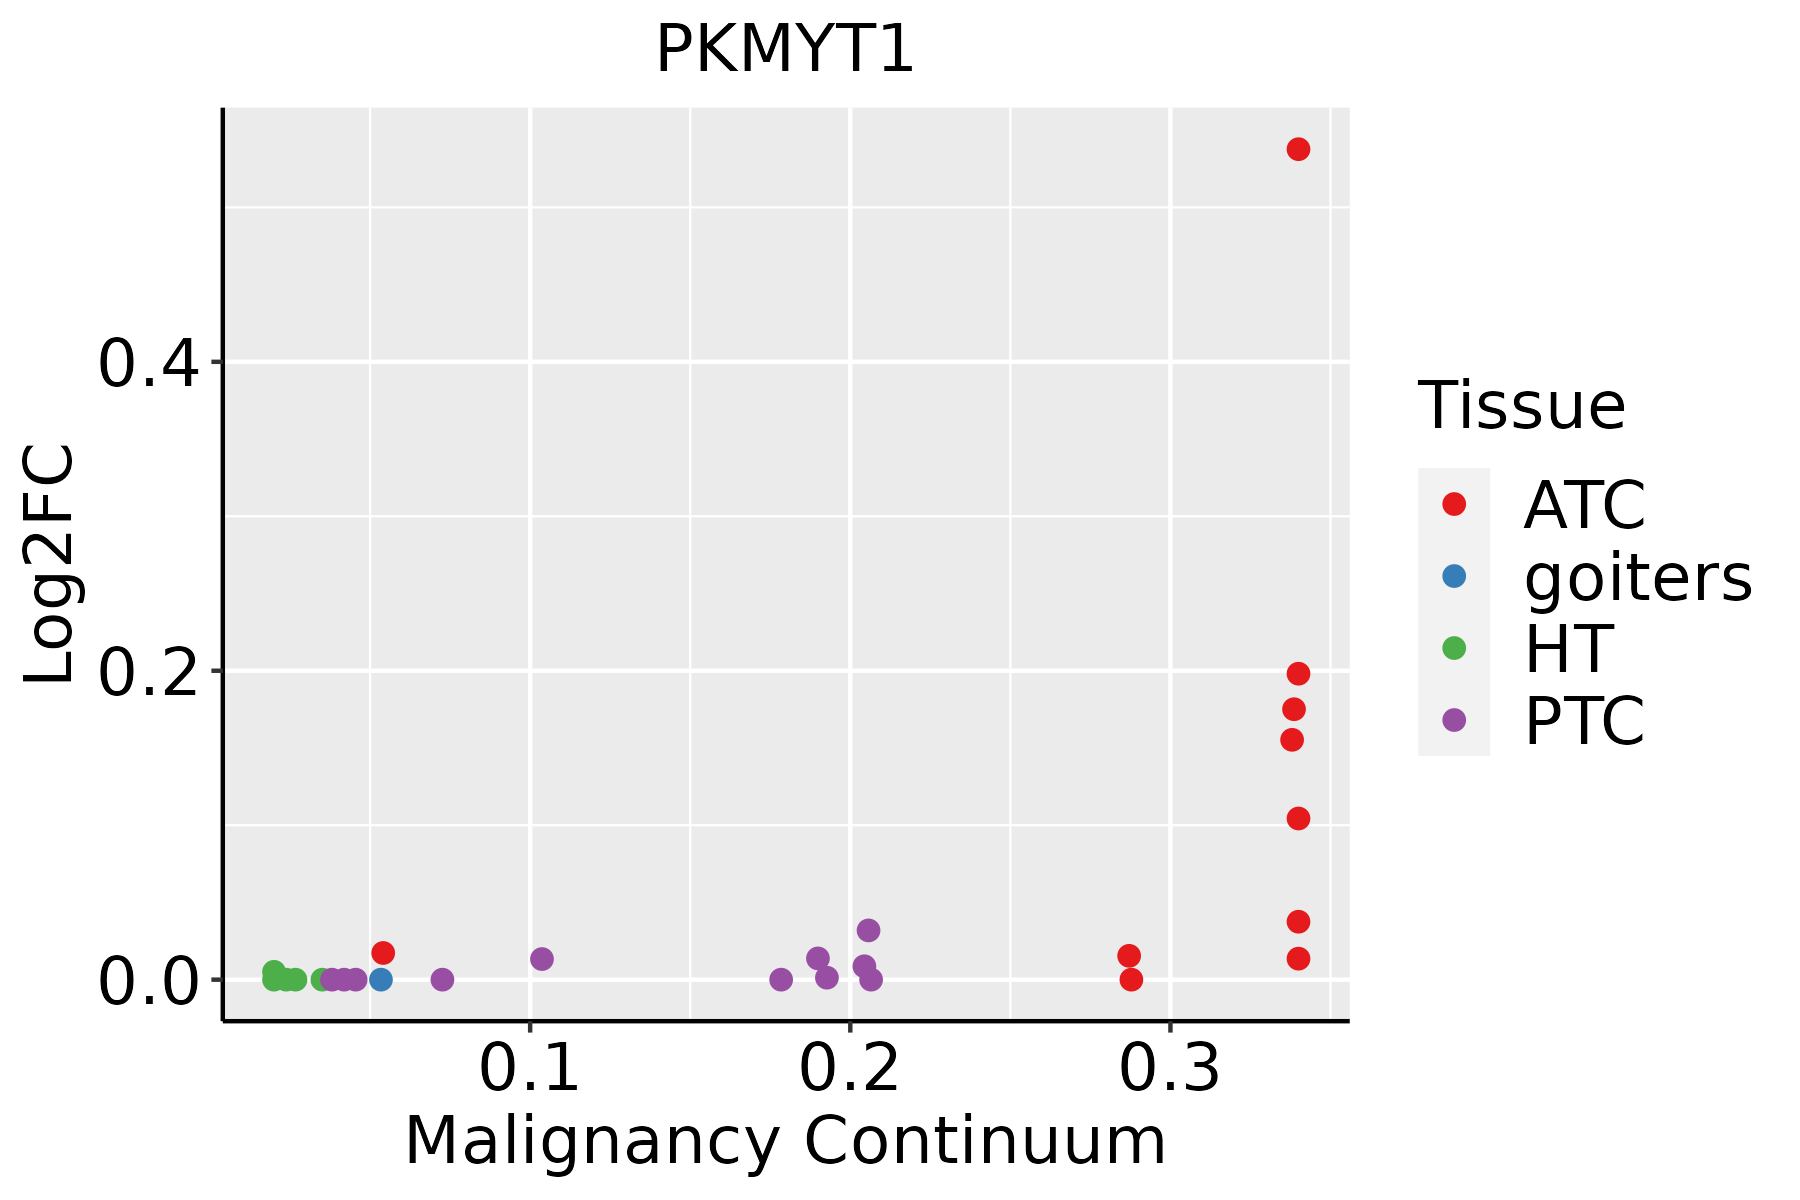 | ATC: Anaplastic thyroid cancer |
| HT: Hashimoto's thyroiditis | ||
| PTC: Papillary thyroid cancer |
| ∗log2FC in expression of this searched gene in stem-like cells from each diseased tissue sample relative to stem-like cells in normal samples in each tissue plotted against the malignancy continuum. Samples are colored based on if they are from different disease stage. |
Top |
Malignant transformation related pathway analysis |
| Find out the enriched GO biological processes and KEGG pathways involved in transition from healthy to precancer to cancer |
| Tissue | Disease Stage | Enriched GO biological Processes |
| Colorectum | AD |  |
| Colorectum | SER |  |
| Colorectum | MSS |  |
| Colorectum | MSI-H |  |
| Colorectum | FAP |  |
| ∗Top 15 enriched GO BP terms are showed in the bar plot of each disease state in each tissue. Each row represents a significant GO biological process which is colored according to the -log10(p.adjust). |
| Page: 1 2 3 4 5 6 7 8 9 |
| GO ID | Tissue | Disease Stage | Description | Gene Ratio | Bg Ratio | pvalue | p.adjust | Count |
| GO:014001414 | Esophagus | ESCC | mitotic nuclear division | 218/8552 | 287/18723 | 6.17e-26 | 1.78e-23 | 218 |
| GO:004477216 | Esophagus | ESCC | mitotic cell cycle phase transition | 281/8552 | 424/18723 | 4.63e-18 | 4.45e-16 | 281 |
| GO:000734615 | Esophagus | ESCC | regulation of mitotic cell cycle | 293/8552 | 457/18723 | 8.00e-16 | 5.64e-14 | 293 |
| GO:00482853 | Esophagus | ESCC | organelle fission | 301/8552 | 488/18723 | 4.64e-13 | 2.12e-11 | 301 |
| GO:007190016 | Esophagus | ESCC | regulation of protein serine/threonine kinase activity | 227/8552 | 359/18723 | 1.12e-11 | 4.10e-10 | 227 |
| GO:00002802 | Esophagus | ESCC | nuclear division | 270/8552 | 439/18723 | 1.17e-11 | 4.24e-10 | 270 |
| GO:00448394 | Esophagus | ESCC | cell cycle G2/M phase transition | 103/8552 | 148/18723 | 3.09e-09 | 6.67e-08 | 103 |
| GO:00000864 | Esophagus | ESCC | G2/M transition of mitotic cell cycle | 96/8552 | 137/18723 | 6.00e-09 | 1.23e-07 | 96 |
| GO:00070883 | Esophagus | ESCC | regulation of mitotic nuclear division | 78/8552 | 110/18723 | 6.96e-08 | 1.21e-06 | 78 |
| GO:19040294 | Esophagus | ESCC | regulation of cyclin-dependent protein kinase activity | 69/8552 | 98/18723 | 6.04e-07 | 7.91e-06 | 69 |
| GO:00000794 | Esophagus | ESCC | regulation of cyclin-dependent protein serine/threonine kinase activity | 66/8552 | 94/18723 | 1.24e-06 | 1.53e-05 | 66 |
| GO:00517831 | Esophagus | ESCC | regulation of nuclear division | 90/8552 | 139/18723 | 4.30e-06 | 4.60e-05 | 90 |
| GO:01400145 | Oral cavity | OSCC | mitotic nuclear division | 191/7305 | 287/18723 | 1.99e-21 | 3.70e-19 | 191 |
| GO:00447728 | Oral cavity | OSCC | mitotic cell cycle phase transition | 255/7305 | 424/18723 | 5.29e-19 | 6.98e-17 | 255 |
| GO:00073469 | Oral cavity | OSCC | regulation of mitotic cell cycle | 266/7305 | 457/18723 | 3.87e-17 | 3.41e-15 | 266 |
| GO:00482852 | Oral cavity | OSCC | organelle fission | 265/7305 | 488/18723 | 3.22e-12 | 1.27e-10 | 265 |
| GO:007190010 | Oral cavity | OSCC | regulation of protein serine/threonine kinase activity | 201/7305 | 359/18723 | 3.90e-11 | 1.27e-09 | 201 |
| GO:00002801 | Oral cavity | OSCC | nuclear division | 237/7305 | 439/18723 | 9.62e-11 | 2.90e-09 | 237 |
| GO:00000863 | Oral cavity | OSCC | G2/M transition of mitotic cell cycle | 84/7305 | 137/18723 | 9.99e-08 | 1.70e-06 | 84 |
| GO:00448393 | Oral cavity | OSCC | cell cycle G2/M phase transition | 89/7305 | 148/18723 | 1.51e-07 | 2.51e-06 | 89 |
| Page: 1 2 3 |
| Pathway ID | Tissue | Disease Stage | Description | Gene Ratio | Bg Ratio | pvalue | p.adjust | qvalue | Count |
| hsa0411023 | Esophagus | ESCC | Cell cycle | 126/4205 | 157/8465 | 1.34e-15 | 5.60e-14 | 2.87e-14 | 126 |
| hsa041146 | Esophagus | ESCC | Oocyte meiosis | 77/4205 | 131/8465 | 2.19e-02 | 4.80e-02 | 2.46e-02 | 77 |
| hsa0411033 | Esophagus | ESCC | Cell cycle | 126/4205 | 157/8465 | 1.34e-15 | 5.60e-14 | 2.87e-14 | 126 |
| hsa0411411 | Esophagus | ESCC | Oocyte meiosis | 77/4205 | 131/8465 | 2.19e-02 | 4.80e-02 | 2.46e-02 | 77 |
| hsa041108 | Oral cavity | OSCC | Cell cycle | 118/3704 | 157/8465 | 7.15e-16 | 2.66e-14 | 1.35e-14 | 118 |
| hsa04114 | Oral cavity | OSCC | Oocyte meiosis | 74/3704 | 131/8465 | 2.13e-03 | 5.75e-03 | 2.92e-03 | 74 |
| hsa0411015 | Oral cavity | OSCC | Cell cycle | 118/3704 | 157/8465 | 7.15e-16 | 2.66e-14 | 1.35e-14 | 118 |
| hsa041141 | Oral cavity | OSCC | Oocyte meiosis | 74/3704 | 131/8465 | 2.13e-03 | 5.75e-03 | 2.92e-03 | 74 |
| Page: 1 |
Top |
Cell-cell communication analysis |
| Identification of potential cell-cell interactions between two cell types and their ligand-receptor pairs for different disease states |
| Ligand | Receptor | LRpair | Pathway | Tissue | Disease Stage |
| Page: 1 |
Top |
Single-cell gene regulatory network inference analysis |
| Find out the significant the regulons (TFs) and the target genes of each regulon across cell types for different disease states |
| TF | Cell Type | Tissue | Disease Stage | Target Gene | RSS | Regulon Activity |
| ∗The dot plots of a searched regulon are shown for all cell subpopulations in each disease state of each tissue based on the regulon specific score inferred using pySCENIC and by calculating the average expression. |
| Page: 1 |
Top |
Somatic mutation of malignant transformation related genes |
| Annotation of somatic variants for genes involved in malignant transformation |
| Hugo Symbol | Variant Class | Variant Classification | dbSNP RS | HGVSc | HGVSp | HGVSp Short | SWISSPROT | BIOTYPE | SIFT | PolyPhen | Tumor Sample Barcode | Tissue | Histology | Sex | Age | Stage | Therapy Types | Drugs | Outcome |
| PKMYT1 | SNV | Missense_Mutation | rs547455847 | c.469N>A | p.Glu157Lys | p.E157K | Q99640 | protein_coding | deleterious(0) | probably_damaging(1) | TCGA-AC-A3BB-01 | Breast | breast invasive carcinoma | Female | <65 | III/IV | Chemotherapy | cytoxan | CR |
| PKMYT1 | SNV | Missense_Mutation | c.568T>C | p.Cys190Arg | p.C190R | Q99640 | protein_coding | deleterious(0) | probably_damaging(1) | TCGA-D8-A1XK-01 | Breast | breast invasive carcinoma | Female | <65 | I/II | Chemotherapy | doxorubicine+cyclophosphamide | SD | |
| PKMYT1 | SNV | Missense_Mutation | novel | c.1004N>C | p.Val335Ala | p.V335A | Q99640 | protein_coding | deleterious(0.02) | probably_damaging(0.969) | TCGA-VS-A958-01 | Cervix | cervical & endocervical cancer | Female | <65 | I/II | Chemotherapy | cisplatin | CR |
| PKMYT1 | insertion | In_Frame_Ins | novel | c.967_968insCAA | p.Glu323delinsAlaLys | p.E323delinsAK | Q99640 | protein_coding | TCGA-DS-A1OA-01 | Cervix | cervical & endocervical cancer | Female | >=65 | I/II | Chemotherapy | carboplatin | PD | ||
| PKMYT1 | SNV | Missense_Mutation | c.68N>A | p.Gly23Asp | p.G23D | Q99640 | protein_coding | tolerated(0.58) | benign(0.273) | TCGA-A6-6653-01 | Colorectum | colon adenocarcinoma | Male | >=65 | I/II | Unknown | Unknown | SD | |
| PKMYT1 | SNV | Missense_Mutation | rs761362077 | c.860N>T | p.Ala287Val | p.A287V | Q99640 | protein_coding | deleterious(0) | possibly_damaging(0.528) | TCGA-AU-6004-01 | Colorectum | colon adenocarcinoma | Female | >=65 | I/II | Unknown | Unknown | SD |
| PKMYT1 | SNV | Missense_Mutation | c.467C>T | p.Ala156Val | p.A156V | Q99640 | protein_coding | tolerated(0.12) | benign(0.083) | TCGA-CK-4951-01 | Colorectum | colon adenocarcinoma | Female | >=65 | I/II | Unknown | Unknown | PD | |
| PKMYT1 | SNV | Missense_Mutation | rs747789800 | c.98G>A | p.Arg33His | p.R33H | Q99640 | protein_coding | tolerated(0.11) | possibly_damaging(0.869) | TCGA-NH-A5IV-01 | Colorectum | colon adenocarcinoma | Female | >=65 | I/II | Unknown | Unknown | SD |
| PKMYT1 | SNV | Missense_Mutation | novel | c.451C>T | p.Arg151Trp | p.R151W | Q99640 | protein_coding | deleterious(0) | probably_damaging(1) | TCGA-A5-A2K7-01 | Endometrium | uterine corpus endometrioid carcinoma | Female | <65 | I/II | Chemotherapy | taxol | SD |
| PKMYT1 | SNV | Missense_Mutation | rs766358175 | c.254N>A | p.Arg85Gln | p.R85Q | Q99640 | protein_coding | tolerated(0.13) | benign(0.003) | TCGA-AJ-A3EK-01 | Endometrium | uterine corpus endometrioid carcinoma | Female | <65 | I/II | Chemotherapy | carboplatin | CR |
| Page: 1 2 3 |
Top |
Related drugs of malignant transformation related genes |
| Identification of chemicals and drugs interact with genes involved in malignant transfromation |
| (DGIdb 4.0) |
| Entrez ID | Symbol | Category | Interaction Types | Drug Claim Name | Drug Name | PMIDs |
| 9088 | PKMYT1 | KINASE, SERINE THREONINE KINASE, DRUGGABLE GENOME, ENZYME | inhibitor | 249565863 |
| Page: 1 |

Copyright 2023-Present -The University of Texas Health Science Center at Houston |