
|
|||||
|
 | |
| |
| |
| |
| |
| |
|
Gene: PKM |
Gene summary for PKM |
| Gene information | Species | Human | Gene symbol | PKM | Gene ID | 5315 |
| Gene name | pyruvate kinase M1/2 | |
| Gene Alias | CTHBP | |
| Cytomap | 15q23 | |
| Gene Type | protein-coding | GO ID | GO:0001525 | UniProtAcc | P14618 |
Top |
Malignant transformation analysis |
| Identification of the aberrant gene expression in precancerous and cancerous lesions by comparing the gene expression of stem-like cells in diseased tissues with normal stem cells |
| Entrez ID | Symbol | Replicates | Species | Organ | Tissue | Adj P-value | Log2FC | Malignancy |
| 5315 | PKM | GSM4909282 | Human | Breast | IDC | 5.20e-57 | 7.99e-01 | -0.0288 |
| 5315 | PKM | GSM4909285 | Human | Breast | IDC | 5.58e-04 | 1.83e-01 | 0.21 |
| 5315 | PKM | GSM4909286 | Human | Breast | IDC | 3.62e-15 | -3.71e-01 | 0.1081 |
| 5315 | PKM | GSM4909293 | Human | Breast | IDC | 2.74e-11 | -3.25e-01 | 0.1581 |
| 5315 | PKM | GSM4909294 | Human | Breast | IDC | 2.77e-02 | -1.99e-01 | 0.2022 |
| 5315 | PKM | GSM4909296 | Human | Breast | IDC | 7.64e-09 | -3.19e-01 | 0.1524 |
| 5315 | PKM | GSM4909297 | Human | Breast | IDC | 6.90e-15 | -1.85e-01 | 0.1517 |
| 5315 | PKM | GSM4909298 | Human | Breast | IDC | 1.21e-19 | -4.87e-01 | 0.1551 |
| 5315 | PKM | GSM4909301 | Human | Breast | IDC | 5.37e-21 | -6.13e-01 | 0.1577 |
| 5315 | PKM | GSM4909306 | Human | Breast | IDC | 4.19e-05 | -1.72e-01 | 0.1564 |
| 5315 | PKM | GSM4909308 | Human | Breast | IDC | 1.60e-02 | -5.39e-02 | 0.158 |
| 5315 | PKM | GSM4909309 | Human | Breast | IDC | 1.16e-04 | -3.61e-01 | 0.0483 |
| 5315 | PKM | GSM4909311 | Human | Breast | IDC | 3.48e-32 | -2.64e-01 | 0.1534 |
| 5315 | PKM | GSM4909312 | Human | Breast | IDC | 1.99e-14 | -4.20e-01 | 0.1552 |
| 5315 | PKM | GSM4909319 | Human | Breast | IDC | 3.03e-41 | -5.93e-01 | 0.1563 |
| 5315 | PKM | GSM4909320 | Human | Breast | IDC | 6.68e-12 | -6.55e-01 | 0.1575 |
| 5315 | PKM | GSM4909321 | Human | Breast | IDC | 1.54e-09 | -1.58e-01 | 0.1559 |
| 5315 | PKM | brca1 | Human | Breast | Precancer | 9.55e-34 | 6.57e-01 | -0.0338 |
| 5315 | PKM | brca2 | Human | Breast | Precancer | 1.09e-59 | 8.16e-01 | -0.024 |
| 5315 | PKM | brca3 | Human | Breast | Precancer | 1.65e-71 | 9.26e-01 | -0.0263 |
| Page: 1 2 3 4 5 6 7 8 9 10 11 12 13 14 15 |
| Tissue | Expression Dynamics | Abbreviation |
| Breast |  | IDC: Invasive ductal carcinoma |
| DCIS: Ductal carcinoma in situ | ||
| Precancer(BRCA1-mut): Precancerous lesion from BRCA1 mutation carriers | ||
| Cervix | 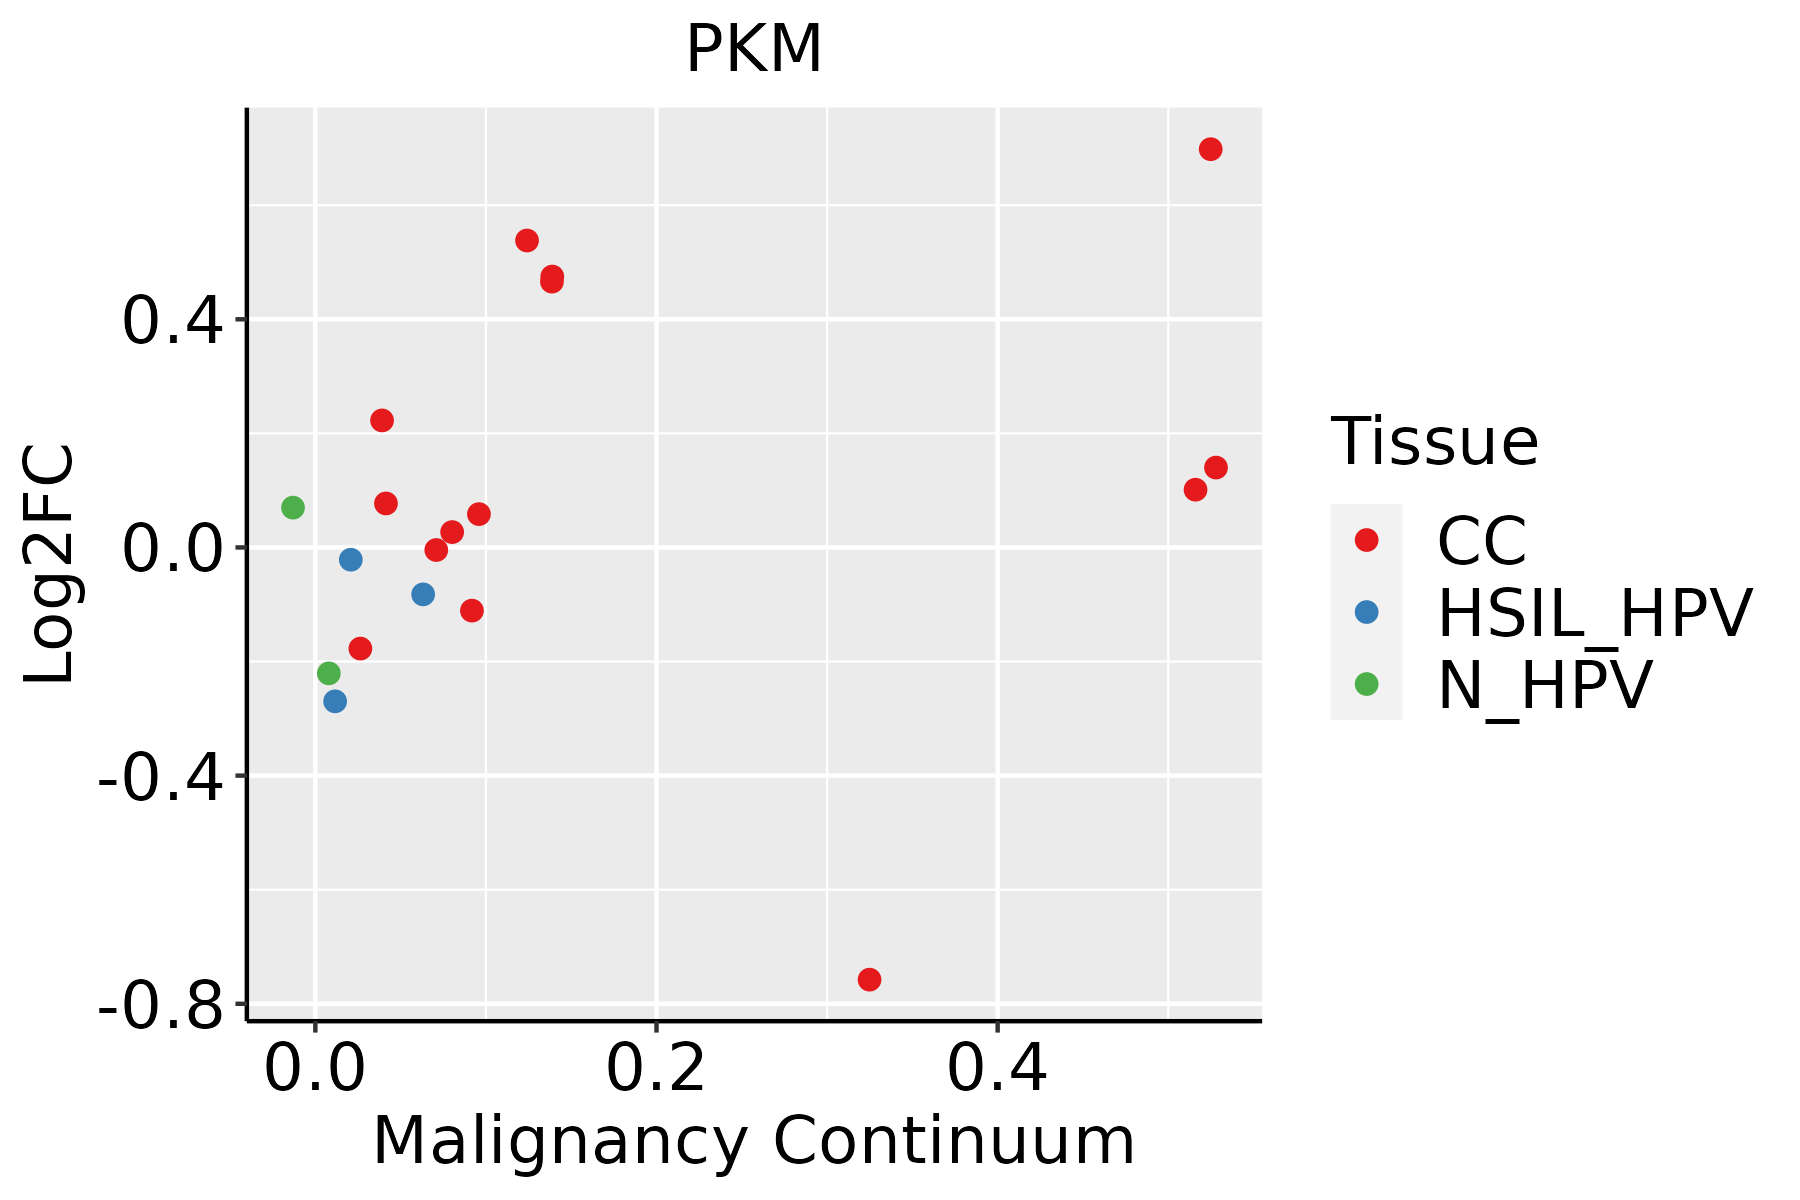 | CC: Cervix cancer |
| HSIL_HPV: HPV-infected high-grade squamous intraepithelial lesions | ||
| N_HPV: HPV-infected normal cervix | ||
| Colorectum (GSE201348) |  | FAP: Familial adenomatous polyposis |
| CRC: Colorectal cancer | ||
| Colorectum (HTA11) |  | AD: Adenomas |
| SER: Sessile serrated lesions | ||
| MSI-H: Microsatellite-high colorectal cancer | ||
| MSS: Microsatellite stable colorectal cancer | ||
| Endometrium | 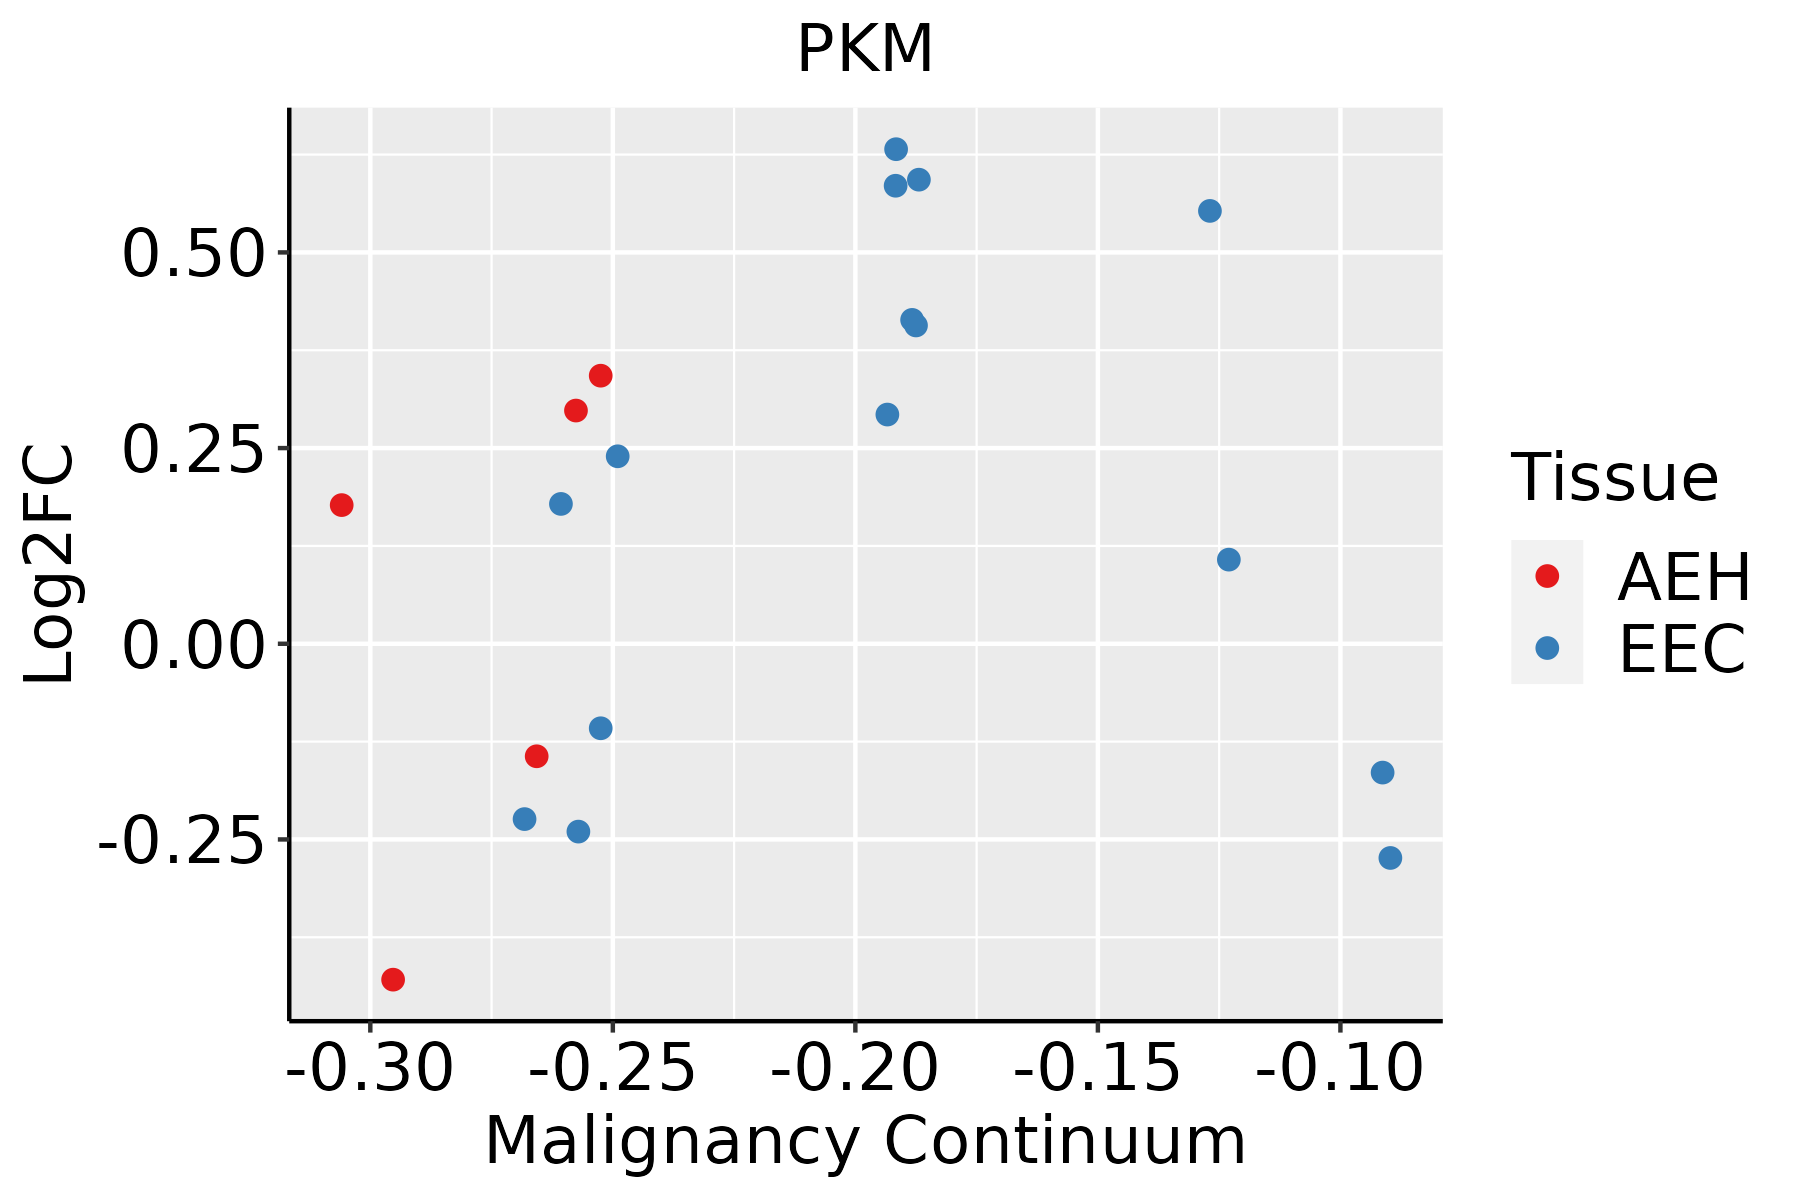 | AEH: Atypical endometrial hyperplasia |
| EEC: Endometrioid Cancer | ||
| Esophagus | 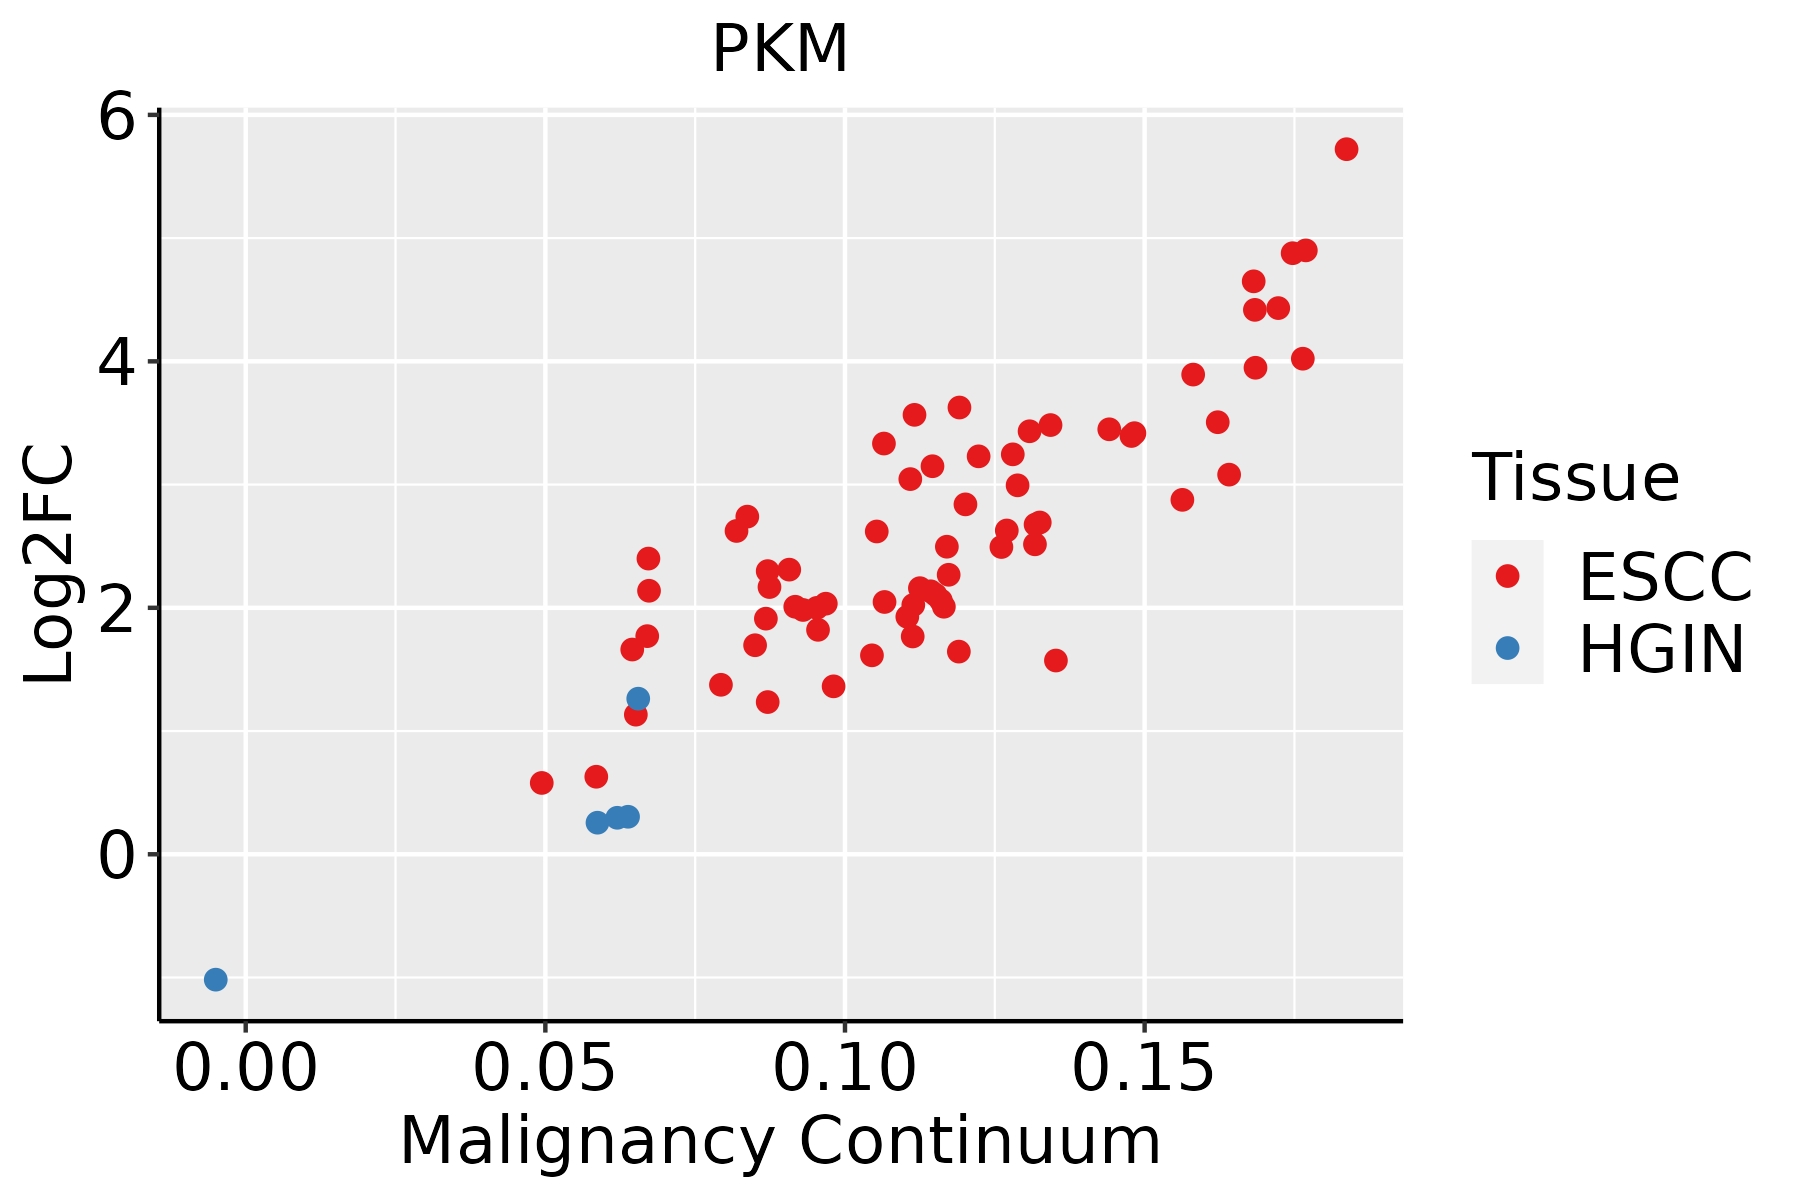 | ESCC: Esophageal squamous cell carcinoma |
| HGIN: High-grade intraepithelial neoplasias | ||
| LGIN: Low-grade intraepithelial neoplasias | ||
| Liver | 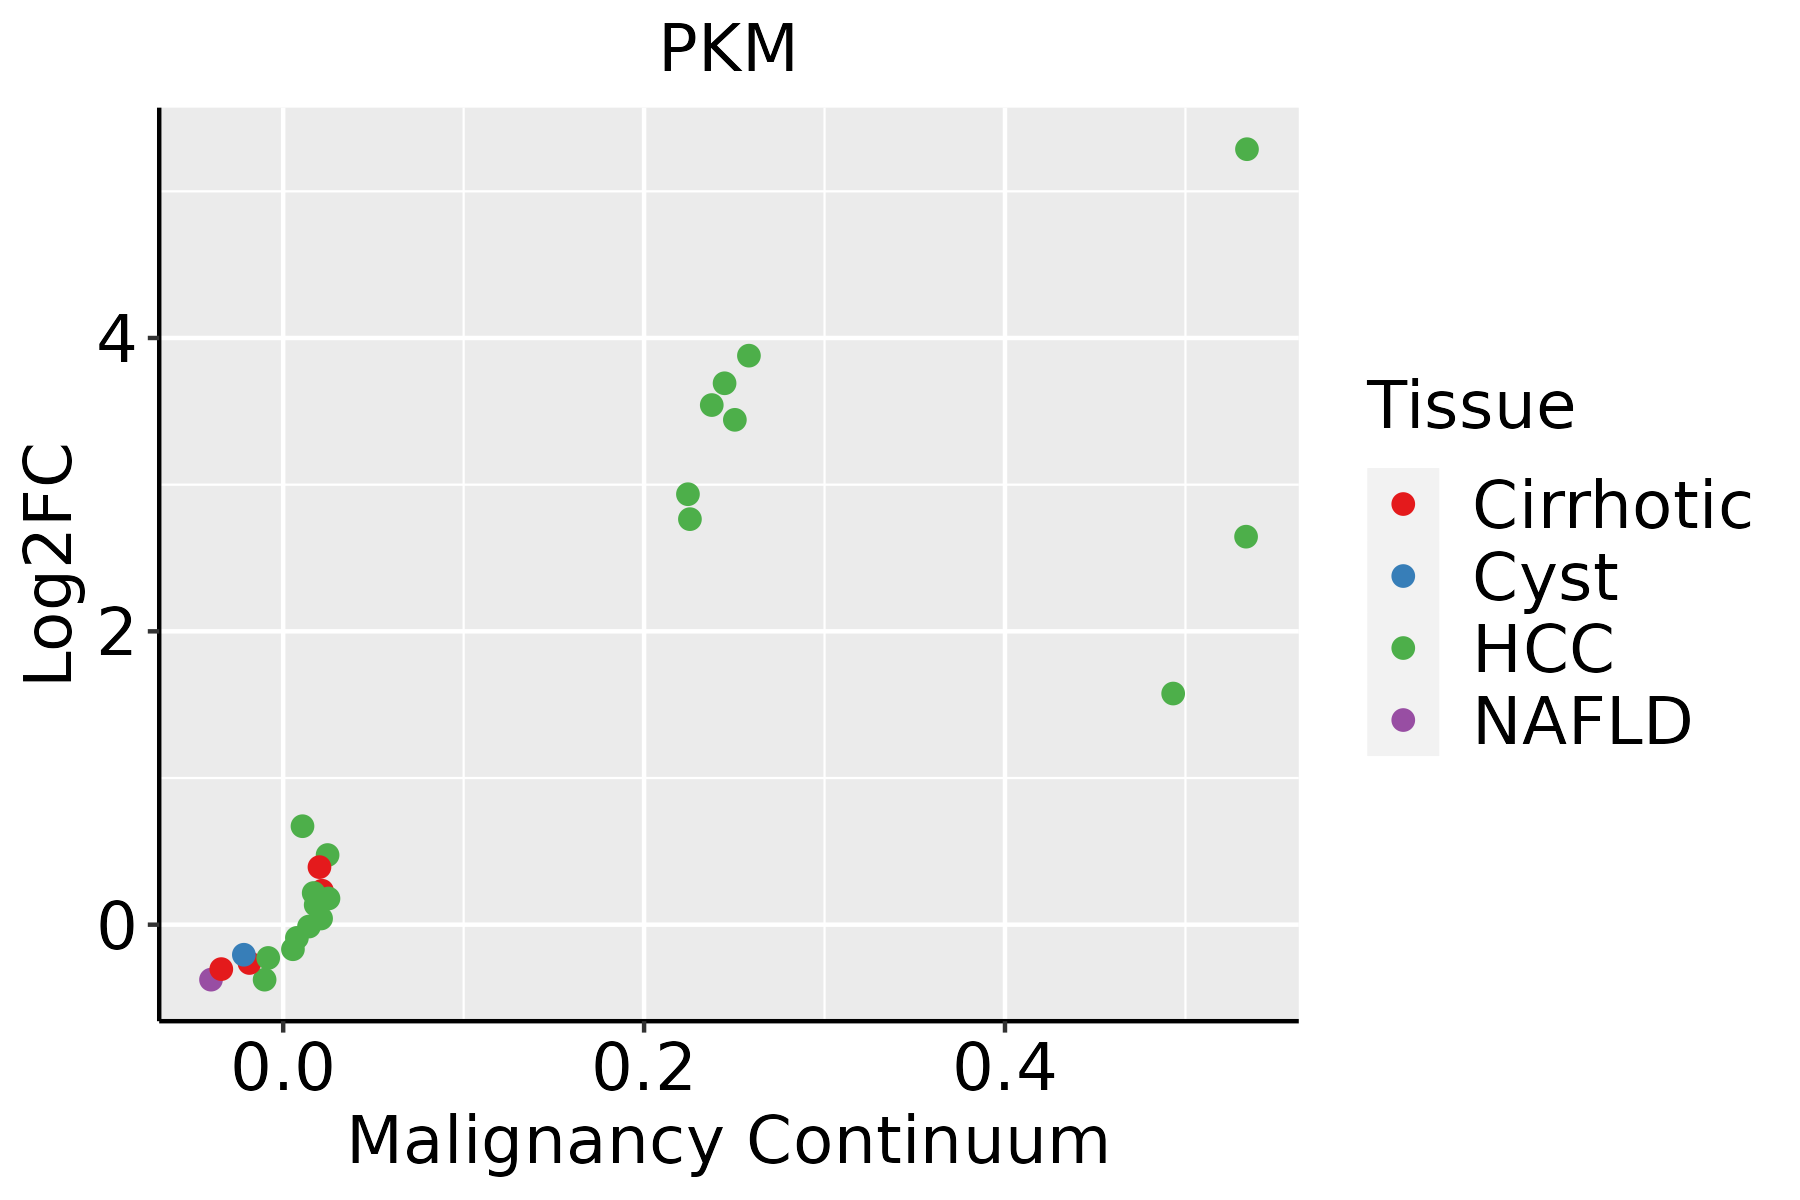 | HCC: Hepatocellular carcinoma |
| NAFLD: Non-alcoholic fatty liver disease | ||
| Lung | 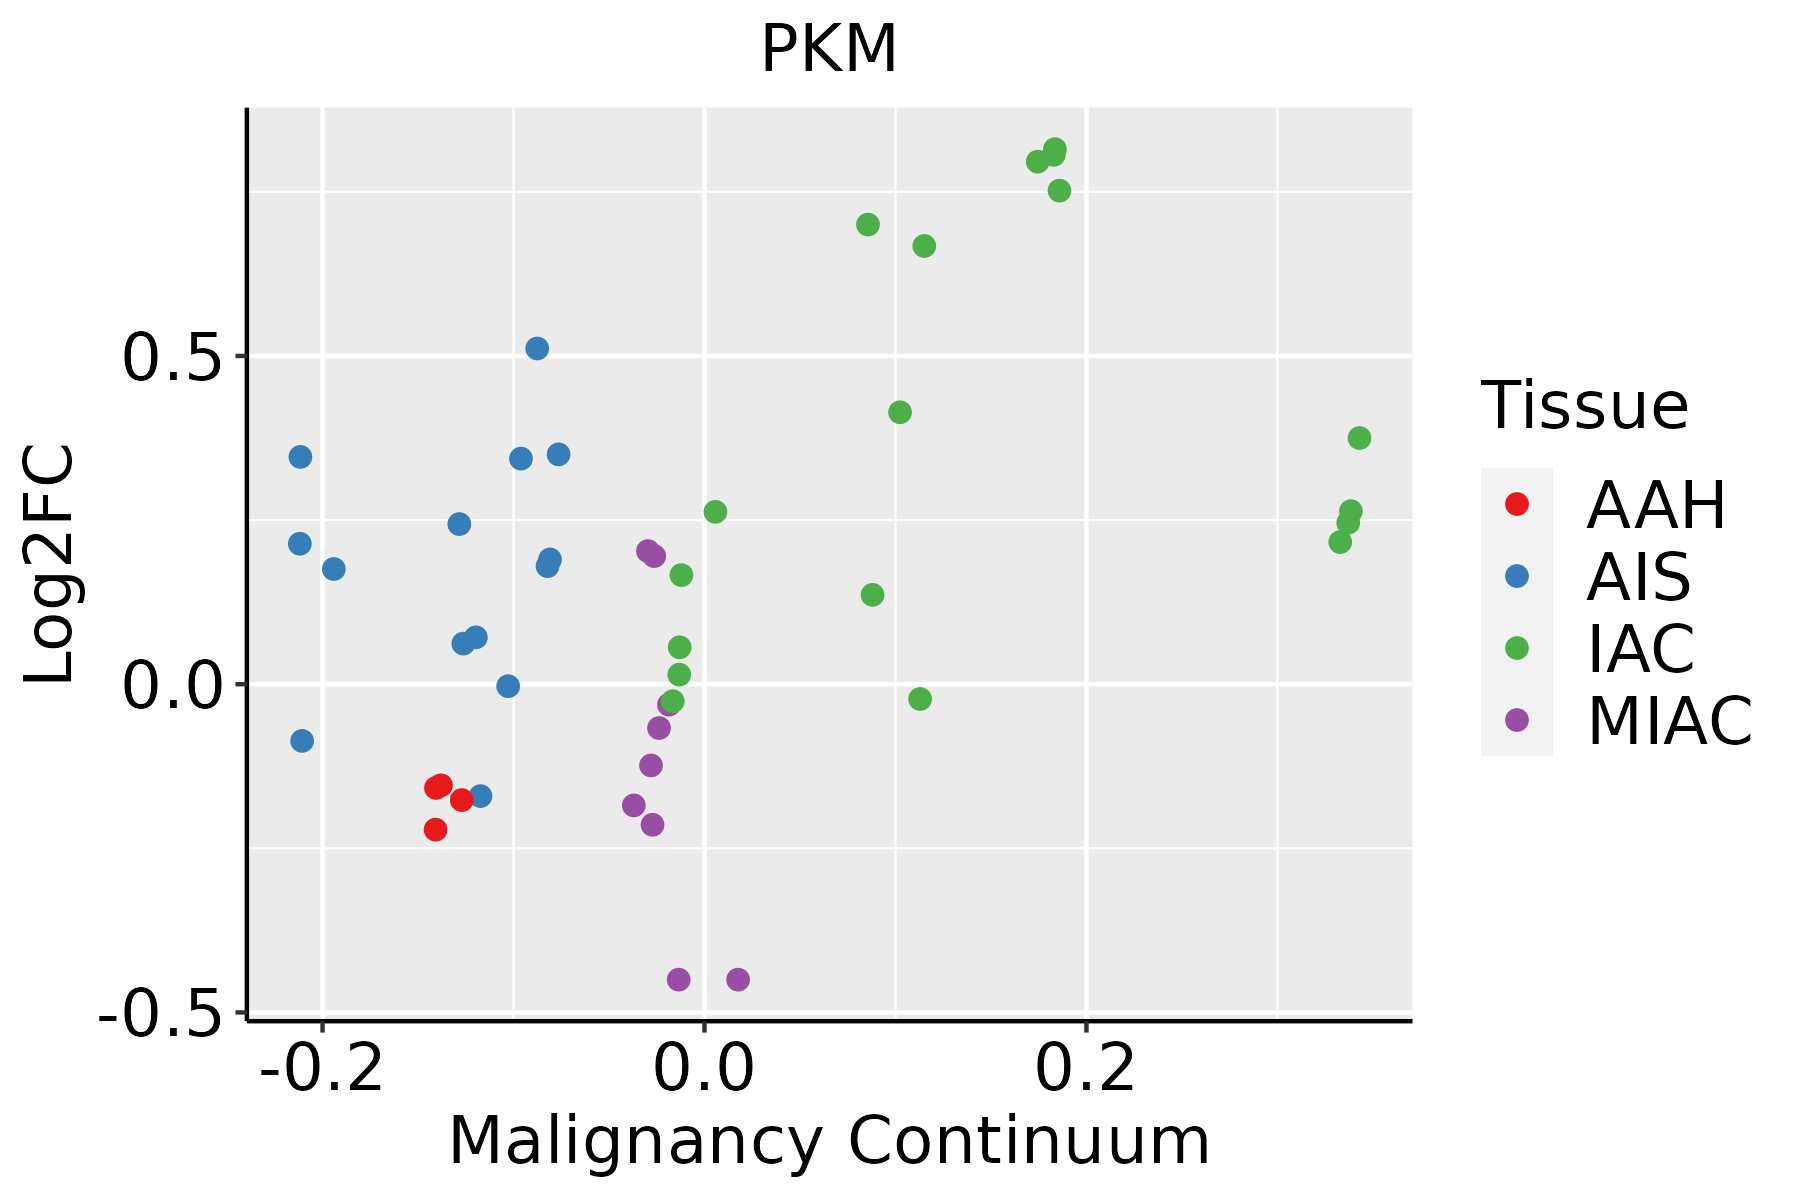 | AAH: Atypical adenomatous hyperplasia |
| AIS: Adenocarcinoma in situ | ||
| IAC: Invasive lung adenocarcinoma | ||
| MIA: Minimally invasive adenocarcinoma | ||
| Oral Cavity | 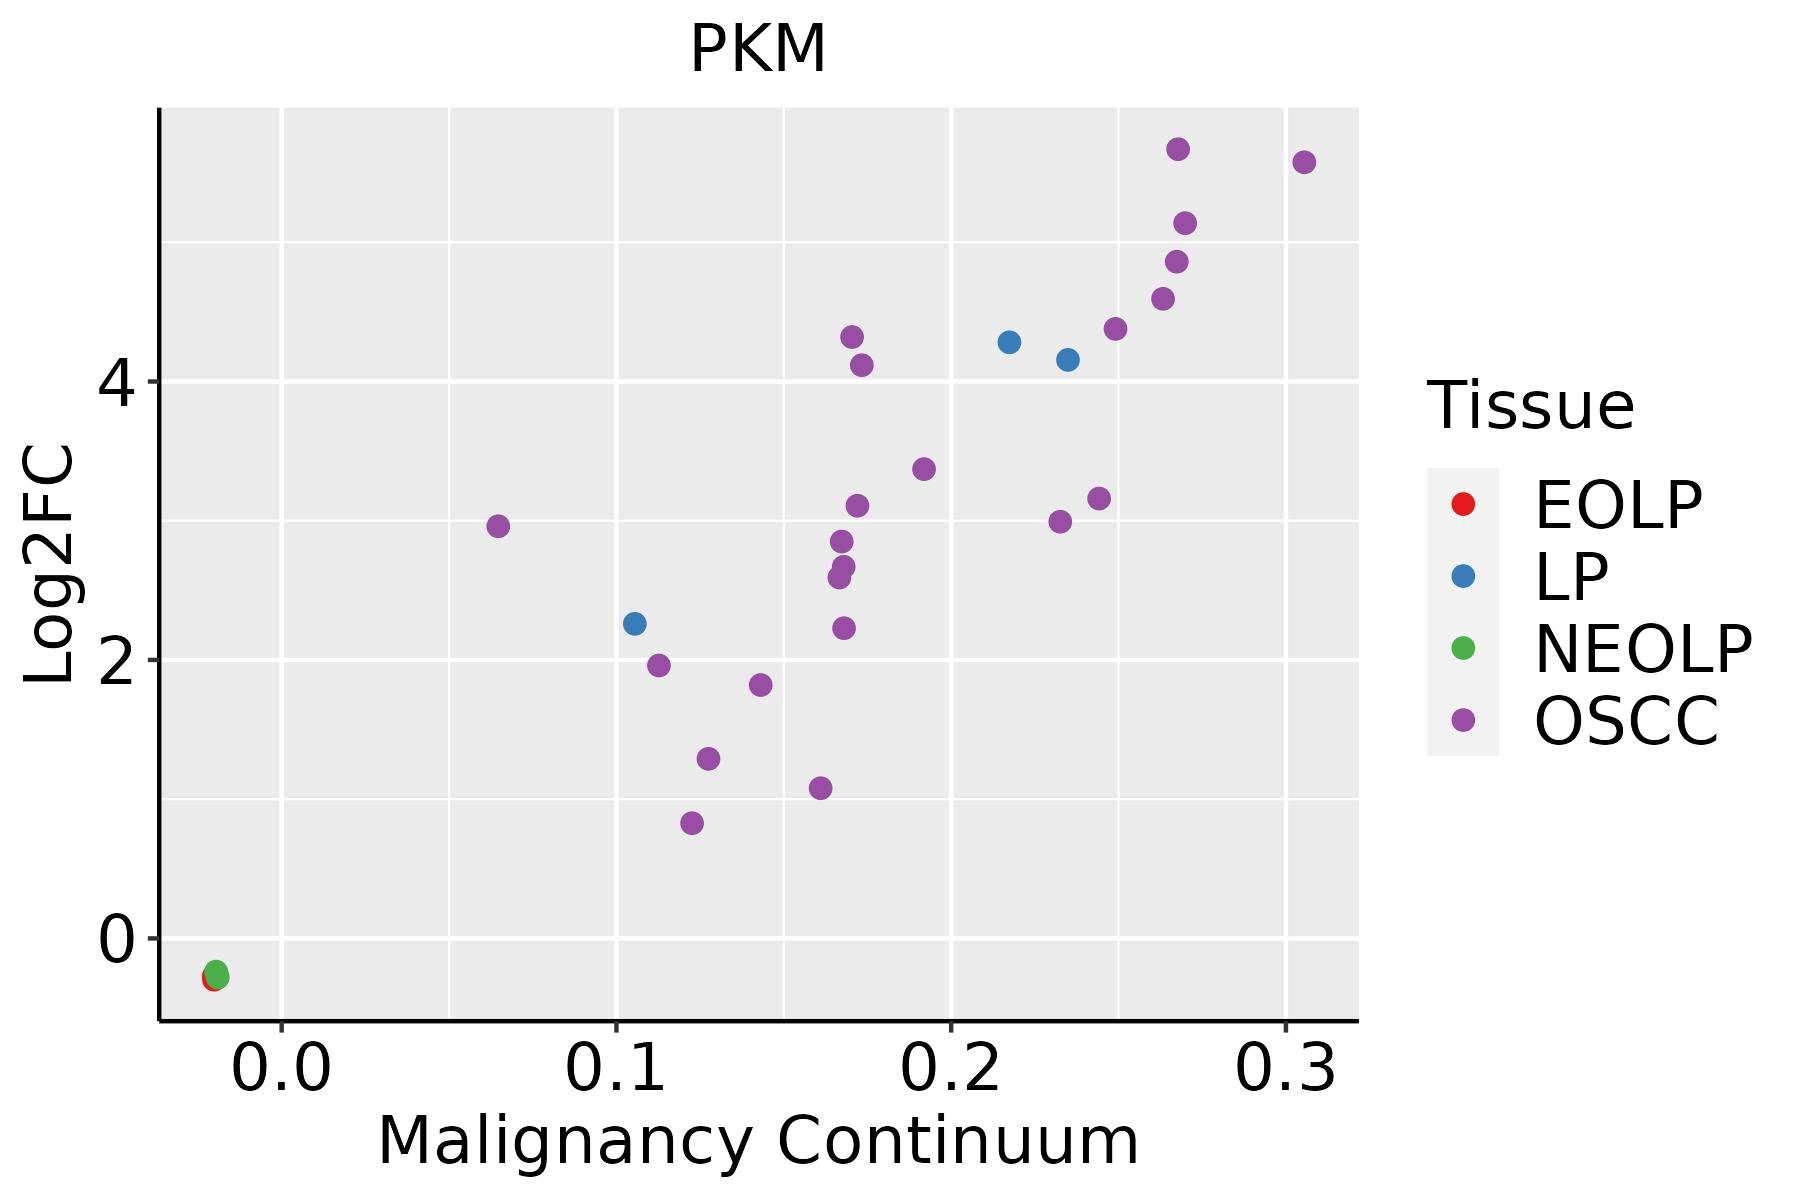 | EOLP: Erosive Oral lichen planus |
| LP: leukoplakia | ||
| NEOLP: Non-erosive oral lichen planus | ||
| OSCC: Oral squamous cell carcinoma | ||
| Prostate | 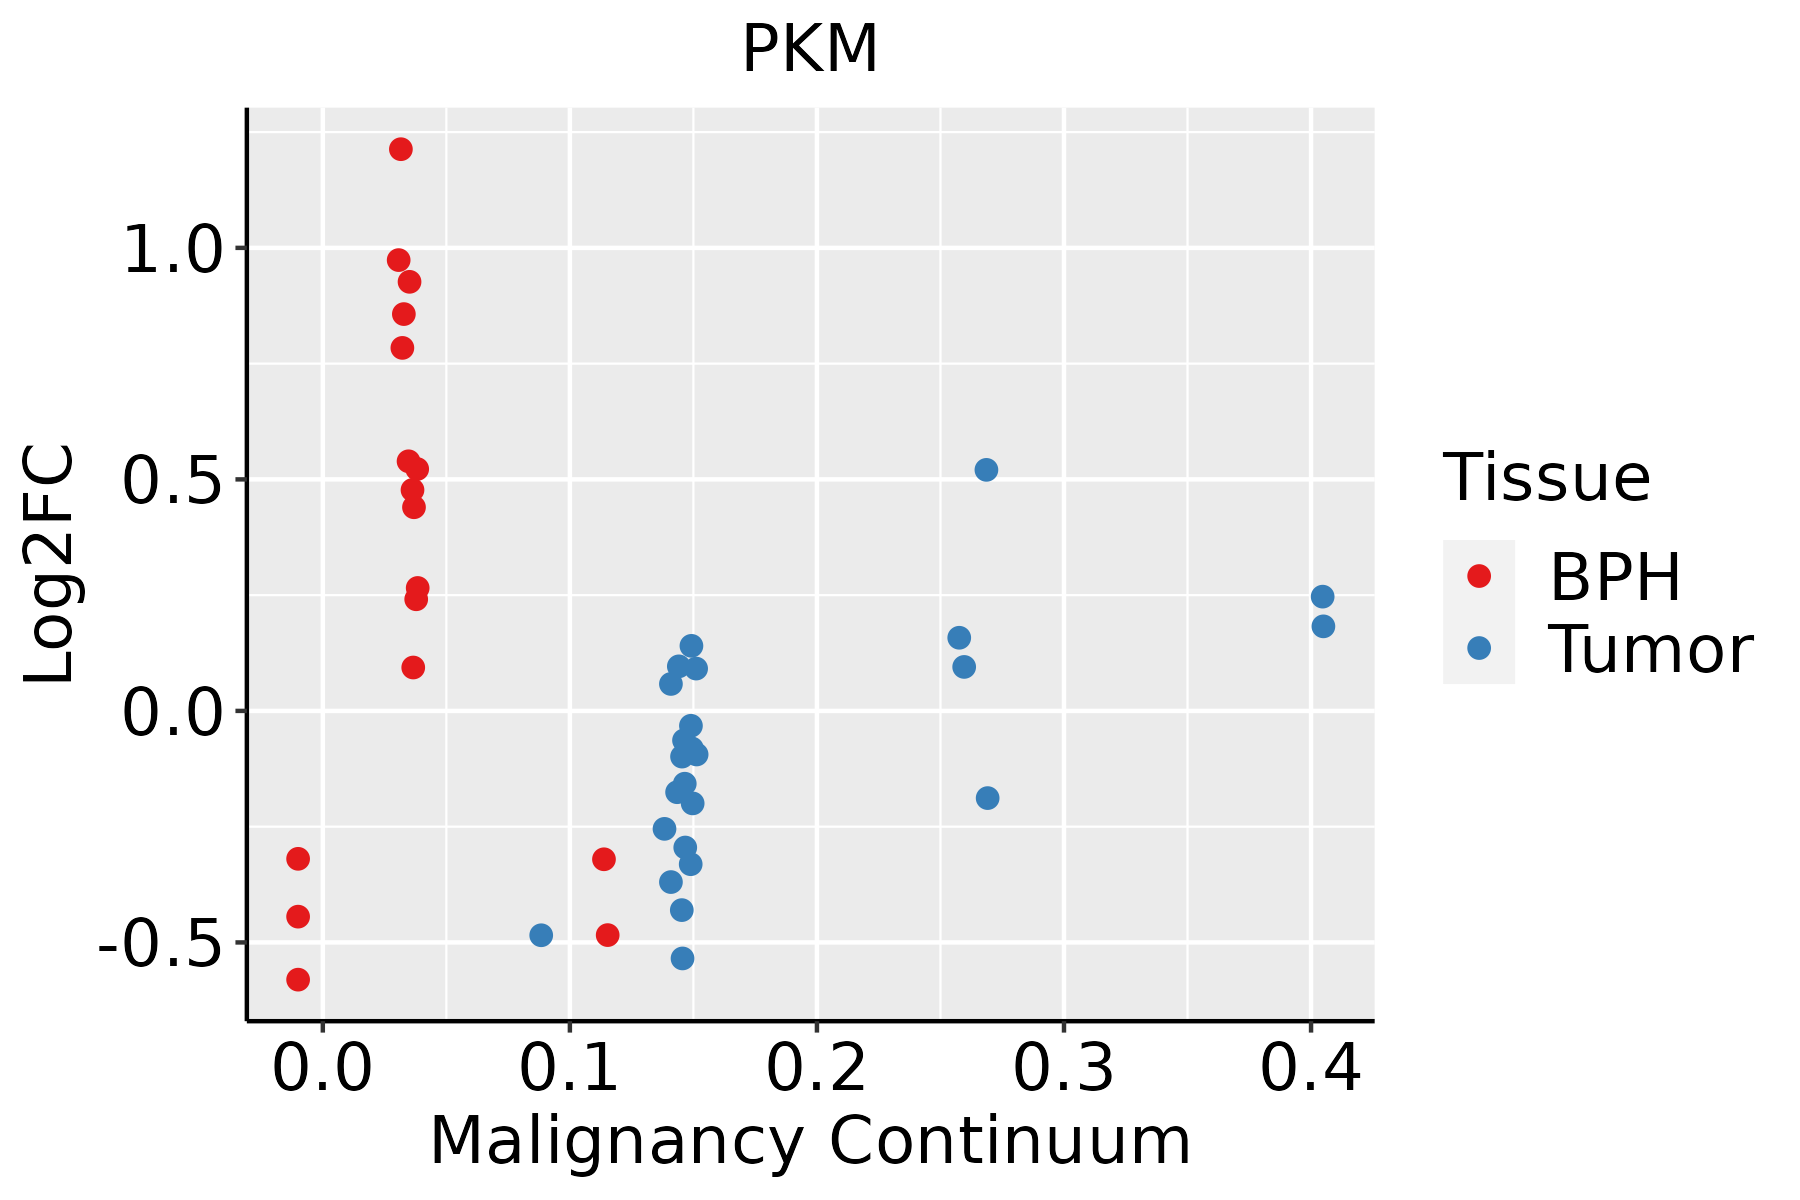 | BPH: Benign Prostatic Hyperplasia |
| Skin | 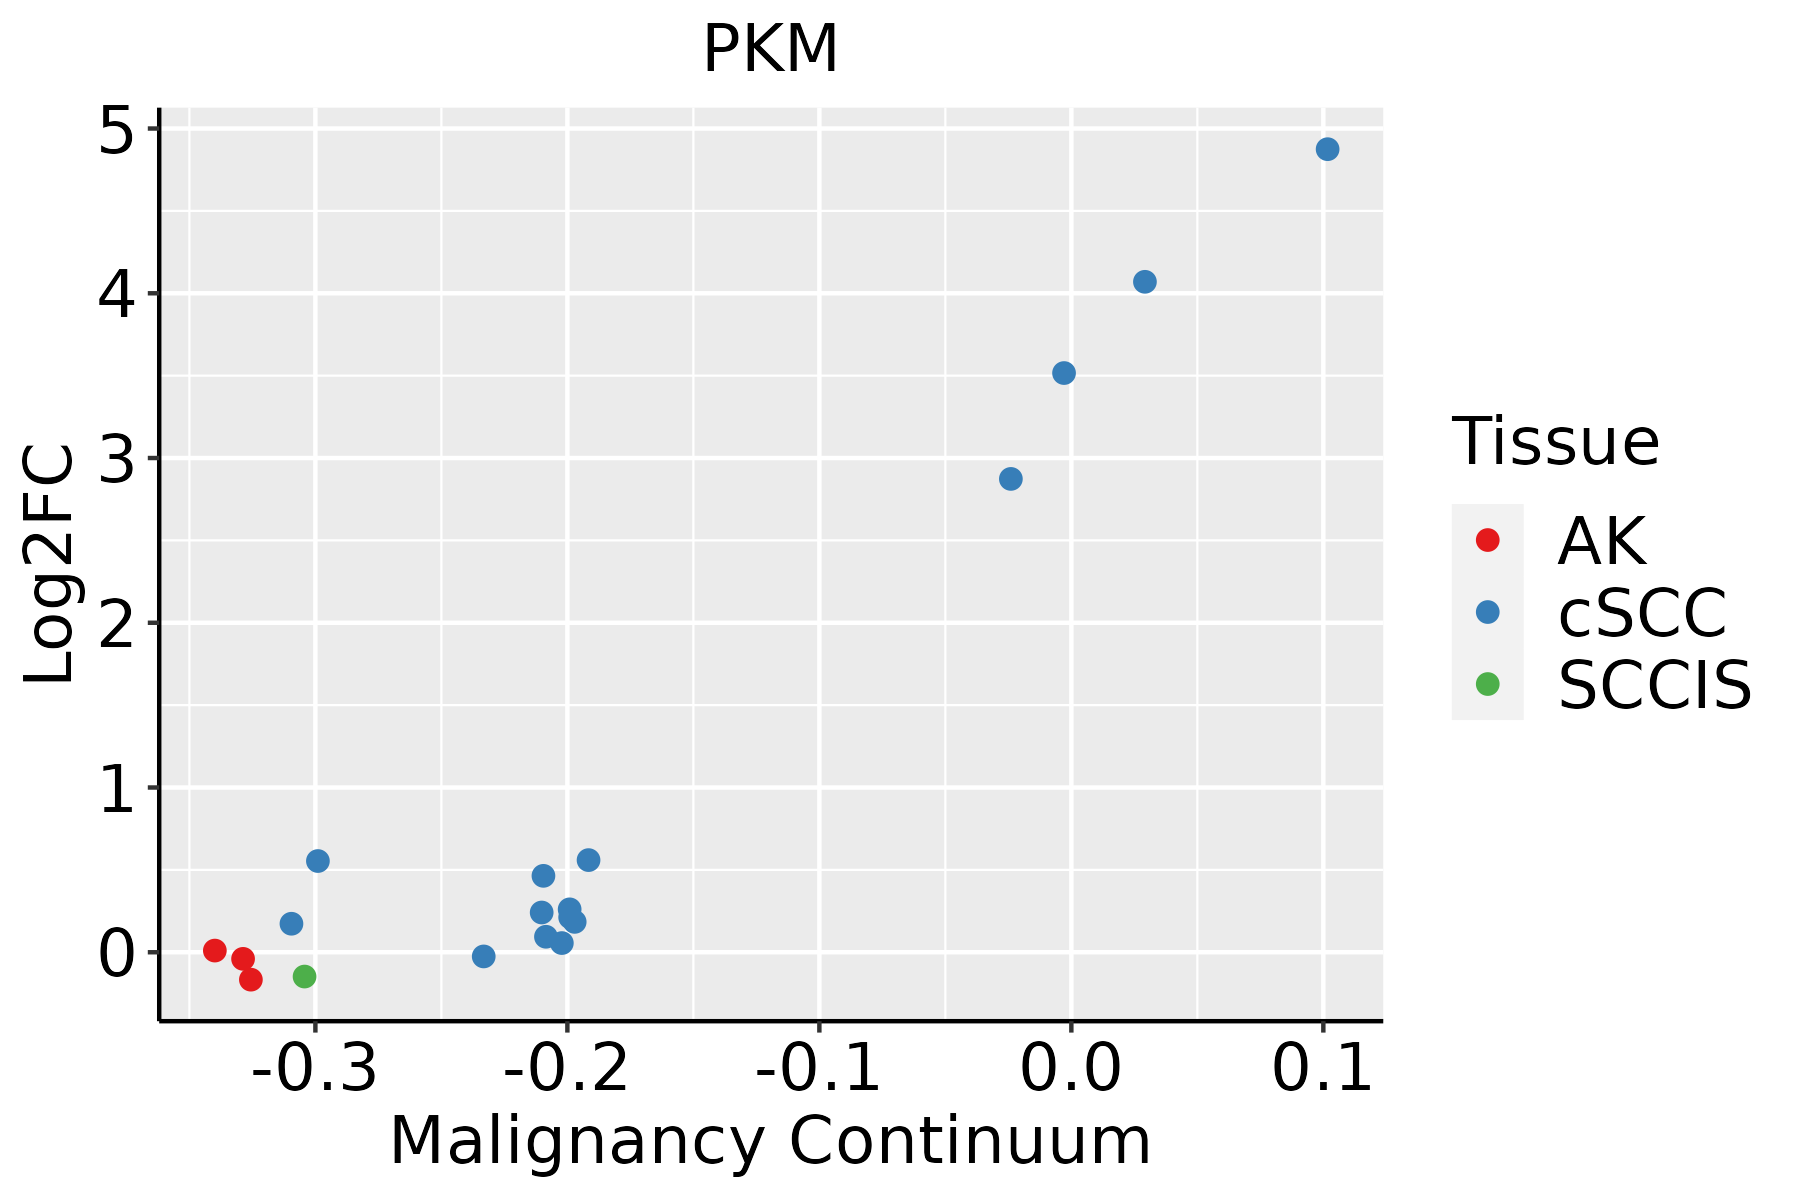 | AK: Actinic keratosis |
| cSCC: Cutaneous squamous cell carcinoma | ||
| SCCIS:squamous cell carcinoma in situ | ||
| Thyroid |  | ATC: Anaplastic thyroid cancer |
| HT: Hashimoto's thyroiditis | ||
| PTC: Papillary thyroid cancer |
| ∗log2FC in expression of this searched gene in stem-like cells from each diseased tissue sample relative to stem-like cells in normal samples in each tissue plotted against the malignancy continuum. Samples are colored based on if they are from different disease stage. |
Top |
Malignant transformation related pathway analysis |
| Find out the enriched GO biological processes and KEGG pathways involved in transition from healthy to precancer to cancer |
| Tissue | Disease Stage | Enriched GO biological Processes |
| Colorectum | AD |  |
| Colorectum | SER |  |
| Colorectum | MSS |  |
| Colorectum | MSI-H |  |
| Colorectum | FAP |  |
| ∗Top 15 enriched GO BP terms are showed in the bar plot of each disease state in each tissue. Each row represents a significant GO biological process which is colored according to the -log10(p.adjust). |
| Page: 1 2 3 4 5 6 7 8 9 |
| GO ID | Tissue | Disease Stage | Description | Gene Ratio | Bg Ratio | pvalue | p.adjust | Count |
| GO:00021819 | Breast | Precancer | cytoplasmic translation | 80/1080 | 148/18723 | 1.59e-59 | 8.54e-56 | 80 |
| GO:00460349 | Breast | Precancer | ATP metabolic process | 82/1080 | 277/18723 | 1.94e-36 | 5.19e-33 | 82 |
| GO:00060918 | Breast | Precancer | generation of precursor metabolites and energy | 94/1080 | 490/18723 | 1.54e-25 | 1.64e-22 | 94 |
| GO:00064179 | Breast | Precancer | regulation of translation | 67/1080 | 468/18723 | 4.71e-12 | 7.64e-10 | 67 |
| GO:00457279 | Breast | Precancer | positive regulation of translation | 32/1080 | 136/18723 | 5.89e-12 | 9.27e-10 | 32 |
| GO:00342509 | Breast | Precancer | positive regulation of cellular amide metabolic process | 33/1080 | 162/18723 | 1.72e-10 | 1.77e-08 | 33 |
| GO:00196938 | Breast | Precancer | ribose phosphate metabolic process | 49/1080 | 396/18723 | 3.81e-07 | 1.78e-05 | 49 |
| GO:00091509 | Breast | Precancer | purine ribonucleotide metabolic process | 46/1080 | 368/18723 | 6.47e-07 | 2.71e-05 | 46 |
| GO:00091179 | Breast | Precancer | nucleotide metabolic process | 56/1080 | 489/18723 | 7.40e-07 | 3.00e-05 | 56 |
| GO:00092598 | Breast | Precancer | ribonucleotide metabolic process | 47/1080 | 385/18723 | 9.69e-07 | 3.84e-05 | 47 |
| GO:00469398 | Breast | Precancer | nucleotide phosphorylation | 20/1080 | 101/18723 | 1.07e-06 | 4.18e-05 | 20 |
| GO:00067539 | Breast | Precancer | nucleoside phosphate metabolic process | 56/1080 | 497/18723 | 1.24e-06 | 4.70e-05 | 56 |
| GO:00061639 | Breast | Precancer | purine nucleotide metabolic process | 47/1080 | 396/18723 | 2.14e-06 | 7.50e-05 | 47 |
| GO:00091858 | Breast | Precancer | ribonucleoside diphosphate metabolic process | 20/1080 | 106/18723 | 2.37e-06 | 8.17e-05 | 20 |
| GO:00060968 | Breast | Precancer | glycolytic process | 17/1080 | 81/18723 | 2.94e-06 | 9.73e-05 | 17 |
| GO:00061658 | Breast | Precancer | nucleoside diphosphate phosphorylation | 19/1080 | 99/18723 | 3.23e-06 | 1.05e-04 | 19 |
| GO:00067578 | Breast | Precancer | ATP generation from ADP | 17/1080 | 82/18723 | 3.52e-06 | 1.13e-04 | 17 |
| GO:00091328 | Breast | Precancer | nucleoside diphosphate metabolic process | 21/1080 | 124/18723 | 7.98e-06 | 2.17e-04 | 21 |
| GO:00725219 | Breast | Precancer | purine-containing compound metabolic process | 47/1080 | 416/18723 | 8.19e-06 | 2.20e-04 | 47 |
| GO:00460318 | Breast | Precancer | ADP metabolic process | 17/1080 | 90/18723 | 1.31e-05 | 3.30e-04 | 17 |
| Page: 1 2 3 4 5 6 7 8 9 10 11 12 13 14 15 16 17 18 19 20 21 22 23 24 25 26 27 28 29 30 31 32 33 34 35 36 37 38 39 40 41 |
| Pathway ID | Tissue | Disease Stage | Description | Gene Ratio | Bg Ratio | pvalue | p.adjust | qvalue | Count |
| hsa0001010 | Breast | Precancer | Glycolysis / Gluconeogenesis | 13/684 | 67/8465 | 2.39e-03 | 1.51e-02 | 1.16e-02 | 13 |
| hsa052309 | Breast | Precancer | Central carbon metabolism in cancer | 13/684 | 70/8465 | 3.57e-03 | 2.17e-02 | 1.66e-02 | 13 |
| hsa0120012 | Breast | Precancer | Carbon metabolism | 18/684 | 115/8465 | 4.79e-03 | 2.75e-02 | 2.11e-02 | 18 |
| hsa052036 | Breast | Precancer | Viral carcinogenesis | 27/684 | 204/8465 | 7.19e-03 | 4.06e-02 | 3.11e-02 | 27 |
| hsa0001013 | Breast | Precancer | Glycolysis / Gluconeogenesis | 13/684 | 67/8465 | 2.39e-03 | 1.51e-02 | 1.16e-02 | 13 |
| hsa0523012 | Breast | Precancer | Central carbon metabolism in cancer | 13/684 | 70/8465 | 3.57e-03 | 2.17e-02 | 1.66e-02 | 13 |
| hsa0120013 | Breast | Precancer | Carbon metabolism | 18/684 | 115/8465 | 4.79e-03 | 2.75e-02 | 2.11e-02 | 18 |
| hsa0520312 | Breast | Precancer | Viral carcinogenesis | 27/684 | 204/8465 | 7.19e-03 | 4.06e-02 | 3.11e-02 | 27 |
| hsa0520322 | Breast | IDC | Viral carcinogenesis | 34/867 | 204/8465 | 2.82e-03 | 1.86e-02 | 1.39e-02 | 34 |
| hsa0520332 | Breast | IDC | Viral carcinogenesis | 34/867 | 204/8465 | 2.82e-03 | 1.86e-02 | 1.39e-02 | 34 |
| hsa0520341 | Breast | DCIS | Viral carcinogenesis | 34/846 | 204/8465 | 1.88e-03 | 1.27e-02 | 9.33e-03 | 34 |
| hsa052035 | Breast | DCIS | Viral carcinogenesis | 34/846 | 204/8465 | 1.88e-03 | 1.27e-02 | 9.33e-03 | 34 |
| hsa051657 | Cervix | CC | Human papillomavirus infection | 74/1267 | 331/8465 | 1.70e-04 | 1.02e-03 | 6.03e-04 | 74 |
| hsa0523010 | Cervix | CC | Central carbon metabolism in cancer | 18/1267 | 70/8465 | 1.29e-02 | 3.87e-02 | 2.29e-02 | 18 |
| hsa0516512 | Cervix | CC | Human papillomavirus infection | 74/1267 | 331/8465 | 1.70e-04 | 1.02e-03 | 6.03e-04 | 74 |
| hsa0523013 | Cervix | CC | Central carbon metabolism in cancer | 18/1267 | 70/8465 | 1.29e-02 | 3.87e-02 | 2.29e-02 | 18 |
| hsa01200 | Colorectum | AD | Carbon metabolism | 55/2092 | 115/8465 | 5.53e-08 | 8.42e-07 | 5.37e-07 | 55 |
| hsa00620 | Colorectum | AD | Pyruvate metabolism | 28/2092 | 47/8465 | 3.71e-07 | 5.41e-06 | 3.45e-06 | 28 |
| hsa00010 | Colorectum | AD | Glycolysis / Gluconeogenesis | 34/2092 | 67/8465 | 3.63e-06 | 4.34e-05 | 2.77e-05 | 34 |
| hsa05230 | Colorectum | AD | Central carbon metabolism in cancer | 33/2092 | 70/8465 | 3.61e-05 | 3.19e-04 | 2.03e-04 | 33 |
| Page: 1 2 3 4 5 6 7 8 9 |
Top |
Cell-cell communication analysis |
| Identification of potential cell-cell interactions between two cell types and their ligand-receptor pairs for different disease states |
| Ligand | Receptor | LRpair | Pathway | Tissue | Disease Stage |
| Page: 1 |
Top |
Single-cell gene regulatory network inference analysis |
| Find out the significant the regulons (TFs) and the target genes of each regulon across cell types for different disease states |
| TF | Cell Type | Tissue | Disease Stage | Target Gene | RSS | Regulon Activity |
| ∗The dot plots of a searched regulon are shown for all cell subpopulations in each disease state of each tissue based on the regulon specific score inferred using pySCENIC and by calculating the average expression. |
| Page: 1 |
Top |
Somatic mutation of malignant transformation related genes |
| Annotation of somatic variants for genes involved in malignant transformation |
| Hugo Symbol | Variant Class | Variant Classification | dbSNP RS | HGVSc | HGVSp | HGVSp Short | SWISSPROT | BIOTYPE | SIFT | PolyPhen | Tumor Sample Barcode | Tissue | Histology | Sex | Age | Stage | Therapy Types | Drugs | Outcome |
| PKM | SNV | Missense_Mutation | rs747511396 | c.1511N>G | p.Lys504Arg | p.K504R | P14618 | protein_coding | tolerated(0.21) | possibly_damaging(0.806) | TCGA-A2-A0T5-01 | Breast | breast invasive carcinoma | Female | <65 | I/II | Unspecific | Taxotere | SD |
| PKM | SNV | Missense_Mutation | c.950N>A | p.Cys317Tyr | p.C317Y | P14618 | protein_coding | deleterious(0.01) | benign(0.139) | TCGA-EW-A1PD-01 | Breast | breast invasive carcinoma | Male | <65 | I/II | Chemotherapy | docetaxel | SD | |
| PKM | SNV | Missense_Mutation | rs762544621 | c.1499G>A | p.Arg500Gln | p.R500Q | P14618 | protein_coding | tolerated(0.28) | benign(0.034) | TCGA-LQ-A4E4-01 | Breast | breast invasive carcinoma | Female | >=65 | III/IV | Hormone Therapy | anastrozole | PD |
| PKM | SNV | Missense_Mutation | novel | c.1538N>T | p.Thr513Ile | p.T513I | P14618 | protein_coding | deleterious(0.03) | possibly_damaging(0.759) | TCGA-2W-A8YY-01 | Cervix | cervical & endocervical cancer | Female | <65 | I/II | Chemotherapy | cisplatin | CR |
| PKM | SNV | Missense_Mutation | c.1474N>A | p.Phe492Ile | p.F492I | P14618 | protein_coding | deleterious(0.01) | benign(0.028) | TCGA-EA-A3QD-01 | Cervix | cervical & endocervical cancer | Female | <65 | III/IV | Chemotherapy | cisplatin | CR | |
| PKM | SNV | Missense_Mutation | c.301G>A | p.Asp101Asn | p.D101N | P14618 | protein_coding | tolerated(0.32) | benign(0.006) | TCGA-Q1-A73O-01 | Cervix | cervical & endocervical cancer | Female | <65 | I/II | Chemotherapy | cisplatin | CR | |
| PKM | SNV | Missense_Mutation | novel | c.128G>C | p.Arg43Pro | p.R43P | P14618 | protein_coding | deleterious(0) | probably_damaging(0.911) | TCGA-VS-A9U6-01 | Cervix | cervical & endocervical cancer | Female | <65 | I/II | Chemotherapy | cisplatin | PD |
| PKM | SNV | Missense_Mutation | novel | c.778N>C | p.Glu260Gln | p.E260Q | P14618 | protein_coding | deleterious(0.02) | benign(0.223) | TCGA-VS-A9UY-01 | Cervix | cervical & endocervical cancer | Female | <65 | I/II | Chemotherapy | cisplatin | PD |
| PKM | SNV | Missense_Mutation | c.860N>T | p.Ser287Ile | p.S287I | P14618 | protein_coding | deleterious(0) | probably_damaging(0.996) | TCGA-AA-3966-01 | Colorectum | colon adenocarcinoma | Female | >=65 | I/II | Unknown | Unknown | SD | |
| PKM | SNV | Missense_Mutation | novel | c.704N>G | p.Gln235Arg | p.Q235R | P14618 | protein_coding | tolerated(0.06) | benign(0.05) | TCGA-AA-3966-01 | Colorectum | colon adenocarcinoma | Female | >=65 | I/II | Unknown | Unknown | SD |
| Page: 1 2 3 4 5 6 |
Top |
Related drugs of malignant transformation related genes |
| Identification of chemicals and drugs interact with genes involved in malignant transfromation |
| (DGIdb 4.0) |
| Entrez ID | Symbol | Category | Interaction Types | Drug Claim Name | Drug Name | PMIDs |
| 5315 | PKM | ENZYME, KINASE, DRUGGABLE GENOME | GNF-PF-2812 | CHEMBL125044 | ||
| 5315 | PKM | ENZYME, KINASE, DRUGGABLE GENOME | EBSELEN | EBSELEN | ||
| 5315 | PKM | ENZYME, KINASE, DRUGGABLE GENOME | SANGUINARIUM | SANGUINARIUM | ||
| 5315 | PKM | ENZYME, KINASE, DRUGGABLE GENOME | DNDI1417195 | CHEMBL1303948 | ||
| 5315 | PKM | ENZYME, KINASE, DRUGGABLE GENOME | CID 752709 | CHEMBL429335 | ||
| 5315 | PKM | ENZYME, KINASE, DRUGGABLE GENOME | CIS-RESVERATROL | CIS-RESVERATROL | ||
| 5315 | PKM | ENZYME, KINASE, DRUGGABLE GENOME | GNF-PF-1919 | CHEMBL576409 | ||
| 5315 | PKM | ENZYME, KINASE, DRUGGABLE GENOME | 1,4-BIS(4-METHOXYPHENYLSULFONYL)PIPERAZINE | CHEMBL1091502 | ||
| 5315 | PKM | ENZYME, KINASE, DRUGGABLE GENOME | TRANILAST | TRANILAST | ||
| 5315 | PKM | ENZYME, KINASE, DRUGGABLE GENOME | SULFADIAZINE, SILVER | SULFADIAZINE, SILVER |
| Page: 1 2 3 4 5 |

Copyright 2023-Present -The University of Texas Health Science Center at Houston |