
|
|||||
|
 | |
| |
| |
| |
| |
| |
|
Gene: PKLR |
Gene summary for PKLR |
| Gene information | Species | Human | Gene symbol | PKLR | Gene ID | 5313 |
| Gene name | pyruvate kinase L/R | |
| Gene Alias | PK1 | |
| Cytomap | 1q22 | |
| Gene Type | protein-coding | GO ID | GO:0001666 | UniProtAcc | P30613 |
Top |
Malignant transformation analysis |
| Identification of the aberrant gene expression in precancerous and cancerous lesions by comparing the gene expression of stem-like cells in diseased tissues with normal stem cells |
| Entrez ID | Symbol | Replicates | Species | Organ | Tissue | Adj P-value | Log2FC | Malignancy |
| 5313 | PKLR | HCC1_Meng | Human | Liver | HCC | 2.24e-05 | 2.63e-02 | 0.0246 |
| 5313 | PKLR | HCC1 | Human | Liver | HCC | 5.16e-13 | 2.72e+00 | 0.5336 |
| 5313 | PKLR | HCC2 | Human | Liver | HCC | 3.33e-53 | 4.01e+00 | 0.5341 |
| 5313 | PKLR | S014 | Human | Liver | HCC | 1.02e-40 | 1.66e+00 | 0.2254 |
| 5313 | PKLR | S015 | Human | Liver | HCC | 1.99e-43 | 1.77e+00 | 0.2375 |
| 5313 | PKLR | S016 | Human | Liver | HCC | 9.33e-59 | 1.90e+00 | 0.2243 |
| Page: 1 |
| Tissue | Expression Dynamics | Abbreviation |
| Liver | 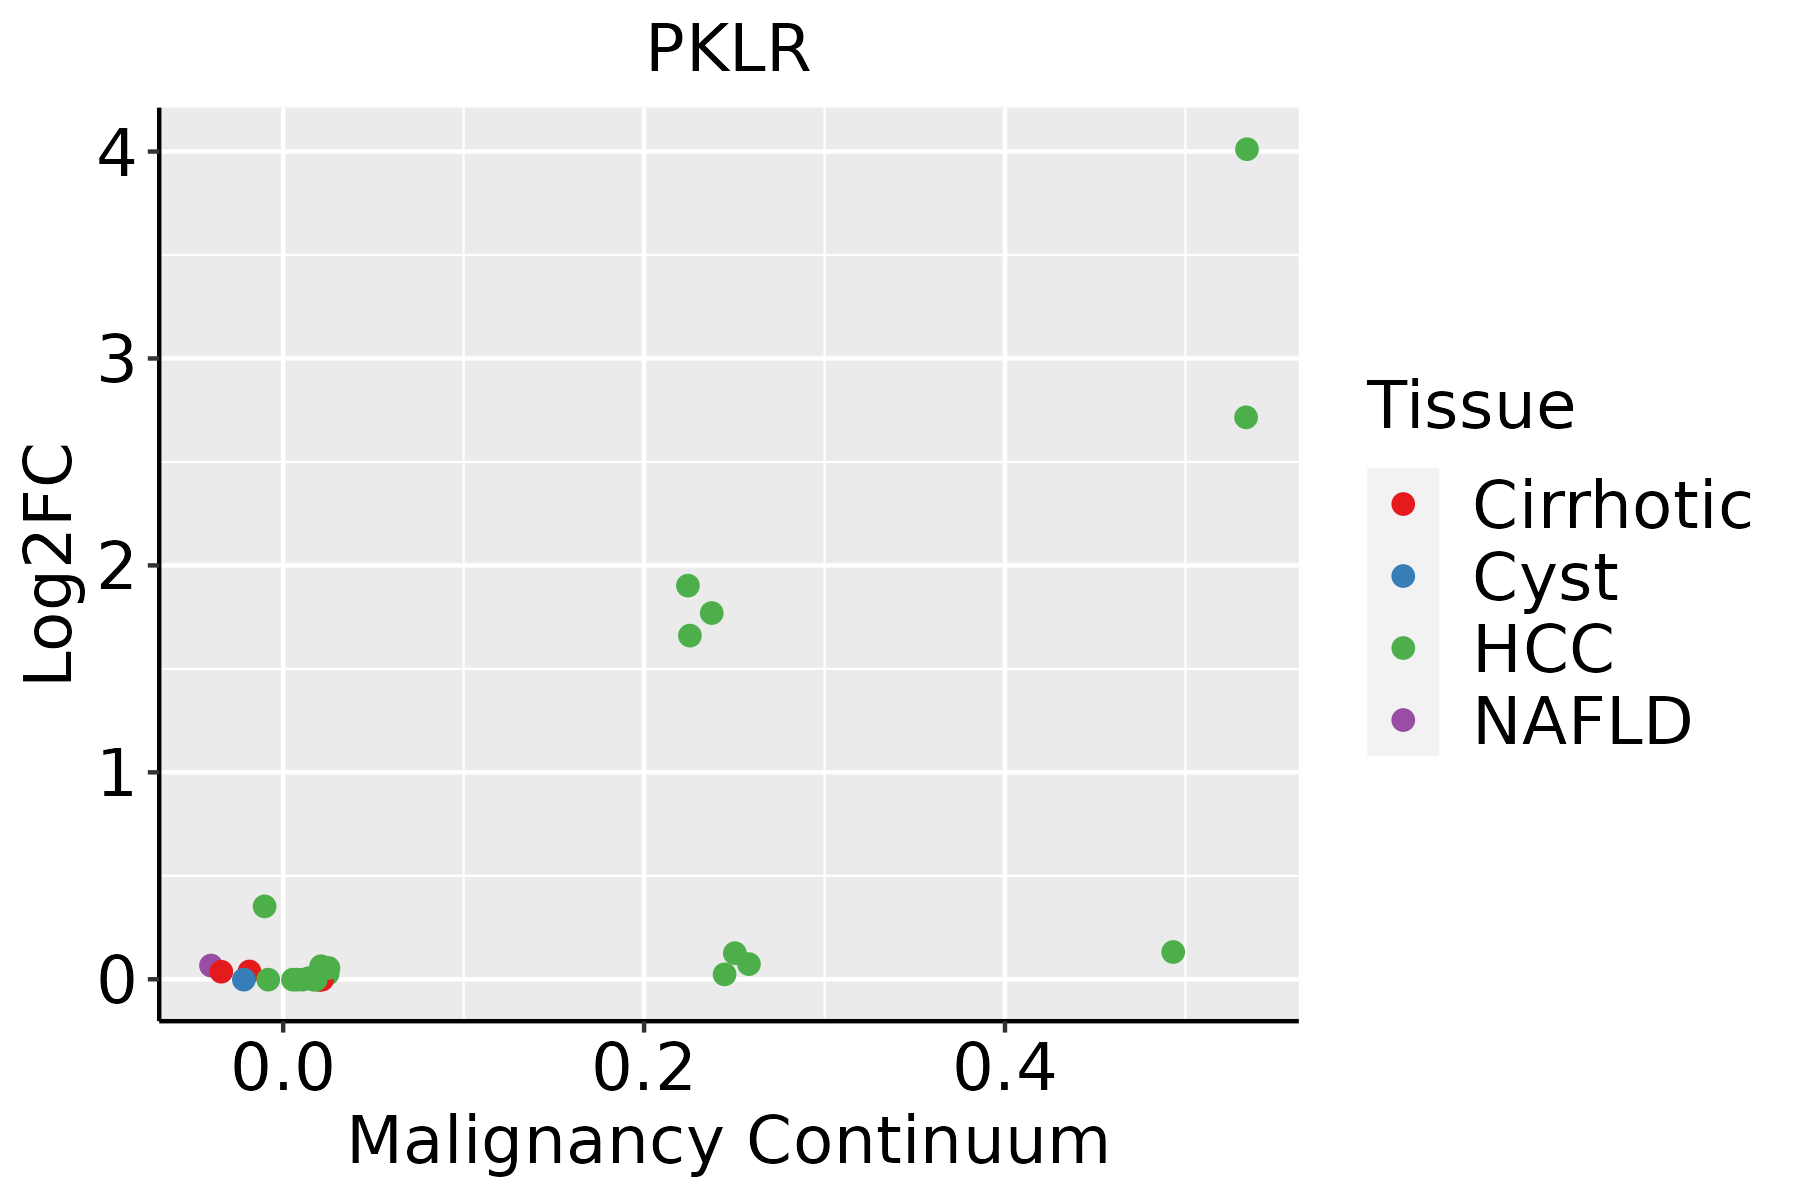 | HCC: Hepatocellular carcinoma |
| NAFLD: Non-alcoholic fatty liver disease |
| ∗log2FC in expression of this searched gene in stem-like cells from each diseased tissue sample relative to stem-like cells in normal samples in each tissue plotted against the malignancy continuum. Samples are colored based on if they are from different disease stage. |
Top |
Malignant transformation related pathway analysis |
| Find out the enriched GO biological processes and KEGG pathways involved in transition from healthy to precancer to cancer |
| Tissue | Disease Stage | Enriched GO biological Processes |
| Colorectum | AD |  |
| Colorectum | SER |  |
| Colorectum | MSS |  |
| Colorectum | MSI-H |  |
| Colorectum | FAP |  |
| ∗Top 15 enriched GO BP terms are showed in the bar plot of each disease state in each tissue. Each row represents a significant GO biological process which is colored according to the -log10(p.adjust). |
| Page: 1 2 3 4 5 6 7 8 9 |
| GO ID | Tissue | Disease Stage | Description | Gene Ratio | Bg Ratio | pvalue | p.adjust | Count |
| GO:000609122 | Liver | HCC | generation of precursor metabolites and energy | 340/7958 | 490/18723 | 4.04e-34 | 2.85e-31 | 340 |
| GO:004603422 | Liver | HCC | ATP metabolic process | 198/7958 | 277/18723 | 8.30e-23 | 1.55e-20 | 198 |
| GO:000911722 | Liver | HCC | nucleotide metabolic process | 300/7958 | 489/18723 | 1.61e-17 | 1.71e-15 | 300 |
| GO:000675322 | Liver | HCC | nucleoside phosphate metabolic process | 304/7958 | 497/18723 | 1.78e-17 | 1.85e-15 | 304 |
| GO:001969322 | Liver | HCC | ribose phosphate metabolic process | 248/7958 | 396/18723 | 3.15e-16 | 2.70e-14 | 248 |
| GO:000925922 | Liver | HCC | ribonucleotide metabolic process | 240/7958 | 385/18723 | 2.07e-15 | 1.51e-13 | 240 |
| GO:001605321 | Liver | HCC | organic acid biosynthetic process | 200/7958 | 316/18723 | 5.24e-14 | 3.22e-12 | 200 |
| GO:003286821 | Liver | HCC | response to insulin | 172/7958 | 264/18723 | 7.14e-14 | 4.23e-12 | 172 |
| GO:004639421 | Liver | HCC | carboxylic acid biosynthetic process | 198/7958 | 314/18723 | 1.19e-13 | 6.78e-12 | 198 |
| GO:000915022 | Liver | HCC | purine ribonucleotide metabolic process | 226/7958 | 368/18723 | 1.36e-13 | 7.69e-12 | 226 |
| GO:007252122 | Liver | HCC | purine-containing compound metabolic process | 250/7958 | 416/18723 | 2.26e-13 | 1.24e-11 | 250 |
| GO:003286921 | Liver | HCC | cellular response to insulin stimulus | 137/7958 | 203/18723 | 4.69e-13 | 2.44e-11 | 137 |
| GO:004343422 | Liver | HCC | response to peptide hormone | 247/7958 | 414/18723 | 9.55e-13 | 4.77e-11 | 247 |
| GO:003166722 | Liver | HCC | response to nutrient levels | 276/7958 | 474/18723 | 2.30e-12 | 1.08e-10 | 276 |
| GO:000616322 | Liver | HCC | purine nucleotide metabolic process | 236/7958 | 396/18723 | 3.59e-12 | 1.62e-10 | 236 |
| GO:007137521 | Liver | HCC | cellular response to peptide hormone stimulus | 179/7958 | 290/18723 | 2.54e-11 | 9.88e-10 | 179 |
| GO:190165321 | Liver | HCC | cellular response to peptide | 211/7958 | 359/18723 | 2.86e-10 | 9.63e-09 | 211 |
| GO:000758421 | Liver | HCC | response to nutrient | 111/7958 | 174/18723 | 1.10e-08 | 2.73e-07 | 111 |
| GO:000940811 | Liver | HCC | response to heat | 76/7958 | 110/18723 | 1.48e-08 | 3.58e-07 | 76 |
| GO:000609022 | Liver | HCC | pyruvate metabolic process | 73/7958 | 106/18723 | 3.52e-08 | 7.82e-07 | 73 |
| Page: 1 2 3 |
| Pathway ID | Tissue | Disease Stage | Description | Gene Ratio | Bg Ratio | pvalue | p.adjust | qvalue | Count |
| hsa0493242 | Liver | HCC | Non-alcoholic fatty liver disease | 124/4020 | 155/8465 | 4.54e-17 | 2.54e-15 | 1.41e-15 | 124 |
| hsa0120041 | Liver | HCC | Carbon metabolism | 89/4020 | 115/8465 | 3.92e-11 | 6.56e-10 | 3.65e-10 | 89 |
| hsa0491041 | Liver | HCC | Insulin signaling pathway | 95/4020 | 137/8465 | 1.53e-07 | 1.97e-06 | 1.10e-06 | 95 |
| hsa0062021 | Liver | HCC | Pyruvate metabolism | 37/4020 | 47/8465 | 1.10e-05 | 8.03e-05 | 4.46e-05 | 37 |
| hsa0123021 | Liver | HCC | Biosynthesis of amino acids | 53/4020 | 75/8465 | 3.79e-05 | 2.11e-04 | 1.18e-04 | 53 |
| hsa0001022 | Liver | HCC | Glycolysis / Gluconeogenesis | 43/4020 | 67/8465 | 4.26e-03 | 1.29e-02 | 7.15e-03 | 43 |
| hsa0493252 | Liver | HCC | Non-alcoholic fatty liver disease | 124/4020 | 155/8465 | 4.54e-17 | 2.54e-15 | 1.41e-15 | 124 |
| hsa0120051 | Liver | HCC | Carbon metabolism | 89/4020 | 115/8465 | 3.92e-11 | 6.56e-10 | 3.65e-10 | 89 |
| hsa0491051 | Liver | HCC | Insulin signaling pathway | 95/4020 | 137/8465 | 1.53e-07 | 1.97e-06 | 1.10e-06 | 95 |
| hsa0062031 | Liver | HCC | Pyruvate metabolism | 37/4020 | 47/8465 | 1.10e-05 | 8.03e-05 | 4.46e-05 | 37 |
| hsa0123031 | Liver | HCC | Biosynthesis of amino acids | 53/4020 | 75/8465 | 3.79e-05 | 2.11e-04 | 1.18e-04 | 53 |
| hsa0001032 | Liver | HCC | Glycolysis / Gluconeogenesis | 43/4020 | 67/8465 | 4.26e-03 | 1.29e-02 | 7.15e-03 | 43 |
| Page: 1 |
Top |
Cell-cell communication analysis |
| Identification of potential cell-cell interactions between two cell types and their ligand-receptor pairs for different disease states |
| Ligand | Receptor | LRpair | Pathway | Tissue | Disease Stage |
| Page: 1 |
Top |
Single-cell gene regulatory network inference analysis |
| Find out the significant the regulons (TFs) and the target genes of each regulon across cell types for different disease states |
| TF | Cell Type | Tissue | Disease Stage | Target Gene | RSS | Regulon Activity |
| ∗The dot plots of a searched regulon are shown for all cell subpopulations in each disease state of each tissue based on the regulon specific score inferred using pySCENIC and by calculating the average expression. |
| Page: 1 |
Top |
Somatic mutation of malignant transformation related genes |
| Annotation of somatic variants for genes involved in malignant transformation |
| Hugo Symbol | Variant Class | Variant Classification | dbSNP RS | HGVSc | HGVSp | HGVSp Short | SWISSPROT | BIOTYPE | SIFT | PolyPhen | Tumor Sample Barcode | Tissue | Histology | Sex | Age | Stage | Therapy Types | Drugs | Outcome |
| PKLR | SNV | Missense_Mutation | c.483G>C | p.Glu161Asp | p.E161D | P30613 | protein_coding | deleterious(0.02) | possibly_damaging(0.666) | TCGA-AC-A23H-01 | Breast | breast invasive carcinoma | Female | >=65 | I/II | Unknown | Unknown | PD | |
| PKLR | SNV | Missense_Mutation | c.589N>A | p.Ala197Thr | p.A197T | P30613 | protein_coding | tolerated(0.47) | benign(0.02) | TCGA-BH-A0HY-01 | Breast | breast invasive carcinoma | Female | <65 | I/II | Hormone Therapy | taxotere | CR | |
| PKLR | SNV | Missense_Mutation | novel | c.1401T>G | p.Cys467Trp | p.C467W | P30613 | protein_coding | tolerated(0.1) | probably_damaging(0.951) | TCGA-D8-A27F-01 | Breast | breast invasive carcinoma | Female | <65 | I/II | Chemotherapy | adriamycin+cyclophosphamide | SD |
| PKLR | SNV | Missense_Mutation | c.1592G>A | p.Arg531His | p.R531H | P30613 | protein_coding | tolerated(0.29) | benign(0.003) | TCGA-E9-A22B-01 | Breast | breast invasive carcinoma | Female | >=65 | I/II | Hormone Therapy | tamoxiphen | SD | |
| PKLR | SNV | Missense_Mutation | novel | c.472A>C | p.Lys158Gln | p.K158Q | P30613 | protein_coding | deleterious(0.01) | possibly_damaging(0.579) | TCGA-E9-A5FK-01 | Breast | breast invasive carcinoma | Female | <65 | III/IV | Chemotherapy | cyclophosphamide | CR |
| PKLR | insertion | Frame_Shift_Ins | novel | c.1029_1030insGGCGCCGCGGGCCAGCACACTGAGCAGCCCA | p.Ile344GlyfsTer67 | p.I344Gfs*67 | P30613 | protein_coding | TCGA-BH-A0AY-01 | Breast | breast invasive carcinoma | Female | <65 | I/II | Chemotherapy | SD | |||
| PKLR | deletion | Frame_Shift_Del | novel | c.1475delC | p.Ala492GlufsTer38 | p.A492Efs*38 | P30613 | protein_coding | TCGA-D8-A27V-01 | Breast | breast invasive carcinoma | Female | <65 | I/II | Hormone Therapy | tamoxiphen | SD | ||
| PKLR | SNV | Missense_Mutation | c.373G>A | p.Glu125Lys | p.E125K | P30613 | protein_coding | deleterious(0.01) | possibly_damaging(0.481) | TCGA-C5-A3HE-01 | Cervix | cervical & endocervical cancer | Female | <65 | I/II | Unknown | Unknown | PD | |
| PKLR | SNV | Missense_Mutation | c.128N>C | p.Ser43Thr | p.S43T | P30613 | protein_coding | tolerated_low_confidence(0.19) | benign(0.003) | TCGA-EK-A2H0-01 | Cervix | cervical & endocervical cancer | Female | <65 | I/II | Chemotherapy | cisplatin | CR | |
| PKLR | SNV | Missense_Mutation | rs748700869 | c.1363N>G | p.Thr455Ala | p.T455A | P30613 | protein_coding | tolerated(0.31) | benign(0.006) | TCGA-HM-A4S6-01 | Cervix | cervical & endocervical cancer | Female | <65 | III/IV | Chemotherapy | cisplatin | CR |
| Page: 1 2 3 4 5 6 7 8 9 10 |
Top |
Related drugs of malignant transformation related genes |
| Identification of chemicals and drugs interact with genes involved in malignant transfromation |
| (DGIdb 4.0) |
| Entrez ID | Symbol | Category | Interaction Types | Drug Claim Name | Drug Name | PMIDs |
| Page: 1 |

Copyright 2023-Present -The University of Texas Health Science Center at Houston |