
|
|||||
|
 | |
| |
| |
| |
| |
| |
|
Gene: PKIG |
Gene summary for PKIG |
| Gene information | Species | Human | Gene symbol | PKIG | Gene ID | 11142 |
| Gene name | cAMP-dependent protein kinase inhibitor gamma | |
| Gene Alias | PKI-gamma | |
| Cytomap | 20q13.12 | |
| Gene Type | protein-coding | GO ID | GO:0000122 | UniProtAcc | Q549H9 |
Top |
Malignant transformation analysis |
| Identification of the aberrant gene expression in precancerous and cancerous lesions by comparing the gene expression of stem-like cells in diseased tissues with normal stem cells |
| Entrez ID | Symbol | Replicates | Species | Organ | Tissue | Adj P-value | Log2FC | Malignancy |
| 11142 | PKIG | LZE7T | Human | Esophagus | ESCC | 2.86e-02 | 1.14e-01 | 0.0667 |
| 11142 | PKIG | LZE24T | Human | Esophagus | ESCC | 1.26e-13 | 4.42e-01 | 0.0596 |
| 11142 | PKIG | P1T-E | Human | Esophagus | ESCC | 1.04e-04 | 3.50e-01 | 0.0875 |
| 11142 | PKIG | P2T-E | Human | Esophagus | ESCC | 1.17e-29 | 6.06e-01 | 0.1177 |
| 11142 | PKIG | P4T-E | Human | Esophagus | ESCC | 2.42e-19 | 4.88e-01 | 0.1323 |
| 11142 | PKIG | P5T-E | Human | Esophagus | ESCC | 1.85e-11 | 4.14e-01 | 0.1327 |
| 11142 | PKIG | P8T-E | Human | Esophagus | ESCC | 1.69e-08 | 2.97e-01 | 0.0889 |
| 11142 | PKIG | P9T-E | Human | Esophagus | ESCC | 1.84e-13 | 4.71e-01 | 0.1131 |
| 11142 | PKIG | P10T-E | Human | Esophagus | ESCC | 1.43e-45 | 8.94e-01 | 0.116 |
| 11142 | PKIG | P11T-E | Human | Esophagus | ESCC | 4.97e-08 | 2.41e-01 | 0.1426 |
| 11142 | PKIG | P15T-E | Human | Esophagus | ESCC | 5.81e-07 | 2.03e-01 | 0.1149 |
| 11142 | PKIG | P16T-E | Human | Esophagus | ESCC | 1.43e-42 | 8.84e-01 | 0.1153 |
| 11142 | PKIG | P17T-E | Human | Esophagus | ESCC | 3.59e-03 | 2.63e-01 | 0.1278 |
| 11142 | PKIG | P19T-E | Human | Esophagus | ESCC | 1.09e-03 | 1.14e+00 | 0.1662 |
| 11142 | PKIG | P20T-E | Human | Esophagus | ESCC | 1.90e-18 | 5.18e-01 | 0.1124 |
| 11142 | PKIG | P21T-E | Human | Esophagus | ESCC | 3.52e-20 | 4.66e-01 | 0.1617 |
| 11142 | PKIG | P22T-E | Human | Esophagus | ESCC | 3.69e-36 | 7.71e-01 | 0.1236 |
| 11142 | PKIG | P23T-E | Human | Esophagus | ESCC | 8.11e-05 | 4.10e-01 | 0.108 |
| 11142 | PKIG | P24T-E | Human | Esophagus | ESCC | 9.50e-13 | 4.10e-01 | 0.1287 |
| 11142 | PKIG | P26T-E | Human | Esophagus | ESCC | 2.28e-42 | 8.23e-01 | 0.1276 |
| Page: 1 2 3 4 5 |
| Tissue | Expression Dynamics | Abbreviation |
| Esophagus | 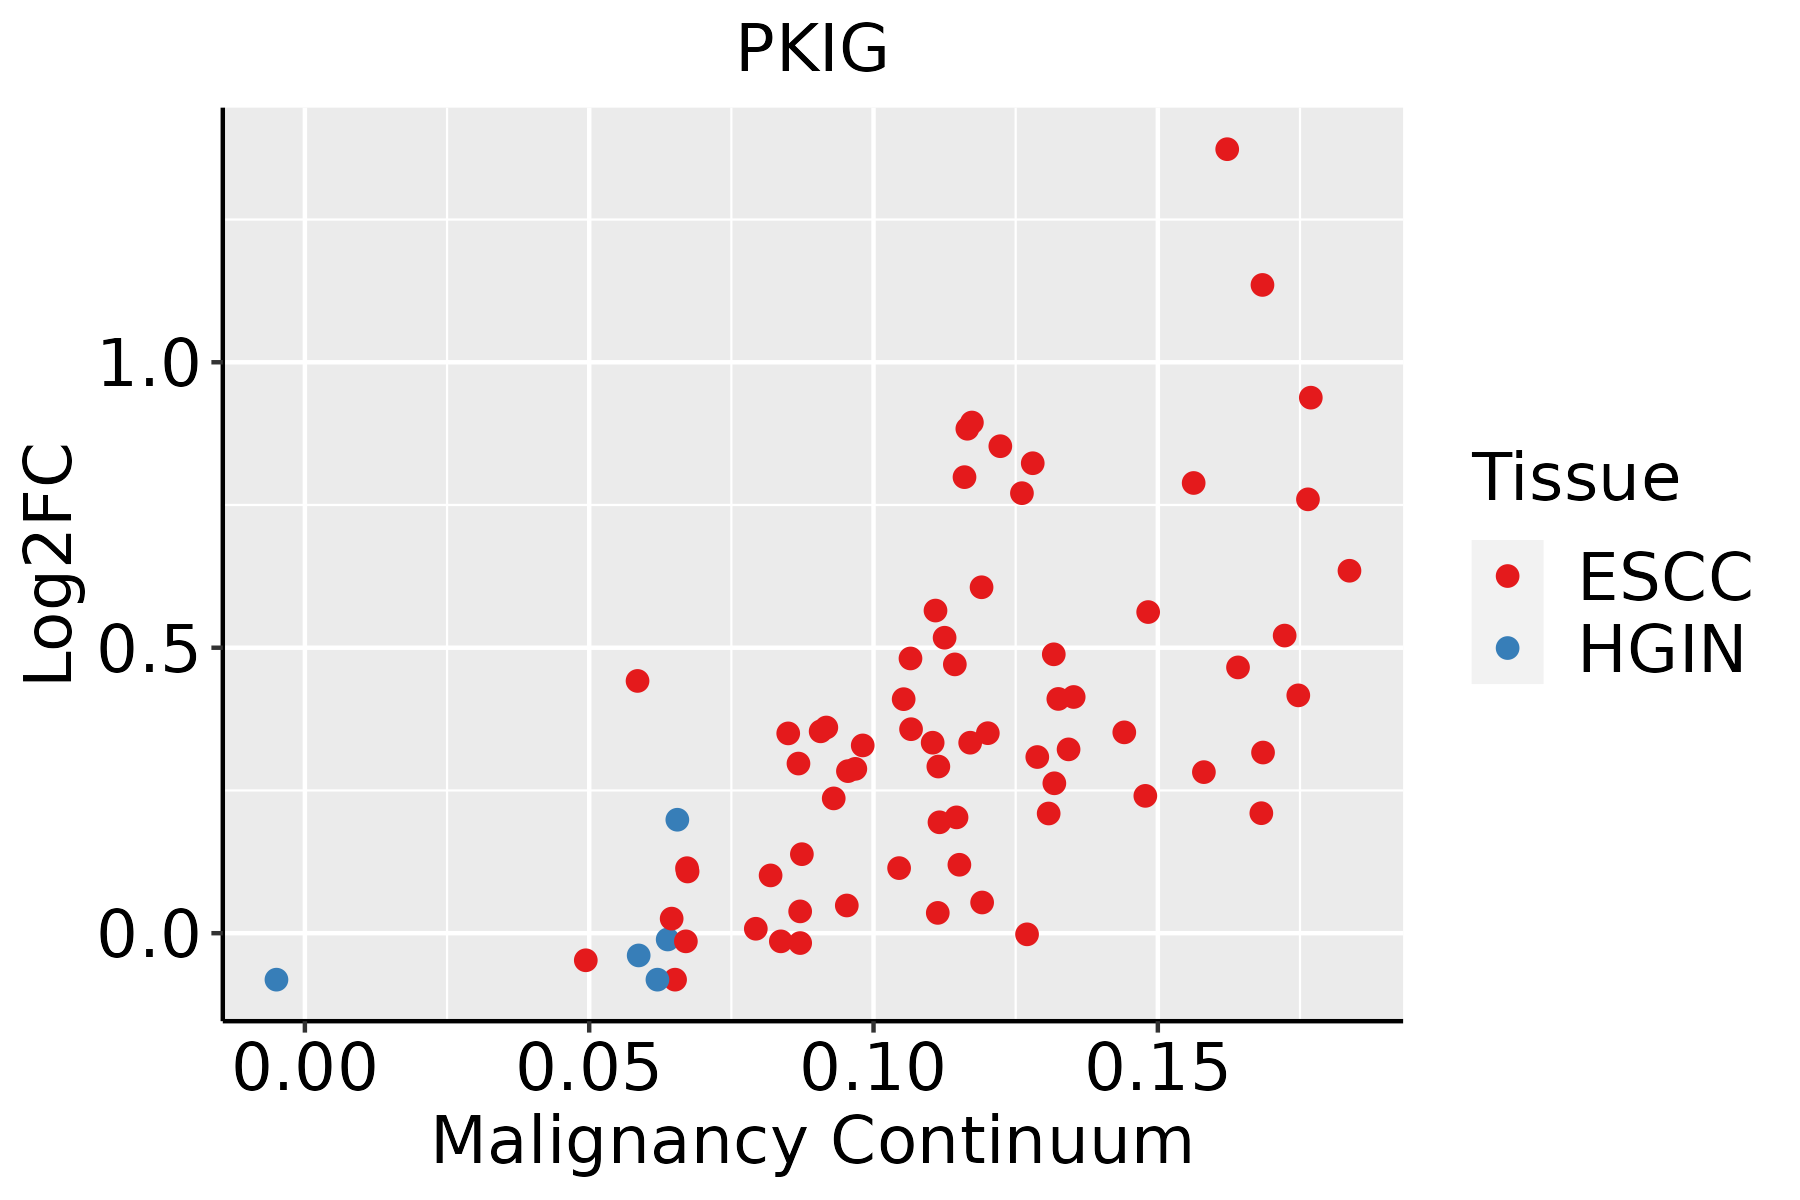 | ESCC: Esophageal squamous cell carcinoma |
| HGIN: High-grade intraepithelial neoplasias | ||
| LGIN: Low-grade intraepithelial neoplasias | ||
| Liver | 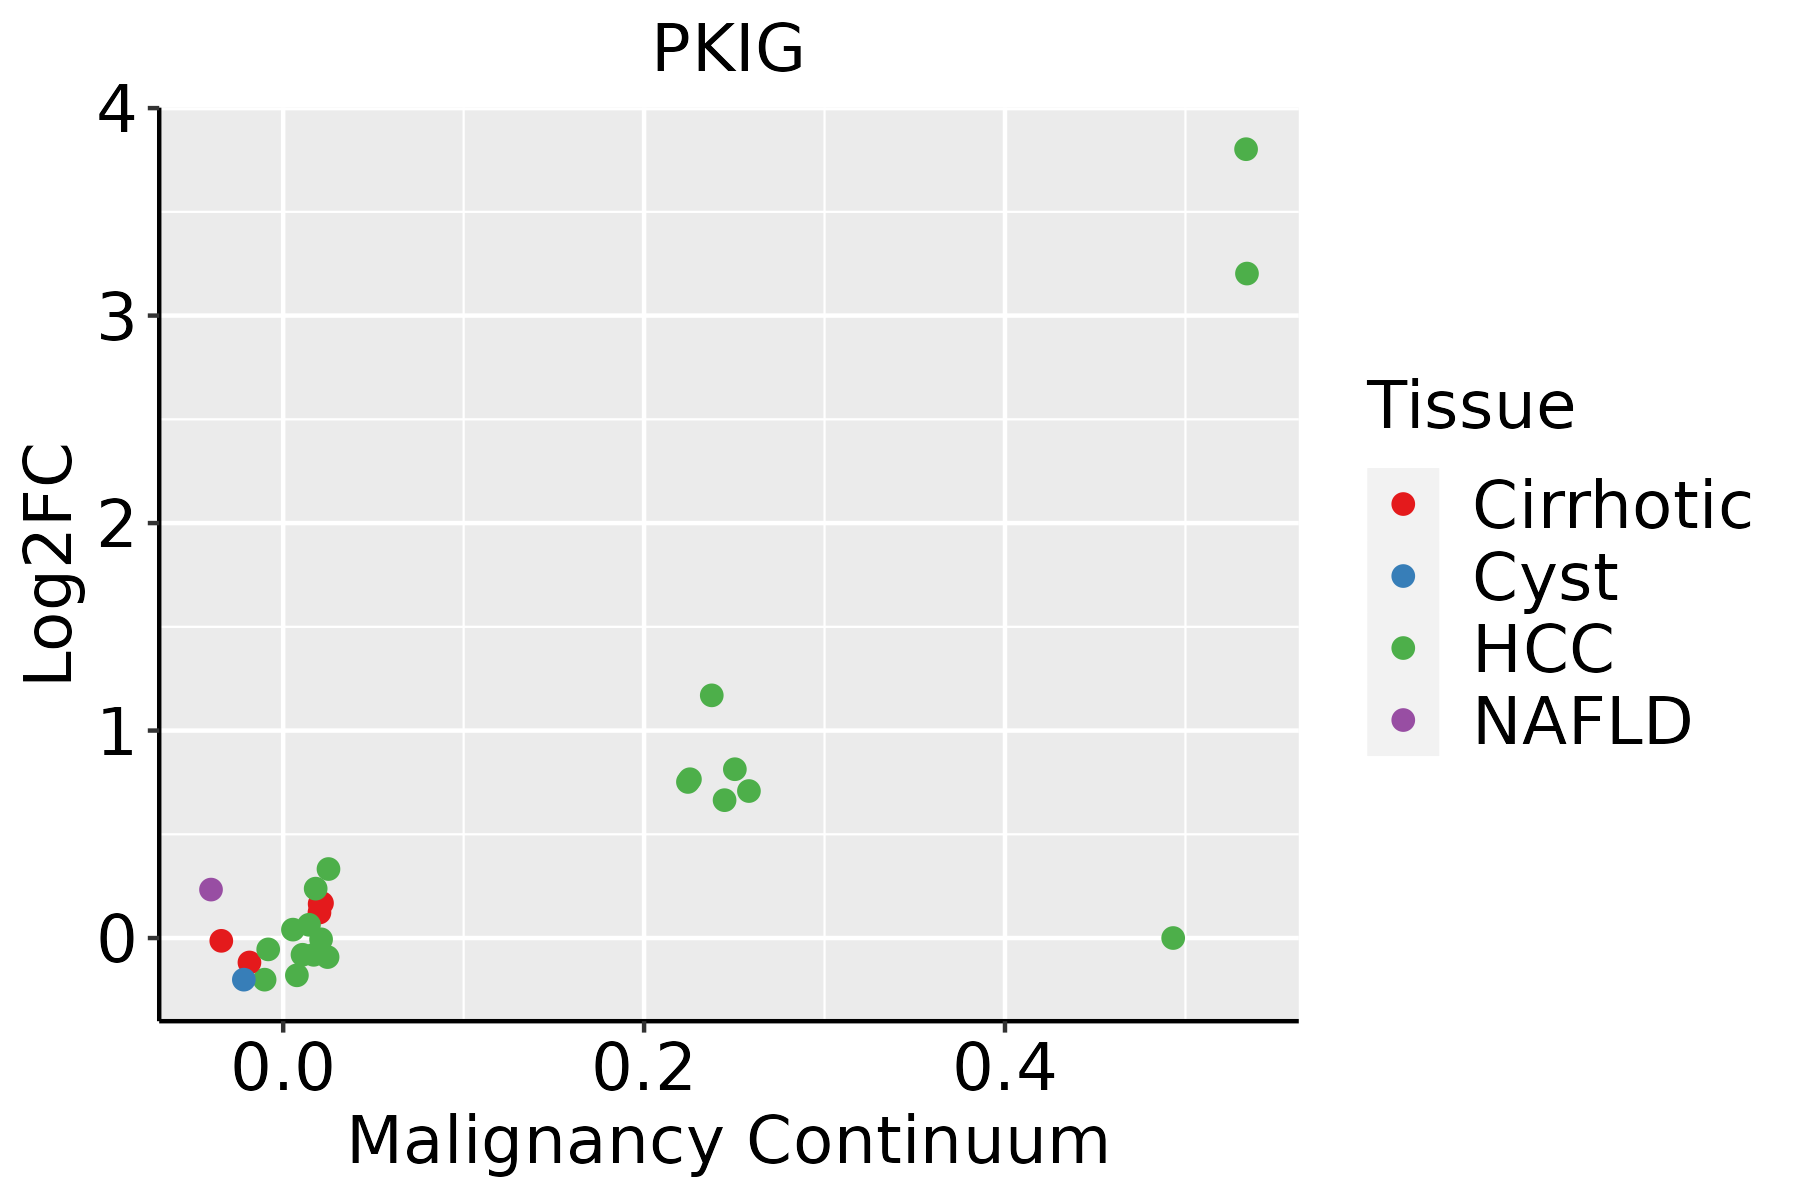 | HCC: Hepatocellular carcinoma |
| NAFLD: Non-alcoholic fatty liver disease | ||
| Oral Cavity |  | EOLP: Erosive Oral lichen planus |
| LP: leukoplakia | ||
| NEOLP: Non-erosive oral lichen planus | ||
| OSCC: Oral squamous cell carcinoma | ||
| Thyroid | 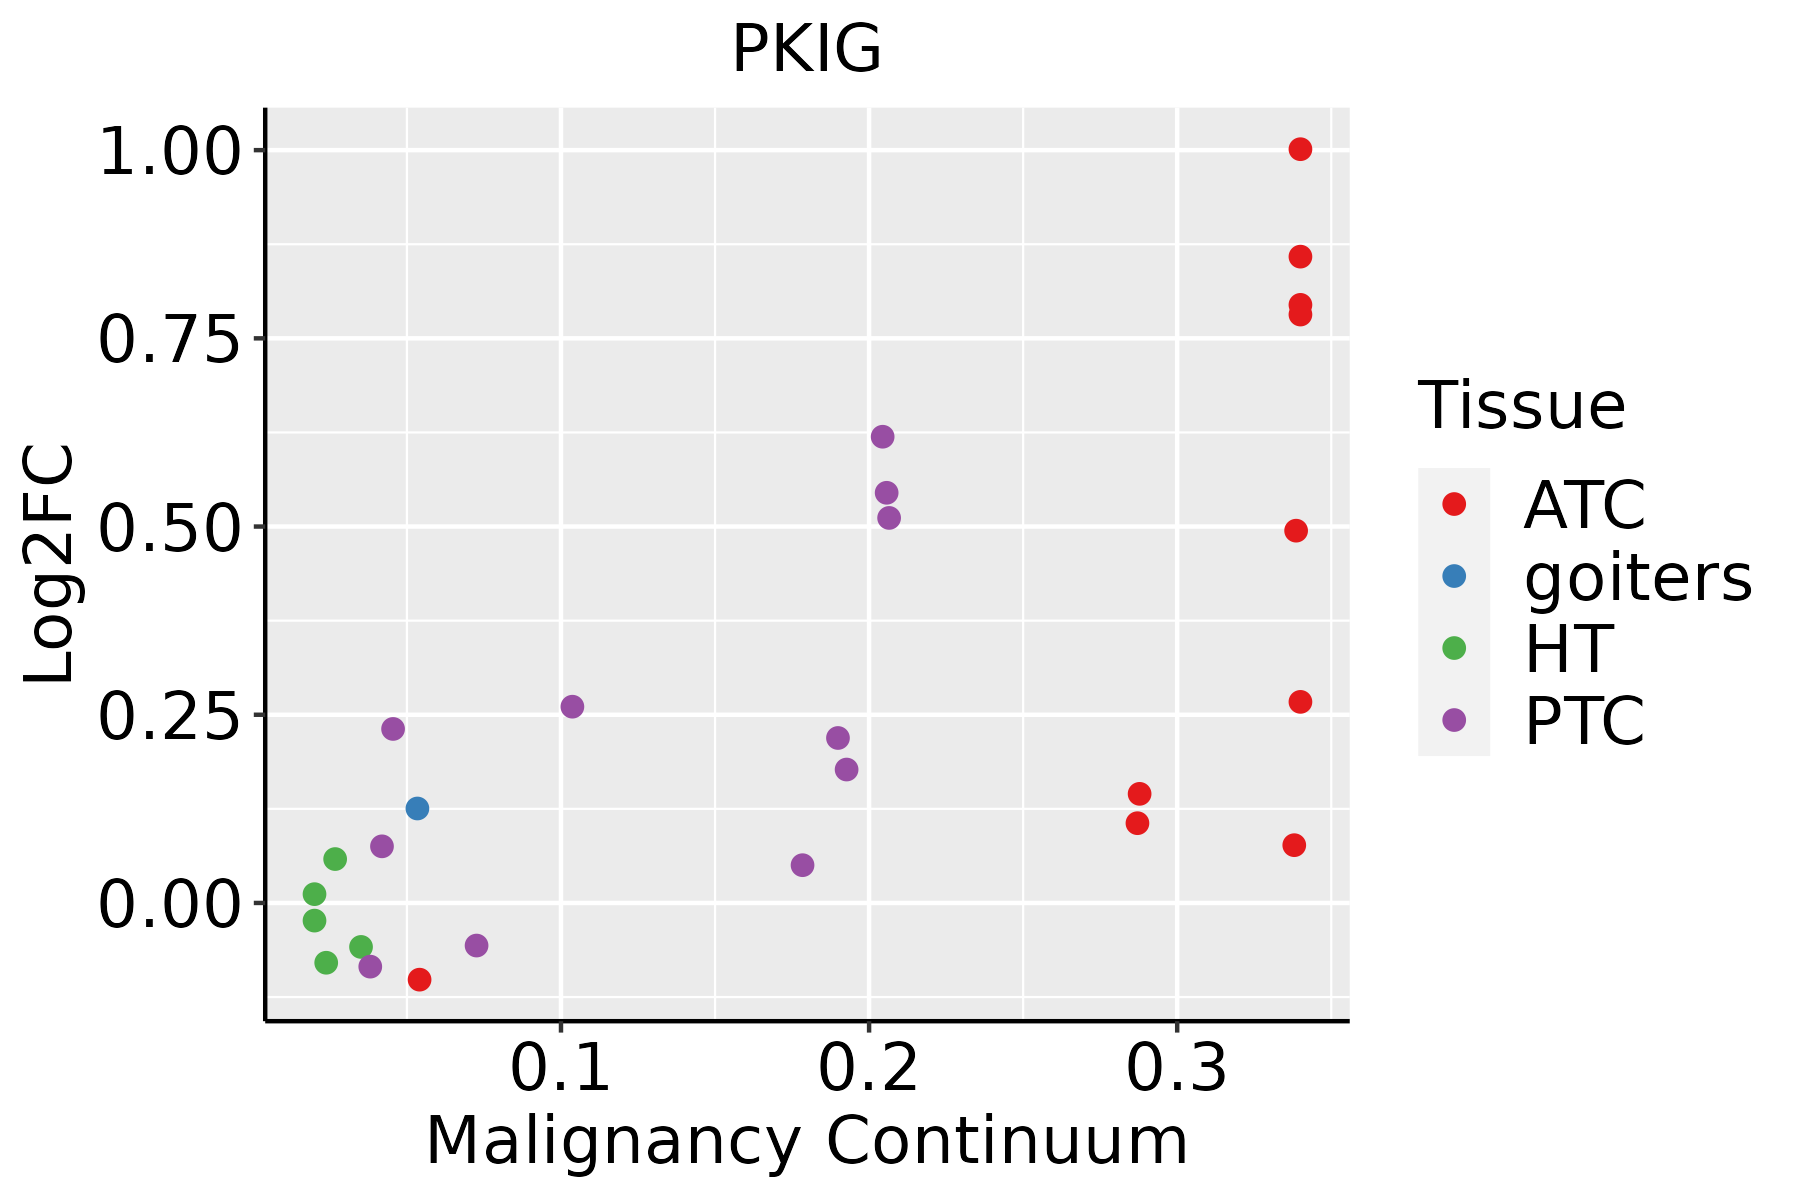 | ATC: Anaplastic thyroid cancer |
| HT: Hashimoto's thyroiditis | ||
| PTC: Papillary thyroid cancer |
| ∗log2FC in expression of this searched gene in stem-like cells from each diseased tissue sample relative to stem-like cells in normal samples in each tissue plotted against the malignancy continuum. Samples are colored based on if they are from different disease stage. |
Top |
Malignant transformation related pathway analysis |
| Find out the enriched GO biological processes and KEGG pathways involved in transition from healthy to precancer to cancer |
| Tissue | Disease Stage | Enriched GO biological Processes |
| Colorectum | AD |  |
| Colorectum | SER |  |
| Colorectum | MSS |  |
| Colorectum | MSI-H |  |
| Colorectum | FAP |  |
| ∗Top 15 enriched GO BP terms are showed in the bar plot of each disease state in each tissue. Each row represents a significant GO biological process which is colored according to the -log10(p.adjust). |
| Page: 1 2 3 4 5 6 7 8 9 |
| GO ID | Tissue | Disease Stage | Description | Gene Ratio | Bg Ratio | pvalue | p.adjust | Count |
| GO:0072594110 | Esophagus | ESCC | establishment of protein localization to organelle | 311/8552 | 422/18723 | 3.02e-32 | 2.13e-29 | 311 |
| GO:0006913110 | Esophagus | ESCC | nucleocytoplasmic transport | 230/8552 | 301/18723 | 6.04e-28 | 2.02e-25 | 230 |
| GO:0051169110 | Esophagus | ESCC | nuclear transport | 230/8552 | 301/18723 | 6.04e-28 | 2.02e-25 | 230 |
| GO:003238618 | Esophagus | ESCC | regulation of intracellular transport | 243/8552 | 337/18723 | 3.20e-23 | 7.25e-21 | 243 |
| GO:003450418 | Esophagus | ESCC | protein localization to nucleus | 211/8552 | 290/18723 | 4.06e-21 | 6.60e-19 | 211 |
| GO:0033157110 | Esophagus | ESCC | regulation of intracellular protein transport | 169/8552 | 229/18723 | 3.31e-18 | 3.23e-16 | 169 |
| GO:0046822110 | Esophagus | ESCC | regulation of nucleocytoplasmic transport | 88/8552 | 106/18723 | 1.88e-15 | 1.19e-13 | 88 |
| GO:001703818 | Esophagus | ESCC | protein import | 149/8552 | 206/18723 | 5.90e-15 | 3.31e-13 | 149 |
| GO:0010563111 | Esophagus | ESCC | negative regulation of phosphorus metabolic process | 274/8552 | 442/18723 | 2.32e-12 | 9.41e-11 | 274 |
| GO:190018018 | Esophagus | ESCC | regulation of protein localization to nucleus | 102/8552 | 136/18723 | 2.84e-12 | 1.13e-10 | 102 |
| GO:0045936111 | Esophagus | ESCC | negative regulation of phosphate metabolic process | 273/8552 | 441/18723 | 3.18e-12 | 1.25e-10 | 273 |
| GO:0051348111 | Esophagus | ESCC | negative regulation of transferase activity | 177/8552 | 268/18723 | 1.08e-11 | 4.00e-10 | 177 |
| GO:007190016 | Esophagus | ESCC | regulation of protein serine/threonine kinase activity | 227/8552 | 359/18723 | 1.12e-11 | 4.10e-10 | 227 |
| GO:0042326111 | Esophagus | ESCC | negative regulation of phosphorylation | 237/8552 | 385/18723 | 1.86e-10 | 5.33e-09 | 237 |
| GO:0001933111 | Esophagus | ESCC | negative regulation of protein phosphorylation | 213/8552 | 342/18723 | 3.54e-10 | 9.76e-09 | 213 |
| GO:005117014 | Esophagus | ESCC | import into nucleus | 111/8552 | 159/18723 | 5.69e-10 | 1.44e-08 | 111 |
| GO:000660613 | Esophagus | ESCC | protein import into nucleus | 108/8552 | 155/18723 | 1.16e-09 | 2.77e-08 | 108 |
| GO:003367319 | Esophagus | ESCC | negative regulation of kinase activity | 154/8552 | 237/18723 | 1.38e-09 | 3.27e-08 | 154 |
| GO:000646920 | Esophagus | ESCC | negative regulation of protein kinase activity | 140/8552 | 212/18723 | 1.53e-09 | 3.56e-08 | 140 |
| GO:190458914 | Esophagus | ESCC | regulation of protein import | 49/8552 | 63/18723 | 1.91e-07 | 2.97e-06 | 49 |
| Page: 1 2 3 4 5 6 7 8 9 10 11 |
| Pathway ID | Tissue | Disease Stage | Description | Gene Ratio | Bg Ratio | pvalue | p.adjust | qvalue | Count |
| Page: 1 |
Top |
Cell-cell communication analysis |
| Identification of potential cell-cell interactions between two cell types and their ligand-receptor pairs for different disease states |
| Ligand | Receptor | LRpair | Pathway | Tissue | Disease Stage |
| Page: 1 |
Top |
Single-cell gene regulatory network inference analysis |
| Find out the significant the regulons (TFs) and the target genes of each regulon across cell types for different disease states |
| TF | Cell Type | Tissue | Disease Stage | Target Gene | RSS | Regulon Activity |
| ∗The dot plots of a searched regulon are shown for all cell subpopulations in each disease state of each tissue based on the regulon specific score inferred using pySCENIC and by calculating the average expression. |
| Page: 1 |
Top |
Somatic mutation of malignant transformation related genes |
| Annotation of somatic variants for genes involved in malignant transformation |
| Hugo Symbol | Variant Class | Variant Classification | dbSNP RS | HGVSc | HGVSp | HGVSp Short | SWISSPROT | BIOTYPE | SIFT | PolyPhen | Tumor Sample Barcode | Tissue | Histology | Sex | Age | Stage | Therapy Types | Drugs | Outcome |
| PKIG | SNV | Missense_Mutation | rs774154545 | c.142N>A | p.Glu48Lys | p.E48K | Q9Y2B9 | protein_coding | tolerated(0.31) | benign(0.013) | TCGA-AO-A0J3-01 | Breast | breast invasive carcinoma | Female | >=65 | I/II | Chemotherapy | cyclophosphamide | SD |
| PKIG | SNV | Missense_Mutation | rs773065456 | c.26N>T | p.Ser9Leu | p.S9L | Q9Y2B9 | protein_coding | tolerated(0.09) | possibly_damaging(0.68) | TCGA-D8-A27G-01 | Breast | breast invasive carcinoma | Female | >=65 | I/II | Unknown | Unknown | SD |
| PKIG | SNV | Missense_Mutation | novel | c.93G>T | p.Glu31Asp | p.E31D | Q9Y2B9 | protein_coding | tolerated(0.29) | benign(0.13) | TCGA-VS-A9U6-01 | Cervix | cervical & endocervical cancer | Female | <65 | I/II | Chemotherapy | cisplatin | PD |
| PKIG | SNV | Missense_Mutation | c.59N>A | p.Arg20Gln | p.R20Q | Q9Y2B9 | protein_coding | tolerated(0.12) | probably_damaging(0.961) | TCGA-A6-5661-01 | Colorectum | colon adenocarcinoma | Female | >=65 | I/II | Unknown | Unknown | SD | |
| PKIG | SNV | Missense_Mutation | rs371116661 | c.58C>T | p.Arg20Trp | p.R20W | Q9Y2B9 | protein_coding | deleterious(0.03) | benign(0.165) | TCGA-D5-6924-01 | Colorectum | colon adenocarcinoma | Male | >=65 | I/II | Unknown | Unknown | SD |
| PKIG | SNV | Missense_Mutation | rs765713497 | c.172N>A | p.Ala58Thr | p.A58T | Q9Y2B9 | protein_coding | tolerated(1) | benign(0) | TCGA-G4-6588-01 | Colorectum | colon adenocarcinoma | Female | <65 | I/II | Unknown | Unknown | SD |
| PKIG | SNV | Missense_Mutation | novel | c.170G>T | p.Ser57Ile | p.S57I | Q9Y2B9 | protein_coding | deleterious(0.04) | possibly_damaging(0.54) | TCGA-AP-A059-01 | Endometrium | uterine corpus endometrioid carcinoma | Female | >=65 | I/II | Unknown | Unknown | SD |
| PKIG | SNV | Missense_Mutation | novel | c.47N>A | p.Arg16Gln | p.R16Q | Q9Y2B9 | protein_coding | deleterious(0.05) | probably_damaging(0.961) | TCGA-AX-A1C9-01 | Endometrium | uterine corpus endometrioid carcinoma | Female | >=65 | I/II | Unknown | Unknown | SD |
| PKIG | SNV | Missense_Mutation | novel | c.91G>A | p.Glu31Lys | p.E31K | Q9Y2B9 | protein_coding | tolerated(0.36) | benign(0.021) | TCGA-AX-A2HC-01 | Endometrium | uterine corpus endometrioid carcinoma | Female | <65 | III/IV | Chemotherapy | paclitaxel | PD |
| PKIG | SNV | Missense_Mutation | novel | c.220A>T | p.Thr74Ser | p.T74S | Q9Y2B9 | protein_coding | tolerated(0.32) | benign(0.122) | TCGA-95-7043-01 | Lung | lung adenocarcinoma | Female | <65 | I/II | Unknown | Unknown | PD |
| Page: 1 2 |
Top |
Related drugs of malignant transformation related genes |
| Identification of chemicals and drugs interact with genes involved in malignant transfromation |
| (DGIdb 4.0) |
| Entrez ID | Symbol | Category | Interaction Types | Drug Claim Name | Drug Name | PMIDs |
| Page: 1 |

Copyright 2023-Present -The University of Texas Health Science Center at Houston |