
|
|||||
|
 | |
| |
| |
| |
| |
| |
|
Gene: PKHD1L1 |
Gene summary for PKHD1L1 |
| Gene information | Species | Human | Gene symbol | PKHD1L1 | Gene ID | 93035 |
| Gene name | PKHD1 like 1 | |
| Gene Alias | PKHDL1 | |
| Cytomap | 8q23.1-q23.2 | |
| Gene Type | protein-coding | GO ID | GO:0002376 | UniProtAcc | Q86WI1 |
Top |
Malignant transformation analysis |
| Identification of the aberrant gene expression in precancerous and cancerous lesions by comparing the gene expression of stem-like cells in diseased tissues with normal stem cells |
| Entrez ID | Symbol | Replicates | Species | Organ | Tissue | Adj P-value | Log2FC | Malignancy |
| 93035 | PKHD1L1 | AEH-subject1 | Human | Endometrium | AEH | 6.64e-04 | 3.40e-01 | -0.3059 |
| 93035 | PKHD1L1 | AEH-subject2 | Human | Endometrium | AEH | 2.79e-11 | 5.40e-01 | -0.2525 |
| 93035 | PKHD1L1 | AEH-subject3 | Human | Endometrium | AEH | 1.67e-37 | 9.11e-01 | -0.2576 |
| 93035 | PKHD1L1 | AEH-subject4 | Human | Endometrium | AEH | 4.30e-22 | 7.97e-01 | -0.2657 |
| 93035 | PKHD1L1 | AEH-subject5 | Human | Endometrium | AEH | 3.99e-91 | 1.48e+00 | -0.2953 |
| 93035 | PKHD1L1 | EEC-subject1 | Human | Endometrium | EEC | 1.49e-31 | 8.25e-01 | -0.2682 |
| 93035 | PKHD1L1 | EEC-subject2 | Human | Endometrium | EEC | 3.28e-09 | 4.13e-01 | -0.2607 |
| 93035 | PKHD1L1 | EEC-subject4 | Human | Endometrium | EEC | 1.50e-70 | 1.43e+00 | -0.2571 |
| 93035 | PKHD1L1 | EEC-subject5 | Human | Endometrium | EEC | 4.22e-07 | 3.50e-01 | -0.249 |
| 93035 | PKHD1L1 | male-WTA | Human | Thyroid | PTC | 3.66e-10 | 1.47e-01 | 0.1037 |
| 93035 | PKHD1L1 | nodule-WTA | Human | Thyroid | goiters | 6.71e-04 | 3.55e-01 | 0.0534 |
| Page: 1 |
| Tissue | Expression Dynamics | Abbreviation |
| Endometrium |  | AEH: Atypical endometrial hyperplasia |
| EEC: Endometrioid Cancer | ||
| Thyroid | 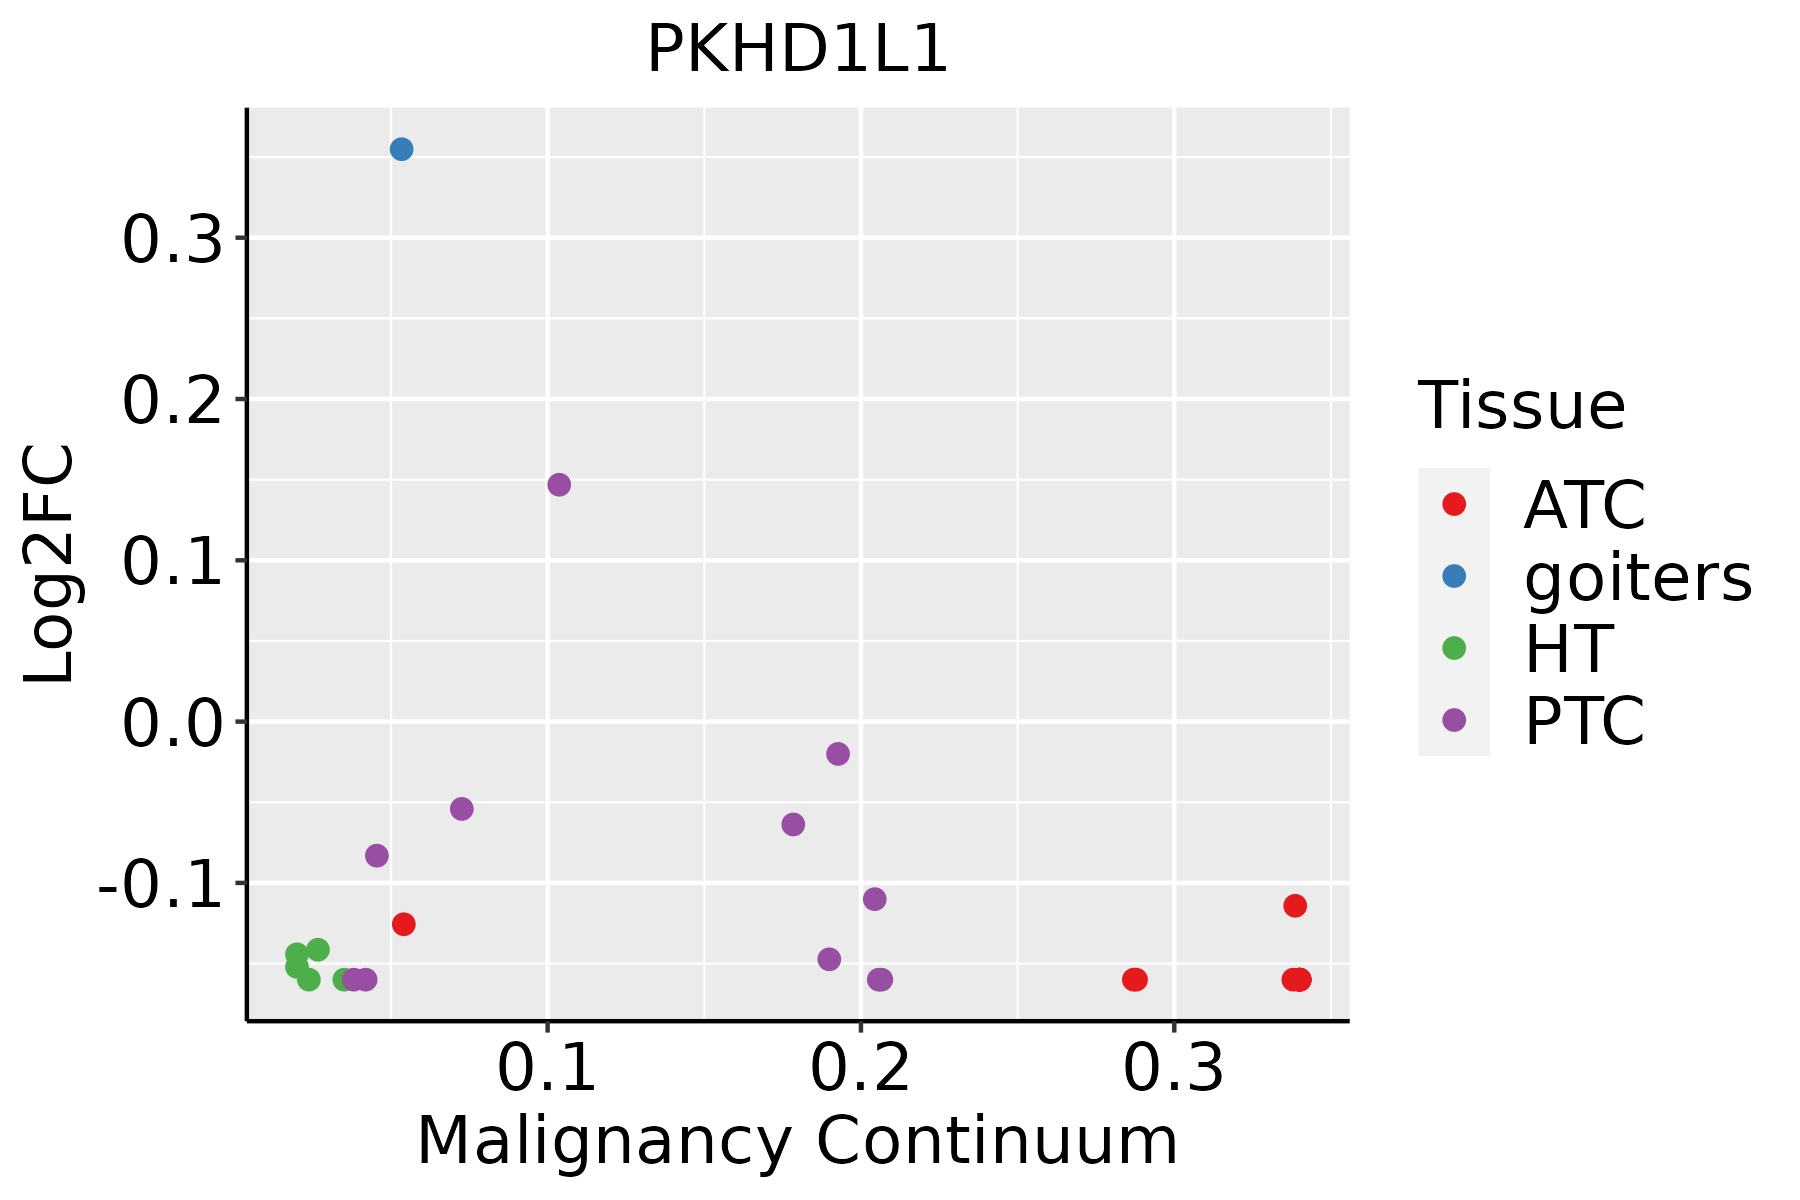 | ATC: Anaplastic thyroid cancer |
| HT: Hashimoto's thyroiditis | ||
| PTC: Papillary thyroid cancer |
| ∗log2FC in expression of this searched gene in stem-like cells from each diseased tissue sample relative to stem-like cells in normal samples in each tissue plotted against the malignancy continuum. Samples are colored based on if they are from different disease stage. |
Top |
Malignant transformation related pathway analysis |
| Find out the enriched GO biological processes and KEGG pathways involved in transition from healthy to precancer to cancer |
| Tissue | Disease Stage | Enriched GO biological Processes |
| Colorectum | AD |  |
| Colorectum | SER |  |
| Colorectum | MSS |  |
| Colorectum | MSI-H |  |
| Colorectum | FAP |  |
| ∗Top 15 enriched GO BP terms are showed in the bar plot of each disease state in each tissue. Each row represents a significant GO biological process which is colored according to the -log10(p.adjust). |
| Page: 1 2 3 4 5 6 7 8 9 |
| GO ID | Tissue | Disease Stage | Description | Gene Ratio | Bg Ratio | pvalue | p.adjust | Count |
| Page: 1 |
| Pathway ID | Tissue | Disease Stage | Description | Gene Ratio | Bg Ratio | pvalue | p.adjust | qvalue | Count |
| Page: 1 |
Top |
Cell-cell communication analysis |
| Identification of potential cell-cell interactions between two cell types and their ligand-receptor pairs for different disease states |
| Ligand | Receptor | LRpair | Pathway | Tissue | Disease Stage |
| Page: 1 |
Top |
Single-cell gene regulatory network inference analysis |
| Find out the significant the regulons (TFs) and the target genes of each regulon across cell types for different disease states |
| TF | Cell Type | Tissue | Disease Stage | Target Gene | RSS | Regulon Activity |
| ∗The dot plots of a searched regulon are shown for all cell subpopulations in each disease state of each tissue based on the regulon specific score inferred using pySCENIC and by calculating the average expression. |
| Page: 1 |
Top |
Somatic mutation of malignant transformation related genes |
| Annotation of somatic variants for genes involved in malignant transformation |
| Hugo Symbol | Variant Class | Variant Classification | dbSNP RS | HGVSc | HGVSp | HGVSp Short | SWISSPROT | BIOTYPE | SIFT | PolyPhen | Tumor Sample Barcode | Tissue | Histology | Sex | Age | Stage | Therapy Types | Drugs | Outcome |
| PKHD1L1 | SNV | Missense_Mutation | novel | c.1130N>A | p.Ala377Asp | p.A377D | Q86WI1 | protein_coding | tolerated(0.13) | benign(0.086) | TCGA-A2-A0SU-01 | Breast | breast invasive carcinoma | Female | >=65 | I/II | Hormone Therapy | arimidex | SD |
| PKHD1L1 | SNV | Missense_Mutation | c.11257C>T | p.Leu3753Phe | p.L3753F | Q86WI1 | protein_coding | tolerated(0.44) | benign(0.005) | TCGA-A8-A07R-01 | Breast | breast invasive carcinoma | Female | >=65 | III/IV | Ancillary | zoledronic | SD | |
| PKHD1L1 | SNV | Missense_Mutation | c.10066G>C | p.Asp3356His | p.D3356H | Q86WI1 | protein_coding | deleterious(0.04) | benign(0.045) | TCGA-A8-A085-01 | Breast | breast invasive carcinoma | Male | <65 | I/II | Hormone Therapy | tamoxiphen | SD | |
| PKHD1L1 | SNV | Missense_Mutation | c.12195N>T | p.Gln4065His | p.Q4065H | Q86WI1 | protein_coding | deleterious(0) | possibly_damaging(0.783) | TCGA-A8-A08L-01 | Breast | breast invasive carcinoma | Female | >=65 | III/IV | Unknown | Unknown | SD | |
| PKHD1L1 | SNV | Missense_Mutation | c.10357N>C | p.Asp3453His | p.D3453H | Q86WI1 | protein_coding | tolerated(0.12) | benign(0.014) | TCGA-A8-A08R-01 | Breast | breast invasive carcinoma | Female | <65 | I/II | Unknown | Unknown | SD | |
| PKHD1L1 | SNV | Missense_Mutation | c.6435N>A | p.Met2145Ile | p.M2145I | Q86WI1 | protein_coding | tolerated(0.34) | benign(0) | TCGA-A8-A08S-01 | Breast | breast invasive carcinoma | Female | >=65 | I/II | Hormone Therapy | anastrozole | SD | |
| PKHD1L1 | SNV | Missense_Mutation | c.4985A>G | p.Asp1662Gly | p.D1662G | Q86WI1 | protein_coding | deleterious(0.01) | possibly_damaging(0.72) | TCGA-A8-A095-01 | Breast | breast invasive carcinoma | Female | <65 | I/II | Chemotherapy | 5-fluorouracil | CR | |
| PKHD1L1 | SNV | Missense_Mutation | novel | c.3958G>T | p.Asp1320Tyr | p.D1320Y | Q86WI1 | protein_coding | deleterious(0.01) | benign(0.031) | TCGA-A8-A09M-01 | Breast | breast invasive carcinoma | Female | >=65 | III/IV | Chemotherapy | paclitaxel | CR |
| PKHD1L1 | SNV | Missense_Mutation | c.1297N>G | p.His433Asp | p.H433D | Q86WI1 | protein_coding | tolerated(0.16) | benign(0.133) | TCGA-AC-A23H-01 | Breast | breast invasive carcinoma | Female | >=65 | I/II | Unknown | Unknown | PD | |
| PKHD1L1 | SNV | Missense_Mutation | novel | c.2743N>C | p.Asn915His | p.N915H | Q86WI1 | protein_coding | tolerated(0.11) | possibly_damaging(0.641) | TCGA-AN-A046-01 | Breast | breast invasive carcinoma | Female | >=65 | I/II | Unknown | Unknown | SD |
| Page: 1 2 3 4 5 6 7 8 9 10 11 12 13 14 15 16 17 18 19 20 21 22 23 24 25 26 27 28 29 30 31 32 33 34 35 36 37 38 39 40 41 42 43 44 45 46 47 48 49 50 51 52 53 54 55 56 57 58 59 60 61 62 63 |
Top |
Related drugs of malignant transformation related genes |
| Identification of chemicals and drugs interact with genes involved in malignant transfromation |
| (DGIdb 4.0) |
| Entrez ID | Symbol | Category | Interaction Types | Drug Claim Name | Drug Name | PMIDs |
| Page: 1 |

Copyright 2023-Present -The University of Texas Health Science Center at Houston |