
|
|||||
|
 | |
| |
| |
| |
| |
| |
|
Gene: PKDCC |
Gene summary for PKDCC |
| Gene information | Species | Human | Gene symbol | PKDCC | Gene ID | 91461 |
| Gene name | protein kinase domain containing, cytoplasmic | |
| Gene Alias | RLSDF | |
| Cytomap | 2p21 | |
| Gene Type | protein-coding | GO ID | GO:0001501 | UniProtAcc | Q504Y2 |
Top |
Malignant transformation analysis |
| Identification of the aberrant gene expression in precancerous and cancerous lesions by comparing the gene expression of stem-like cells in diseased tissues with normal stem cells |
| Entrez ID | Symbol | Replicates | Species | Organ | Tissue | Adj P-value | Log2FC | Malignancy |
| 91461 | PKDCC | HTA11_1938_2000001011 | Human | Colorectum | AD | 2.61e-02 | 4.55e-01 | -0.0811 |
| 91461 | PKDCC | HTA11_347_2000001011 | Human | Colorectum | AD | 2.45e-05 | 3.96e-01 | -0.1954 |
| 91461 | PKDCC | HTA11_1391_2000001011 | Human | Colorectum | AD | 4.17e-07 | 6.31e-01 | -0.059 |
| 91461 | PKDCC | HTA11_8622_2000001021 | Human | Colorectum | SER | 6.06e-03 | 5.62e-01 | 0.0528 |
| 91461 | PKDCC | HTA11_7663_2000001011 | Human | Colorectum | SER | 1.47e-08 | 8.69e-01 | 0.0131 |
| 91461 | PKDCC | HTA11_99999970781_79442 | Human | Colorectum | MSS | 5.11e-08 | -2.92e-01 | 0.294 |
| 91461 | PKDCC | HTA11_99999971662_82457 | Human | Colorectum | MSS | 3.65e-07 | 6.38e-01 | 0.3859 |
| 91461 | PKDCC | F007 | Human | Colorectum | FAP | 1.08e-03 | -3.12e-01 | 0.1176 |
| 91461 | PKDCC | A002-C-010 | Human | Colorectum | FAP | 4.36e-08 | -3.07e-01 | 0.242 |
| 91461 | PKDCC | A001-C-207 | Human | Colorectum | FAP | 1.76e-07 | -3.50e-01 | 0.1278 |
| 91461 | PKDCC | A015-C-203 | Human | Colorectum | FAP | 6.02e-11 | -2.71e-01 | -0.1294 |
| 91461 | PKDCC | A014-C-040 | Human | Colorectum | FAP | 1.51e-02 | -3.62e-01 | -0.1184 |
| 91461 | PKDCC | A002-C-201 | Human | Colorectum | FAP | 1.61e-09 | -3.12e-01 | 0.0324 |
| 91461 | PKDCC | A002-C-203 | Human | Colorectum | FAP | 2.83e-05 | -1.86e-01 | 0.2786 |
| 91461 | PKDCC | A001-C-119 | Human | Colorectum | FAP | 9.63e-06 | -3.44e-01 | -0.1557 |
| 91461 | PKDCC | A001-C-108 | Human | Colorectum | FAP | 8.47e-13 | -3.27e-01 | -0.0272 |
| 91461 | PKDCC | A002-C-021 | Human | Colorectum | FAP | 5.08e-04 | -2.51e-01 | 0.1171 |
| 91461 | PKDCC | A002-C-205 | Human | Colorectum | FAP | 3.78e-14 | -3.62e-01 | -0.1236 |
| 91461 | PKDCC | A001-C-104 | Human | Colorectum | FAP | 3.68e-07 | -2.85e-01 | 0.0184 |
| 91461 | PKDCC | A015-C-005 | Human | Colorectum | FAP | 3.72e-05 | -2.96e-01 | -0.0336 |
| Page: 1 2 3 |
| Tissue | Expression Dynamics | Abbreviation |
| Colorectum (GSE201348) |  | FAP: Familial adenomatous polyposis |
| CRC: Colorectal cancer | ||
| Colorectum (HTA11) |  | AD: Adenomas |
| SER: Sessile serrated lesions | ||
| MSI-H: Microsatellite-high colorectal cancer | ||
| MSS: Microsatellite stable colorectal cancer | ||
| Liver |  | HCC: Hepatocellular carcinoma |
| NAFLD: Non-alcoholic fatty liver disease | ||
| Thyroid | 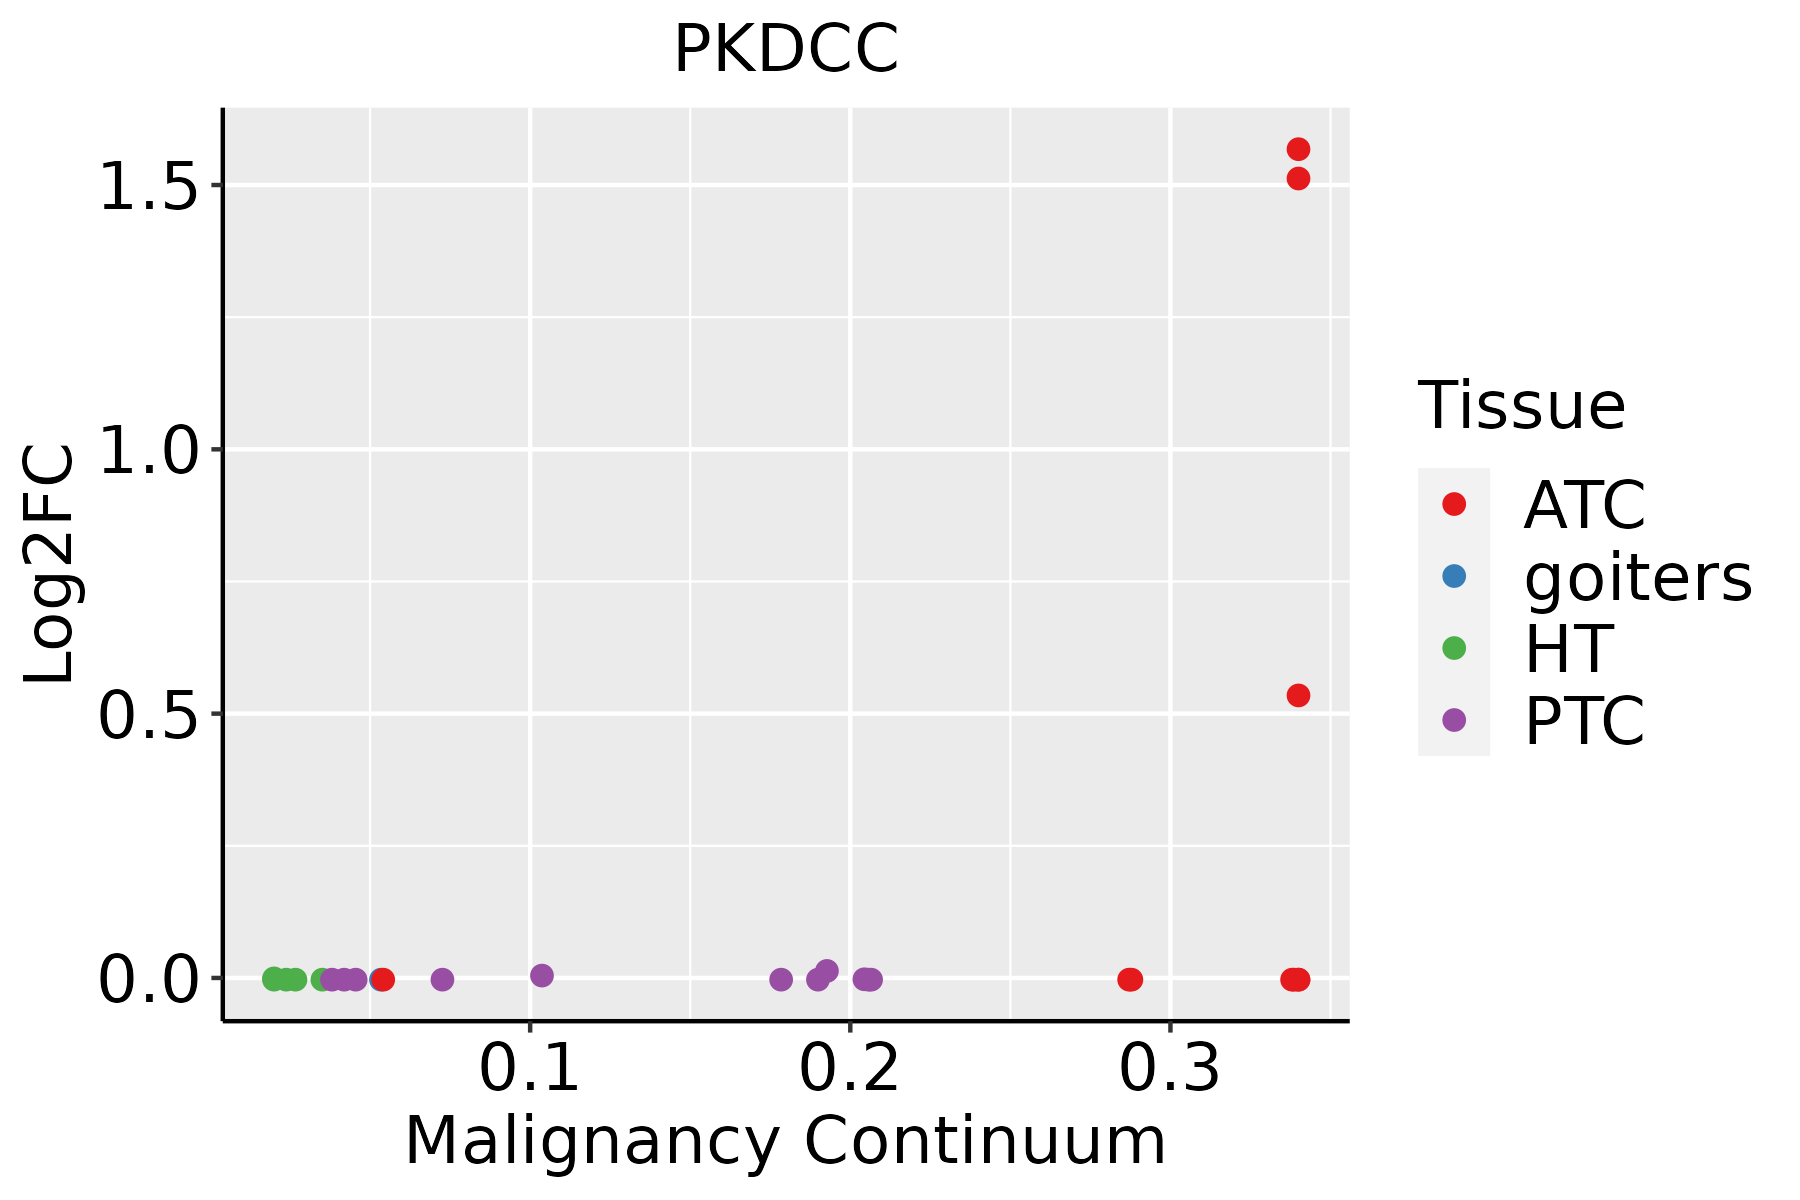 | ATC: Anaplastic thyroid cancer |
| HT: Hashimoto's thyroiditis | ||
| PTC: Papillary thyroid cancer |
| ∗log2FC in expression of this searched gene in stem-like cells from each diseased tissue sample relative to stem-like cells in normal samples in each tissue plotted against the malignancy continuum. Samples are colored based on if they are from different disease stage. |
Top |
Malignant transformation related pathway analysis |
| Find out the enriched GO biological processes and KEGG pathways involved in transition from healthy to precancer to cancer |
| Tissue | Disease Stage | Enriched GO biological Processes |
| Colorectum | AD |  |
| Colorectum | SER |  |
| Colorectum | MSS |  |
| Colorectum | MSI-H |  |
| Colorectum | FAP |  |
| ∗Top 15 enriched GO BP terms are showed in the bar plot of each disease state in each tissue. Each row represents a significant GO biological process which is colored according to the -log10(p.adjust). |
| Page: 1 2 3 4 5 6 7 8 9 |
| GO ID | Tissue | Disease Stage | Description | Gene Ratio | Bg Ratio | pvalue | p.adjust | Count |
| GO:0072659 | Colorectum | AD | protein localization to plasma membrane | 122/3918 | 284/18723 | 2.86e-17 | 1.49e-14 | 122 |
| GO:1990778 | Colorectum | AD | protein localization to cell periphery | 129/3918 | 333/18723 | 5.51e-14 | 1.15e-11 | 129 |
| GO:0090150 | Colorectum | AD | establishment of protein localization to membrane | 100/3918 | 260/18723 | 6.01e-11 | 6.33e-09 | 100 |
| GO:0048193 | Colorectum | AD | Golgi vesicle transport | 109/3918 | 296/18723 | 1.80e-10 | 1.68e-08 | 109 |
| GO:1905475 | Colorectum | AD | regulation of protein localization to membrane | 73/3918 | 175/18723 | 3.37e-10 | 2.93e-08 | 73 |
| GO:1903076 | Colorectum | AD | regulation of protein localization to plasma membrane | 48/3918 | 104/18723 | 7.17e-09 | 4.36e-07 | 48 |
| GO:1904375 | Colorectum | AD | regulation of protein localization to cell periphery | 54/3918 | 125/18723 | 1.52e-08 | 9.00e-07 | 54 |
| GO:0098876 | Colorectum | AD | vesicle-mediated transport to the plasma membrane | 57/3918 | 136/18723 | 2.30e-08 | 1.27e-06 | 57 |
| GO:0061951 | Colorectum | AD | establishment of protein localization to plasma membrane | 31/3918 | 60/18723 | 1.37e-07 | 6.42e-06 | 31 |
| GO:0006892 | Colorectum | AD | post-Golgi vesicle-mediated transport | 45/3918 | 104/18723 | 2.22e-07 | 9.26e-06 | 45 |
| GO:0043001 | Colorectum | AD | Golgi to plasma membrane protein transport | 21/3918 | 40/18723 | 1.03e-05 | 2.40e-04 | 21 |
| GO:0006893 | Colorectum | AD | Golgi to plasma membrane transport | 27/3918 | 60/18723 | 2.41e-05 | 4.66e-04 | 27 |
| GO:1903077 | Colorectum | AD | negative regulation of protein localization to plasma membrane | 13/3918 | 24/18723 | 3.45e-04 | 4.03e-03 | 13 |
| GO:1904376 | Colorectum | AD | negative regulation of protein localization to cell periphery | 13/3918 | 26/18723 | 9.41e-04 | 8.92e-03 | 13 |
| GO:1903828 | Colorectum | AD | negative regulation of cellular protein localization | 39/3918 | 117/18723 | 1.18e-03 | 1.06e-02 | 39 |
| GO:0048736 | Colorectum | AD | appendage development | 51/3918 | 172/18723 | 4.20e-03 | 2.89e-02 | 51 |
| GO:0060173 | Colorectum | AD | limb development | 51/3918 | 172/18723 | 4.20e-03 | 2.89e-02 | 51 |
| GO:0048568 | Colorectum | AD | embryonic organ development | 112/3918 | 427/18723 | 4.60e-03 | 3.14e-02 | 112 |
| GO:0001503 | Colorectum | AD | ossification | 106/3918 | 408/18723 | 7.68e-03 | 4.64e-02 | 106 |
| GO:00726591 | Colorectum | SER | protein localization to plasma membrane | 92/2897 | 284/18723 | 6.36e-13 | 1.86e-10 | 92 |
| Page: 1 2 3 4 5 6 7 8 9 |
| Pathway ID | Tissue | Disease Stage | Description | Gene Ratio | Bg Ratio | pvalue | p.adjust | qvalue | Count |
| Page: 1 |
Top |
Cell-cell communication analysis |
| Identification of potential cell-cell interactions between two cell types and their ligand-receptor pairs for different disease states |
| Ligand | Receptor | LRpair | Pathway | Tissue | Disease Stage |
| Page: 1 |
Top |
Single-cell gene regulatory network inference analysis |
| Find out the significant the regulons (TFs) and the target genes of each regulon across cell types for different disease states |
| TF | Cell Type | Tissue | Disease Stage | Target Gene | RSS | Regulon Activity |
| ∗The dot plots of a searched regulon are shown for all cell subpopulations in each disease state of each tissue based on the regulon specific score inferred using pySCENIC and by calculating the average expression. |
| Page: 1 |
Top |
Somatic mutation of malignant transformation related genes |
| Annotation of somatic variants for genes involved in malignant transformation |
| Hugo Symbol | Variant Class | Variant Classification | dbSNP RS | HGVSc | HGVSp | HGVSp Short | SWISSPROT | BIOTYPE | SIFT | PolyPhen | Tumor Sample Barcode | Tissue | Histology | Sex | Age | Stage | Therapy Types | Drugs | Outcome |
| PKDCC | SNV | Missense_Mutation | novel | c.712C>A | p.Pro238Thr | p.P238T | Q504Y2 | protein_coding | deleterious(0) | probably_damaging(0.993) | TCGA-BH-A0B4-01 | Breast | breast invasive carcinoma | Male | >=65 | III/IV | Hormone Therapy | tamoxiphen | SD |
| PKDCC | SNV | Missense_Mutation | c.787N>G | p.Leu263Val | p.L263V | Q504Y2 | protein_coding | deleterious(0) | probably_damaging(0.998) | TCGA-BH-A0BZ-01 | Breast | breast invasive carcinoma | Female | <65 | III/IV | Chemotherapy | doxorubicin | CR | |
| PKDCC | insertion | Nonsense_Mutation | novel | c.713_714insAAAAATTAGCTGGGCATAG | p.Val239LysfsTer6 | p.V239Kfs*6 | Q504Y2 | protein_coding | TCGA-BH-A0B4-01 | Breast | breast invasive carcinoma | Male | >=65 | III/IV | Hormone Therapy | tamoxiphen | SD | ||
| PKDCC | deletion | Frame_Shift_Del | novel | c.1097delG | p.Ser366ThrfsTer124 | p.S366Tfs*124 | Q504Y2 | protein_coding | TCGA-D8-A27V-01 | Breast | breast invasive carcinoma | Female | <65 | I/II | Hormone Therapy | tamoxiphen | SD | ||
| PKDCC | SNV | Missense_Mutation | rs749783255 | c.1012C>T | p.Arg338Trp | p.R338W | Q504Y2 | protein_coding | deleterious(0) | probably_damaging(0.995) | TCGA-2W-A8YY-01 | Cervix | cervical & endocervical cancer | Female | <65 | I/II | Chemotherapy | cisplatin | CR |
| PKDCC | SNV | Missense_Mutation | c.478G>A | p.Gly160Ser | p.G160S | Q504Y2 | protein_coding | tolerated(0.47) | benign(0.154) | TCGA-IR-A3LA-01 | Cervix | cervical & endocervical cancer | Female | <65 | I/II | Chemotherapy | cisplatin | CR | |
| PKDCC | SNV | Missense_Mutation | c.1270N>A | p.Cys424Ser | p.C424S | Q504Y2 | protein_coding | deleterious(0) | probably_damaging(0.994) | TCGA-AA-A022-01 | Colorectum | colon adenocarcinoma | Female | >=65 | I/II | Unknown | Unknown | SD | |
| PKDCC | SNV | Missense_Mutation | rs144832959 | c.782G>A | p.Arg261His | p.R261H | Q504Y2 | protein_coding | deleterious(0.03) | probably_damaging(0.921) | TCGA-AD-6895-01 | Colorectum | colon adenocarcinoma | Male | >=65 | III/IV | Unknown | Unknown | SD |
| PKDCC | SNV | Missense_Mutation | c.569G>T | p.Arg190Leu | p.R190L | Q504Y2 | protein_coding | deleterious(0.02) | possibly_damaging(0.478) | TCGA-AM-5821-01 | Colorectum | colon adenocarcinoma | Female | >=65 | I/II | Unknown | Unknown | SD | |
| PKDCC | SNV | Missense_Mutation | rs374316779 | c.820N>A | p.Val274Ile | p.V274I | Q504Y2 | protein_coding | tolerated(0.27) | benign(0.12) | TCGA-G4-6628-01 | Colorectum | colon adenocarcinoma | Male | >=65 | I/II | Unknown | Unknown | SD |
| Page: 1 2 3 4 |
Top |
Related drugs of malignant transformation related genes |
| Identification of chemicals and drugs interact with genes involved in malignant transfromation |
| (DGIdb 4.0) |
| Entrez ID | Symbol | Category | Interaction Types | Drug Claim Name | Drug Name | PMIDs |
| Page: 1 |

Copyright 2023-Present -The University of Texas Health Science Center at Houston |