
|
|||||
|
 | |
| |
| |
| |
| |
| |
|
Gene: PKD1 |
Gene summary for PKD1 |
| Gene information | Species | Human | Gene symbol | PKD1 | Gene ID | 5310 |
| Gene name | polycystin 1, transient receptor potential channel interacting | |
| Gene Alias | PBP | |
| Cytomap | 16p13.3 | |
| Gene Type | protein-coding | GO ID | GO:0000003 | UniProtAcc | P98161 |
Top |
Malignant transformation analysis |
| Identification of the aberrant gene expression in precancerous and cancerous lesions by comparing the gene expression of stem-like cells in diseased tissues with normal stem cells |
| Entrez ID | Symbol | Replicates | Species | Organ | Tissue | Adj P-value | Log2FC | Malignancy |
| 5310 | PKD1 | LZE7T | Human | Esophagus | ESCC | 3.78e-07 | 2.38e-01 | 0.0667 |
| 5310 | PKD1 | LZE20T | Human | Esophagus | ESCC | 1.04e-03 | 9.00e-02 | 0.0662 |
| 5310 | PKD1 | LZE22T | Human | Esophagus | ESCC | 3.47e-02 | 2.17e-01 | 0.068 |
| 5310 | PKD1 | LZE24T | Human | Esophagus | ESCC | 5.84e-08 | 9.35e-02 | 0.0596 |
| 5310 | PKD1 | P1T-E | Human | Esophagus | ESCC | 1.75e-14 | 5.51e-01 | 0.0875 |
| 5310 | PKD1 | P2T-E | Human | Esophagus | ESCC | 2.56e-13 | 2.29e-01 | 0.1177 |
| 5310 | PKD1 | P4T-E | Human | Esophagus | ESCC | 4.21e-06 | 1.27e-01 | 0.1323 |
| 5310 | PKD1 | P5T-E | Human | Esophagus | ESCC | 1.51e-04 | 5.69e-02 | 0.1327 |
| 5310 | PKD1 | P8T-E | Human | Esophagus | ESCC | 1.42e-16 | 2.54e-01 | 0.0889 |
| 5310 | PKD1 | P9T-E | Human | Esophagus | ESCC | 1.02e-04 | 8.58e-02 | 0.1131 |
| 5310 | PKD1 | P10T-E | Human | Esophagus | ESCC | 2.75e-07 | 1.72e-01 | 0.116 |
| 5310 | PKD1 | P11T-E | Human | Esophagus | ESCC | 5.69e-08 | 1.88e-01 | 0.1426 |
| 5310 | PKD1 | P12T-E | Human | Esophagus | ESCC | 2.34e-10 | 1.98e-01 | 0.1122 |
| 5310 | PKD1 | P15T-E | Human | Esophagus | ESCC | 4.01e-16 | 2.88e-01 | 0.1149 |
| 5310 | PKD1 | P16T-E | Human | Esophagus | ESCC | 3.51e-02 | 3.56e-02 | 0.1153 |
| 5310 | PKD1 | P17T-E | Human | Esophagus | ESCC | 1.19e-02 | 7.76e-02 | 0.1278 |
| 5310 | PKD1 | P20T-E | Human | Esophagus | ESCC | 6.39e-10 | 1.21e-01 | 0.1124 |
| 5310 | PKD1 | P21T-E | Human | Esophagus | ESCC | 4.77e-05 | 1.46e-01 | 0.1617 |
| 5310 | PKD1 | P22T-E | Human | Esophagus | ESCC | 2.91e-04 | 9.38e-02 | 0.1236 |
| 5310 | PKD1 | P23T-E | Human | Esophagus | ESCC | 2.93e-03 | 8.55e-02 | 0.108 |
| Page: 1 2 3 4 |
| Tissue | Expression Dynamics | Abbreviation |
| Esophagus |  | ESCC: Esophageal squamous cell carcinoma |
| HGIN: High-grade intraepithelial neoplasias | ||
| LGIN: Low-grade intraepithelial neoplasias | ||
| Liver | 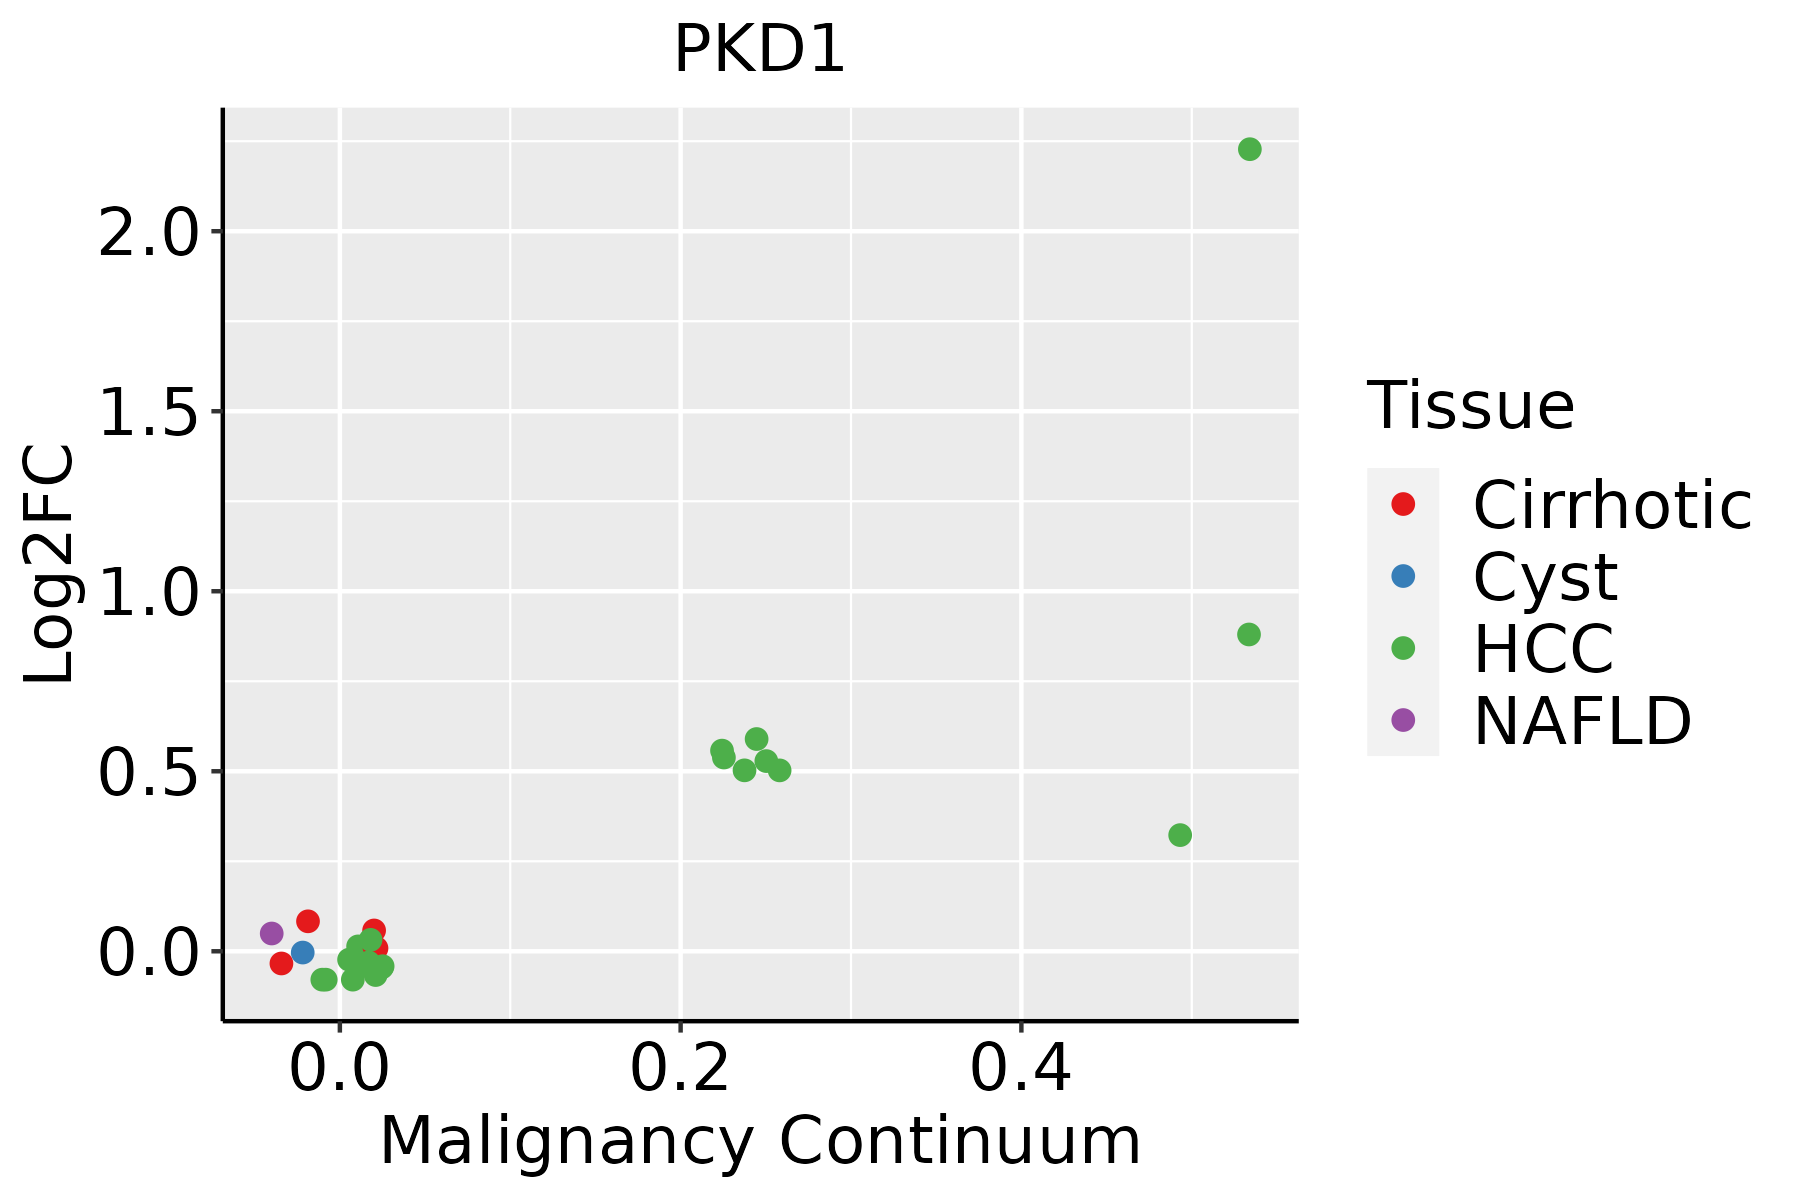 | HCC: Hepatocellular carcinoma |
| NAFLD: Non-alcoholic fatty liver disease | ||
| Thyroid | 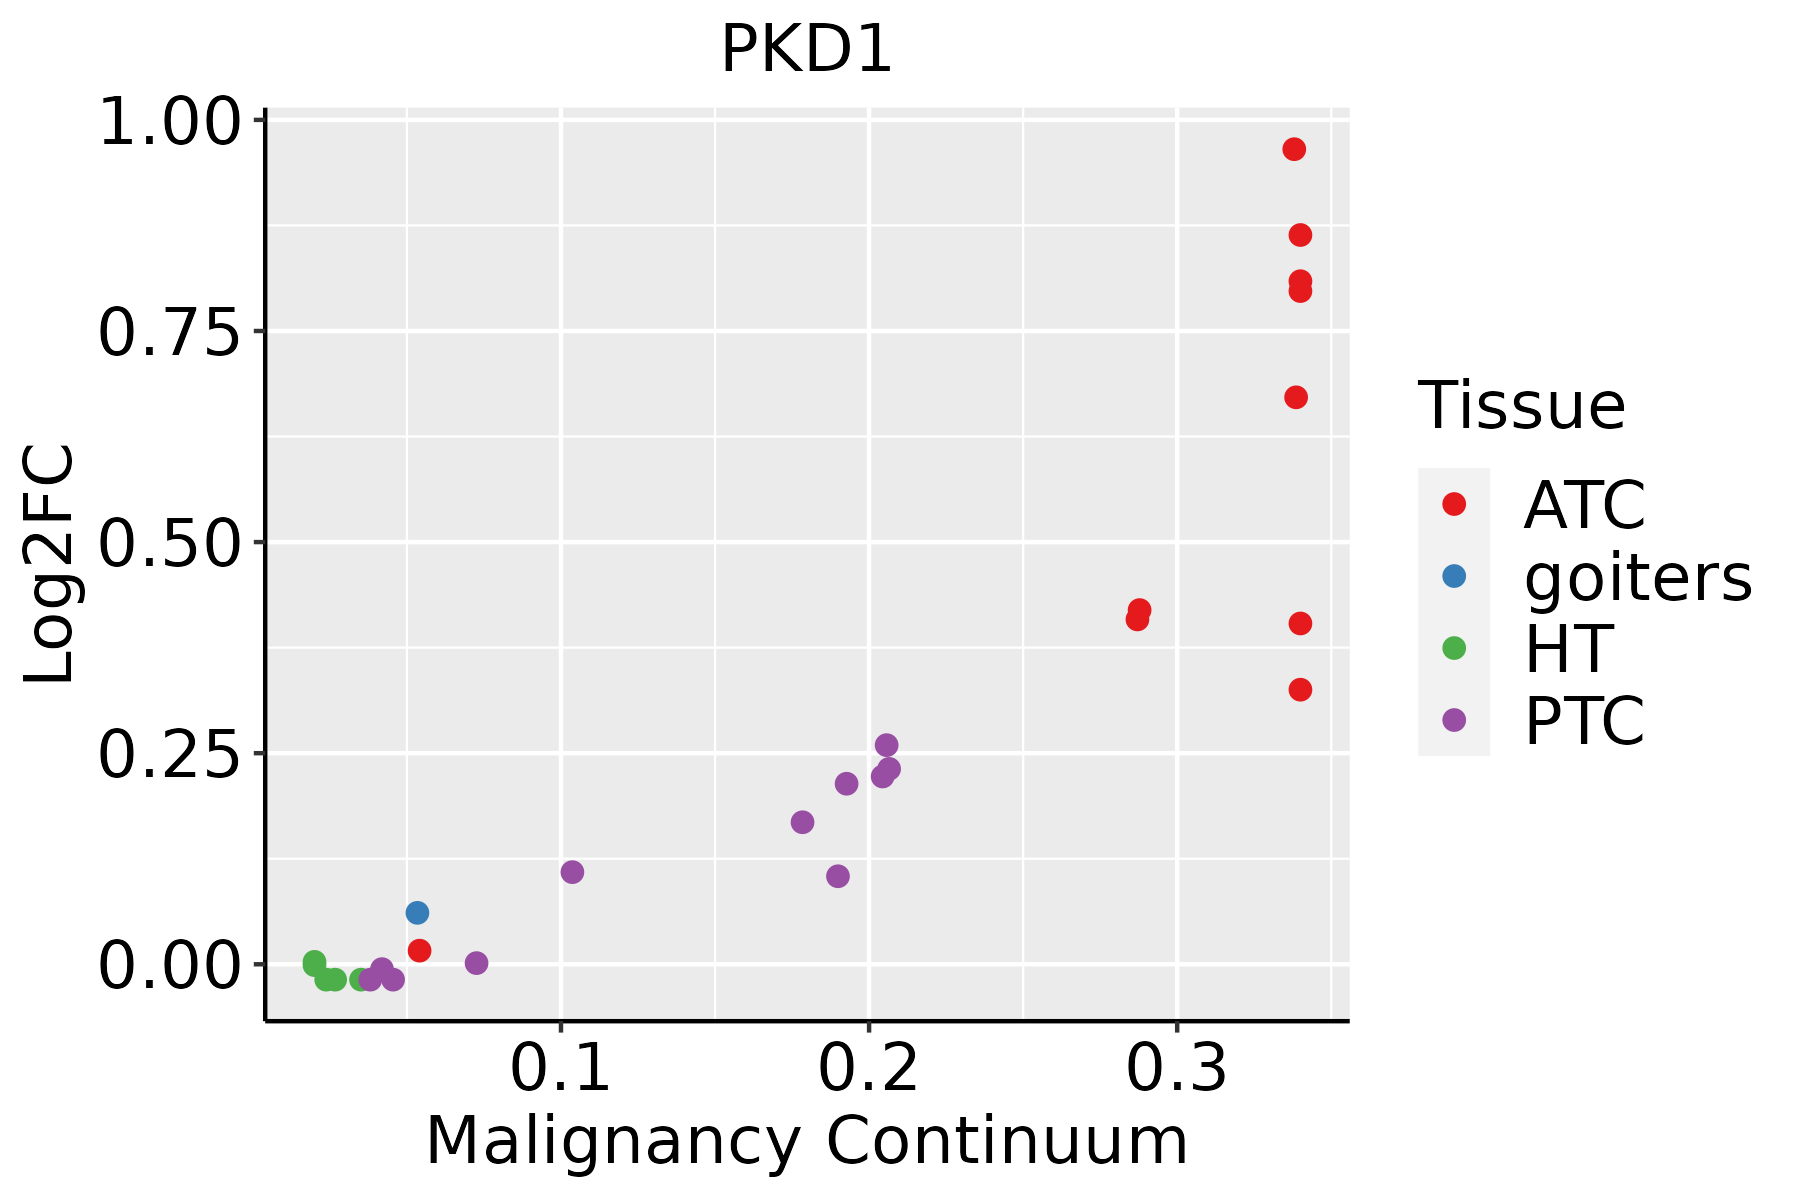 | ATC: Anaplastic thyroid cancer |
| HT: Hashimoto's thyroiditis | ||
| PTC: Papillary thyroid cancer |
| ∗log2FC in expression of this searched gene in stem-like cells from each diseased tissue sample relative to stem-like cells in normal samples in each tissue plotted against the malignancy continuum. Samples are colored based on if they are from different disease stage. |
Top |
Malignant transformation related pathway analysis |
| Find out the enriched GO biological processes and KEGG pathways involved in transition from healthy to precancer to cancer |
| Tissue | Disease Stage | Enriched GO biological Processes |
| Colorectum | AD |  |
| Colorectum | SER |  |
| Colorectum | MSS |  |
| Colorectum | MSI-H |  |
| Colorectum | FAP |  |
| ∗Top 15 enriched GO BP terms are showed in the bar plot of each disease state in each tissue. Each row represents a significant GO biological process which is colored according to the -log10(p.adjust). |
| Page: 1 2 3 4 5 6 7 8 9 |
| GO ID | Tissue | Disease Stage | Description | Gene Ratio | Bg Ratio | pvalue | p.adjust | Count |
| GO:0010498111 | Esophagus | ESCC | proteasomal protein catabolic process | 369/8552 | 490/18723 | 1.13e-41 | 1.80e-38 | 369 |
| GO:0006913110 | Esophagus | ESCC | nucleocytoplasmic transport | 230/8552 | 301/18723 | 6.04e-28 | 2.02e-25 | 230 |
| GO:0051169110 | Esophagus | ESCC | nuclear transport | 230/8552 | 301/18723 | 6.04e-28 | 2.02e-25 | 230 |
| GO:0042176111 | Esophagus | ESCC | regulation of protein catabolic process | 280/8552 | 391/18723 | 8.65e-26 | 2.39e-23 | 280 |
| GO:0051168110 | Esophagus | ESCC | nuclear export | 126/8552 | 154/18723 | 1.88e-20 | 2.65e-18 | 126 |
| GO:1903362111 | Esophagus | ESCC | regulation of cellular protein catabolic process | 188/8552 | 255/18723 | 5.12e-20 | 6.62e-18 | 188 |
| GO:0051098111 | Esophagus | ESCC | regulation of binding | 251/8552 | 363/18723 | 6.73e-20 | 8.46e-18 | 251 |
| GO:004477216 | Esophagus | ESCC | mitotic cell cycle phase transition | 281/8552 | 424/18723 | 4.63e-18 | 4.45e-16 | 281 |
| GO:1903050111 | Esophagus | ESCC | regulation of proteolysis involved in cellular protein catabolic process | 163/8552 | 221/18723 | 1.44e-17 | 1.27e-15 | 163 |
| GO:0061136111 | Esophagus | ESCC | regulation of proteasomal protein catabolic process | 142/8552 | 187/18723 | 2.40e-17 | 2.00e-15 | 142 |
| GO:190285015 | Esophagus | ESCC | microtubule cytoskeleton organization involved in mitosis | 116/8552 | 147/18723 | 1.25e-16 | 9.91e-15 | 116 |
| GO:000734615 | Esophagus | ESCC | regulation of mitotic cell cycle | 293/8552 | 457/18723 | 8.00e-16 | 5.64e-14 | 293 |
| GO:000170119 | Esophagus | ESCC | in utero embryonic development | 243/8552 | 367/18723 | 1.00e-15 | 6.86e-14 | 243 |
| GO:000705214 | Esophagus | ESCC | mitotic spindle organization | 97/8552 | 120/18723 | 2.17e-15 | 1.33e-13 | 97 |
| GO:000705114 | Esophagus | ESCC | spindle organization | 134/8552 | 184/18723 | 5.70e-14 | 2.87e-12 | 134 |
| GO:0048732111 | Esophagus | ESCC | gland development | 269/8552 | 436/18723 | 7.81e-12 | 2.95e-10 | 269 |
| GO:007190016 | Esophagus | ESCC | regulation of protein serine/threonine kinase activity | 227/8552 | 359/18723 | 1.12e-11 | 4.10e-10 | 227 |
| GO:0051099111 | Esophagus | ESCC | positive regulation of binding | 122/8552 | 173/18723 | 2.79e-11 | 9.45e-10 | 122 |
| GO:004339320 | Esophagus | ESCC | regulation of protein binding | 135/8552 | 196/18723 | 3.69e-11 | 1.22e-09 | 135 |
| GO:190198713 | Esophagus | ESCC | regulation of cell cycle phase transition | 242/8552 | 390/18723 | 3.86e-11 | 1.26e-09 | 242 |
| Page: 1 2 3 4 5 6 7 8 9 10 11 12 13 14 15 16 |
| Pathway ID | Tissue | Disease Stage | Description | Gene Ratio | Bg Ratio | pvalue | p.adjust | qvalue | Count |
| Page: 1 |
Top |
Cell-cell communication analysis |
| Identification of potential cell-cell interactions between two cell types and their ligand-receptor pairs for different disease states |
| Ligand | Receptor | LRpair | Pathway | Tissue | Disease Stage |
| Page: 1 |
Top |
Single-cell gene regulatory network inference analysis |
| Find out the significant the regulons (TFs) and the target genes of each regulon across cell types for different disease states |
| TF | Cell Type | Tissue | Disease Stage | Target Gene | RSS | Regulon Activity |
| ∗The dot plots of a searched regulon are shown for all cell subpopulations in each disease state of each tissue based on the regulon specific score inferred using pySCENIC and by calculating the average expression. |
| Page: 1 |
Top |
Somatic mutation of malignant transformation related genes |
| Annotation of somatic variants for genes involved in malignant transformation |
| Hugo Symbol | Variant Class | Variant Classification | dbSNP RS | HGVSc | HGVSp | HGVSp Short | SWISSPROT | BIOTYPE | SIFT | PolyPhen | Tumor Sample Barcode | Tissue | Histology | Sex | Age | Stage | Therapy Types | Drugs | Outcome |
| PKD1 | SNV | Missense_Mutation | novel | c.2650G>T | p.Gly884Cys | p.G884C | P98161 | protein_coding | tolerated(0.07) | possibly_damaging(0.734) | TCGA-A7-A0DB-01 | Breast | breast invasive carcinoma | Female | <65 | I/II | Hormone Therapy | arimidex | SD |
| PKD1 | SNV | Missense_Mutation | rs779460999 | c.10435N>A | p.Glu3479Lys | p.E3479K | P98161 | protein_coding | deleterious(0.03) | benign(0.163) | TCGA-AC-A3W6-01 | Breast | breast invasive carcinoma | Female | >=65 | III/IV | Unknown | Unknown | SD |
| PKD1 | SNV | Missense_Mutation | novel | c.1807G>T | p.Ala603Ser | p.A603S | P98161 | protein_coding | deleterious(0.01) | benign(0.101) | TCGA-AC-A5EH-01 | Breast | breast invasive carcinoma | Female | >=65 | I/II | Unknown | Unknown | SD |
| PKD1 | SNV | Missense_Mutation | novel | c.12453N>G | p.His4151Gln | p.H4151Q | P98161 | protein_coding | deleterious(0) | probably_damaging(0.999) | TCGA-AC-A5XS-01 | Breast | breast invasive carcinoma | Female | >=65 | I/II | Hormone Therapy | femara | SD |
| PKD1 | SNV | Missense_Mutation | novel | c.5205N>G | p.Ser1735Arg | p.S1735R | P98161 | protein_coding | tolerated(0.08) | benign(0.328) | TCGA-AN-A0XN-01 | Breast | breast invasive carcinoma | Female | >=65 | III/IV | Unknown | Unknown | SD |
| PKD1 | SNV | Missense_Mutation | c.9679G>A | p.Gly3227Arg | p.G3227R | P98161 | protein_coding | tolerated(0.15) | probably_damaging(0.996) | TCGA-B6-A1KN-01 | Breast | breast invasive carcinoma | Female | <65 | III/IV | Unknown | Unknown | SD | |
| PKD1 | SNV | Missense_Mutation | novel | c.6829N>C | p.Asp2277His | p.D2277H | P98161 | protein_coding | deleterious(0) | probably_damaging(0.997) | TCGA-C8-A12K-01 | Breast | breast invasive carcinoma | Female | >=65 | I/II | Unknown | Unknown | SD |
| PKD1 | SNV | Missense_Mutation | rs200120839 | c.11347G>A | p.Val3783Ile | p.V3783I | P98161 | protein_coding | tolerated(0.39) | benign(0.051) | TCGA-C8-A3M8-01 | Breast | breast invasive carcinoma | Female | >=65 | I/II | Hormone Therapy | tamoxiphen | CR |
| PKD1 | SNV | Missense_Mutation | rs772917917 | c.10775N>T | p.Ser3592Ile | p.S3592I | P98161 | protein_coding | deleterious(0.03) | possibly_damaging(0.759) | TCGA-D8-A1JI-01 | Breast | breast invasive carcinoma | Female | <65 | I/II | Chemotherapy | doxorubicine | SD |
| PKD1 | SNV | Missense_Mutation | rs376572189 | c.4858G>A | p.Ala1620Thr | p.A1620T | P98161 | protein_coding | tolerated(0.33) | benign(0.136) | TCGA-D8-A1XQ-01 | Breast | breast invasive carcinoma | Female | >=65 | I/II | Unknown | Unknown | SD |
| Page: 1 2 3 4 5 6 7 8 9 10 11 12 13 14 15 16 17 18 19 20 21 22 23 24 25 26 27 28 29 30 31 |
Top |
Related drugs of malignant transformation related genes |
| Identification of chemicals and drugs interact with genes involved in malignant transfromation |
| (DGIdb 4.0) |
| Entrez ID | Symbol | Category | Interaction Types | Drug Claim Name | Drug Name | PMIDs |
| Page: 1 |

Copyright 2023-Present -The University of Texas Health Science Center at Houston |