
|
|||||
|
 | |
| |
| |
| |
| |
| |
|
Gene: PITX1 |
Gene summary for PITX1 |
| Gene information | Species | Human | Gene symbol | PITX1 | Gene ID | 5307 |
| Gene name | paired like homeodomain 1 | |
| Gene Alias | BFT | |
| Cytomap | 5q31.1 | |
| Gene Type | protein-coding | GO ID | GO:0001501 | UniProtAcc | P78337 |
Top |
Malignant transformation analysis |
| Identification of the aberrant gene expression in precancerous and cancerous lesions by comparing the gene expression of stem-like cells in diseased tissues with normal stem cells |
| Entrez ID | Symbol | Replicates | Species | Organ | Tissue | Adj P-value | Log2FC | Malignancy |
| 5307 | PITX1 | GSM4909282 | Human | Breast | IDC | 1.38e-50 | 7.87e-01 | -0.0288 |
| 5307 | PITX1 | GSM4909285 | Human | Breast | IDC | 2.64e-04 | 1.39e-01 | 0.21 |
| 5307 | PITX1 | GSM4909286 | Human | Breast | IDC | 2.24e-32 | 4.87e-01 | 0.1081 |
| 5307 | PITX1 | GSM4909290 | Human | Breast | IDC | 1.32e-13 | 3.31e-01 | 0.2096 |
| 5307 | PITX1 | GSM4909291 | Human | Breast | IDC | 1.82e-20 | 5.75e-01 | 0.1753 |
| 5307 | PITX1 | GSM4909294 | Human | Breast | IDC | 2.86e-09 | 2.87e-01 | 0.2022 |
| 5307 | PITX1 | GSM4909295 | Human | Breast | IDC | 3.35e-05 | 2.21e-01 | 0.0898 |
| 5307 | PITX1 | GSM4909296 | Human | Breast | IDC | 3.12e-02 | 1.66e-01 | 0.1524 |
| 5307 | PITX1 | GSM4909298 | Human | Breast | IDC | 4.40e-87 | 1.12e+00 | 0.1551 |
| 5307 | PITX1 | GSM4909304 | Human | Breast | IDC | 1.38e-20 | 4.08e-01 | 0.1636 |
| 5307 | PITX1 | GSM4909315 | Human | Breast | IDC | 2.59e-10 | 2.82e-01 | 0.21 |
| 5307 | PITX1 | GSM4909317 | Human | Breast | IDC | 5.13e-08 | 2.30e-01 | 0.1355 |
| 5307 | PITX1 | GSM4909321 | Human | Breast | IDC | 4.35e-06 | 3.10e-01 | 0.1559 |
| 5307 | PITX1 | M1 | Human | Breast | IDC | 1.29e-40 | 8.14e-01 | 0.1577 |
| 5307 | PITX1 | NCCBC14 | Human | Breast | DCIS | 1.25e-09 | 4.27e-01 | 0.2021 |
| 5307 | PITX1 | P1 | Human | Breast | IDC | 5.80e-05 | 3.46e-01 | 0.1527 |
| 5307 | PITX1 | P2 | Human | Breast | IDC | 2.50e-06 | 2.96e-01 | 0.21 |
| 5307 | PITX1 | CA_HPV_1 | Human | Cervix | CC | 2.96e-08 | -3.42e-01 | 0.0264 |
| 5307 | PITX1 | CA_HPV_3 | Human | Cervix | CC | 8.52e-29 | 7.32e-01 | 0.0414 |
| 5307 | PITX1 | HSIL_HPV_1 | Human | Cervix | HSIL_HPV | 2.36e-02 | -2.95e-01 | 0.0116 |
| Page: 1 2 3 4 5 6 7 8 |
| Tissue | Expression Dynamics | Abbreviation |
| Breast |  | IDC: Invasive ductal carcinoma |
| DCIS: Ductal carcinoma in situ | ||
| Precancer(BRCA1-mut): Precancerous lesion from BRCA1 mutation carriers | ||
| Cervix | 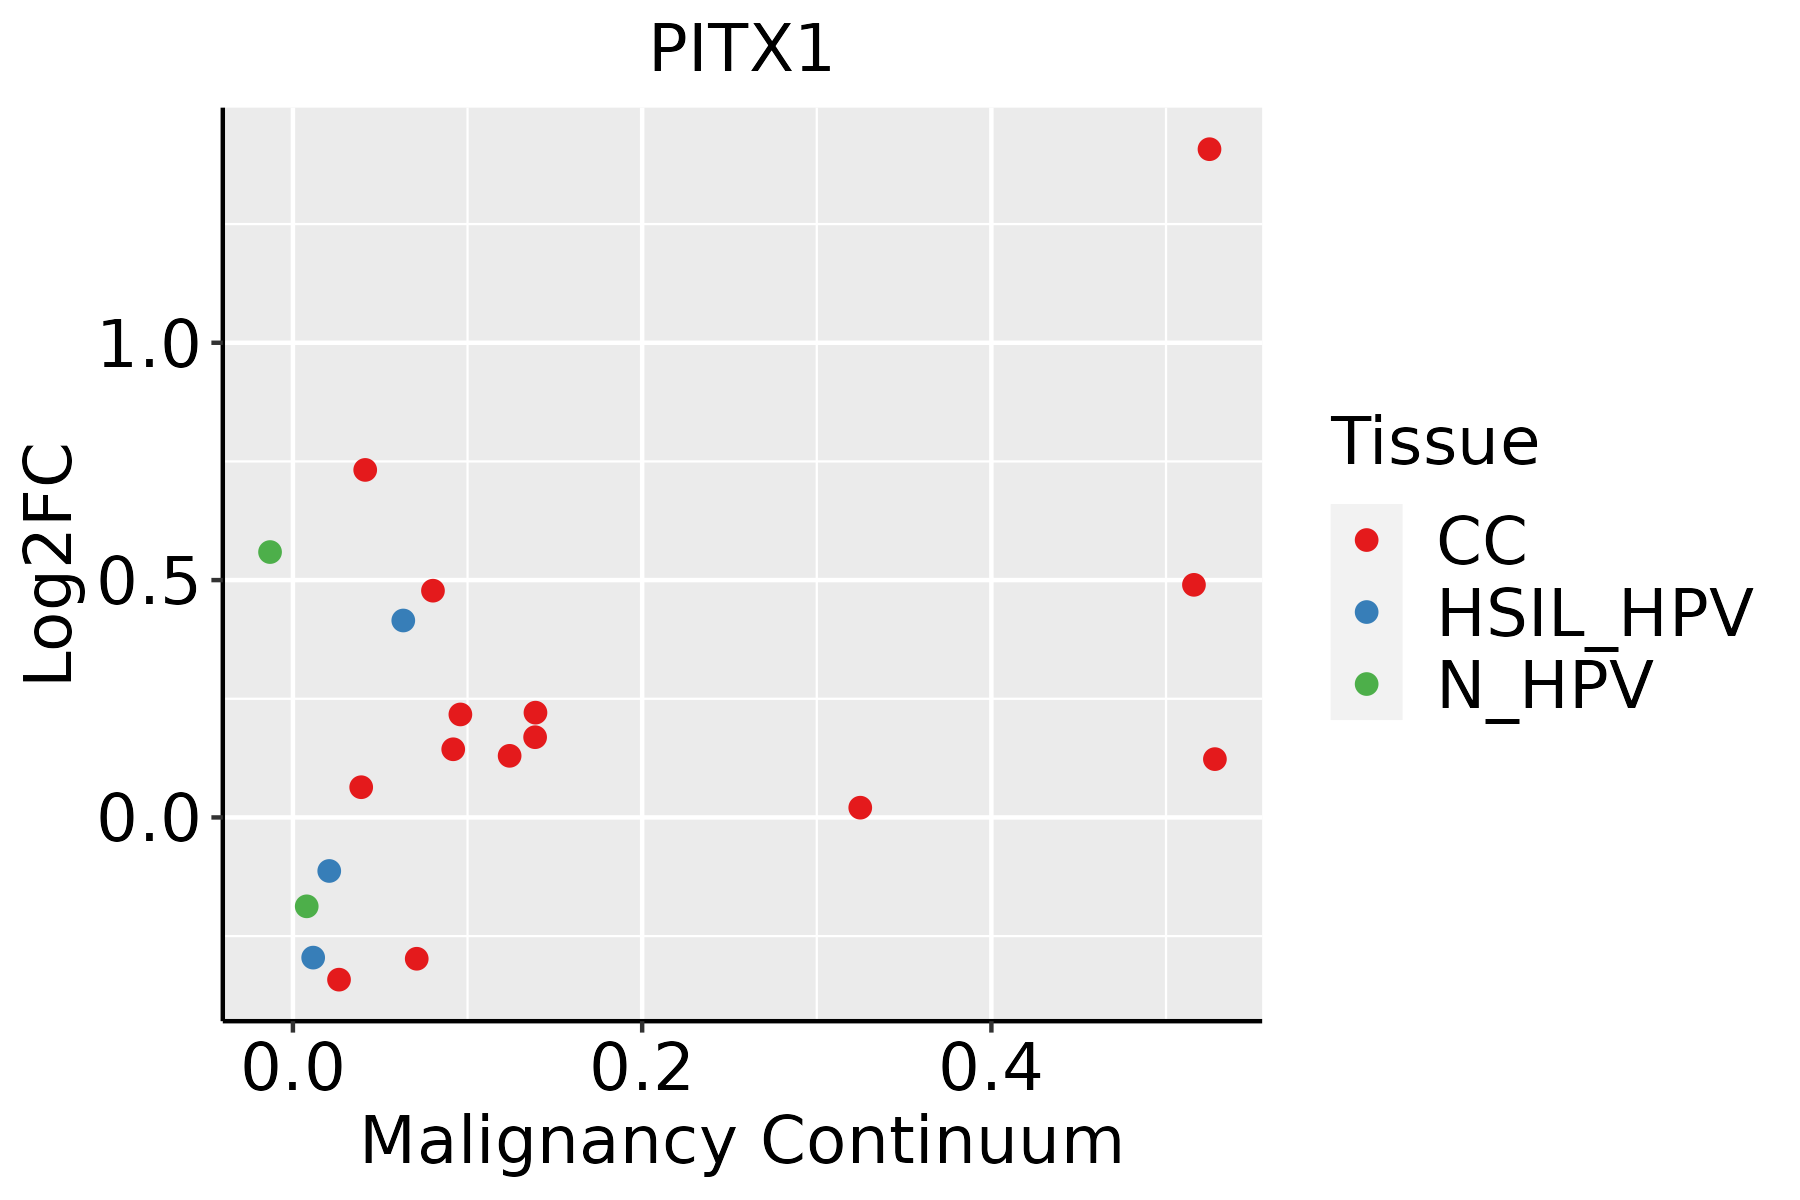 | CC: Cervix cancer |
| HSIL_HPV: HPV-infected high-grade squamous intraepithelial lesions | ||
| N_HPV: HPV-infected normal cervix | ||
| Colorectum (GSE201348) |  | FAP: Familial adenomatous polyposis |
| CRC: Colorectal cancer | ||
| Colorectum (HTA11) |  | AD: Adenomas |
| SER: Sessile serrated lesions | ||
| MSI-H: Microsatellite-high colorectal cancer | ||
| MSS: Microsatellite stable colorectal cancer | ||
| Esophagus | 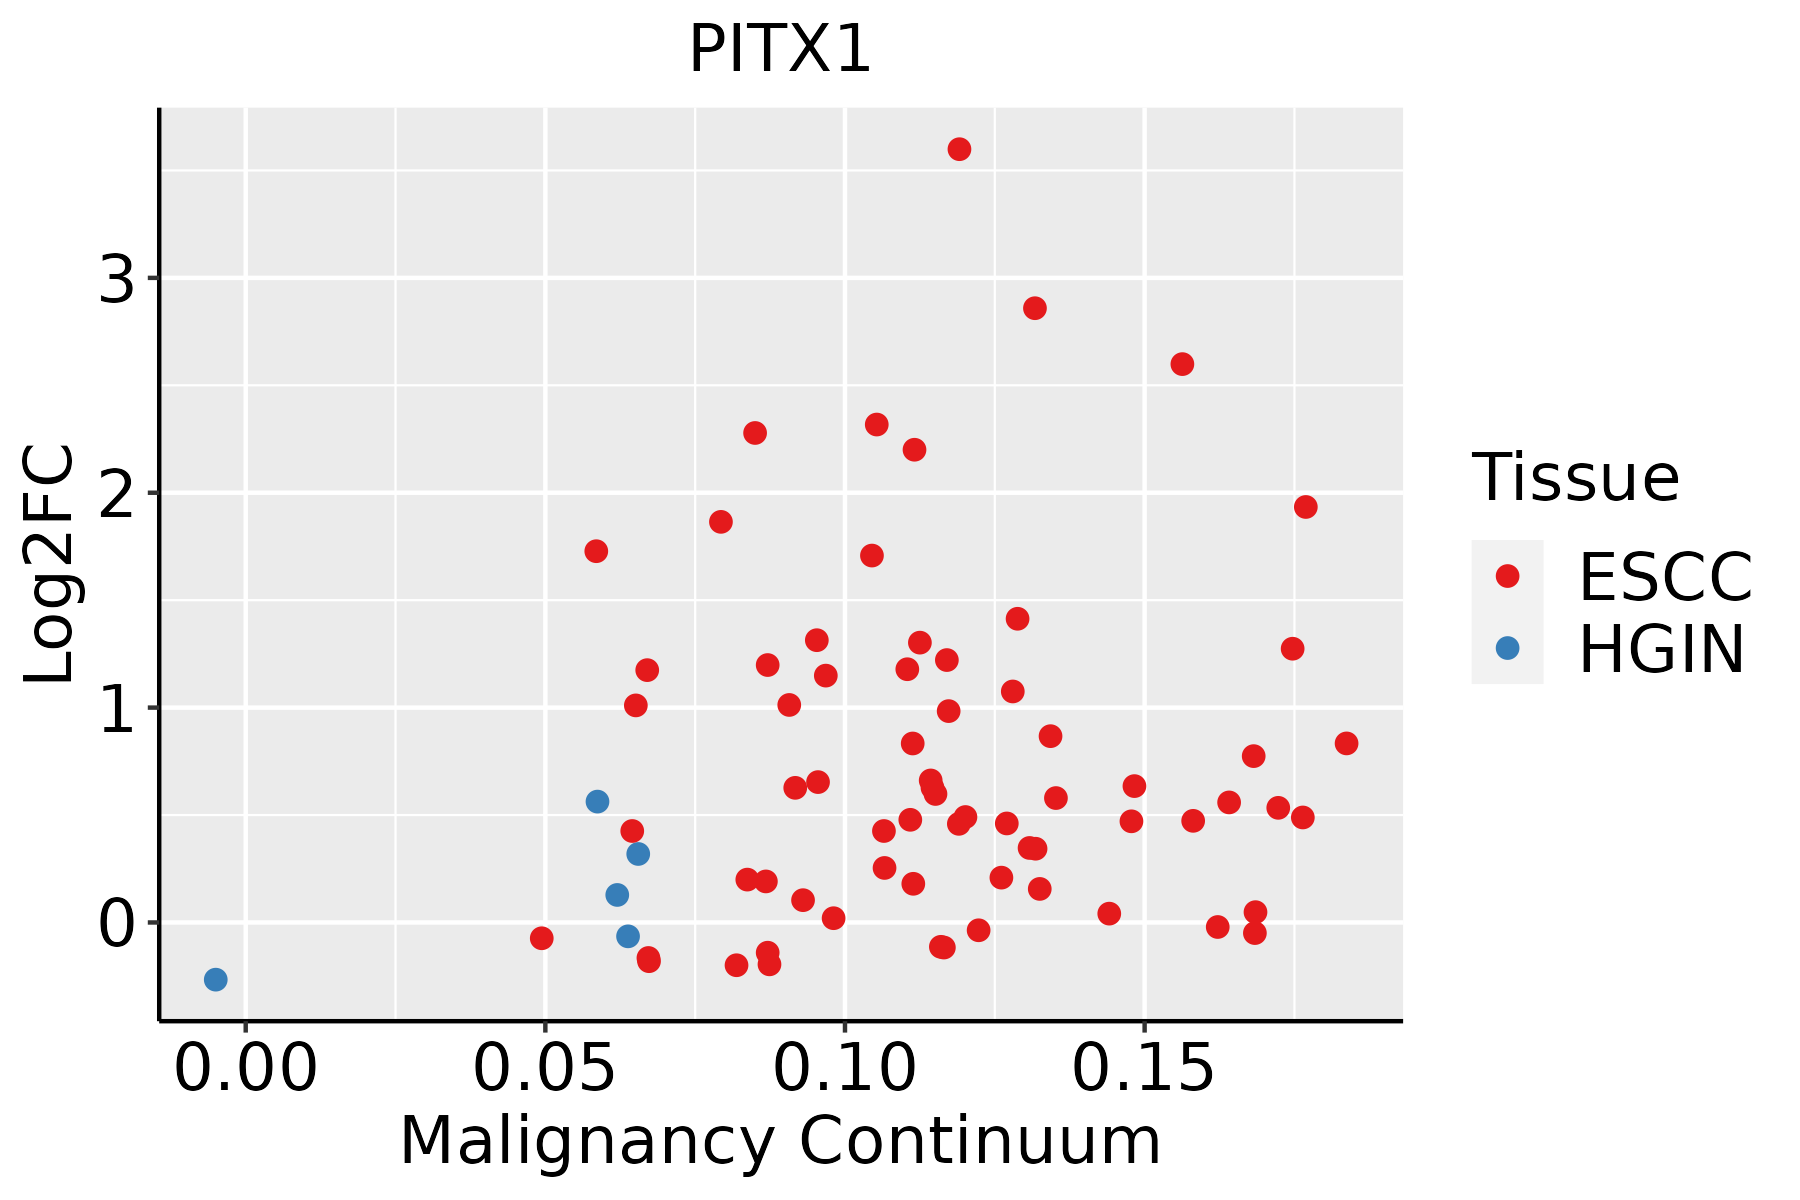 | ESCC: Esophageal squamous cell carcinoma |
| HGIN: High-grade intraepithelial neoplasias | ||
| LGIN: Low-grade intraepithelial neoplasias | ||
| Liver | 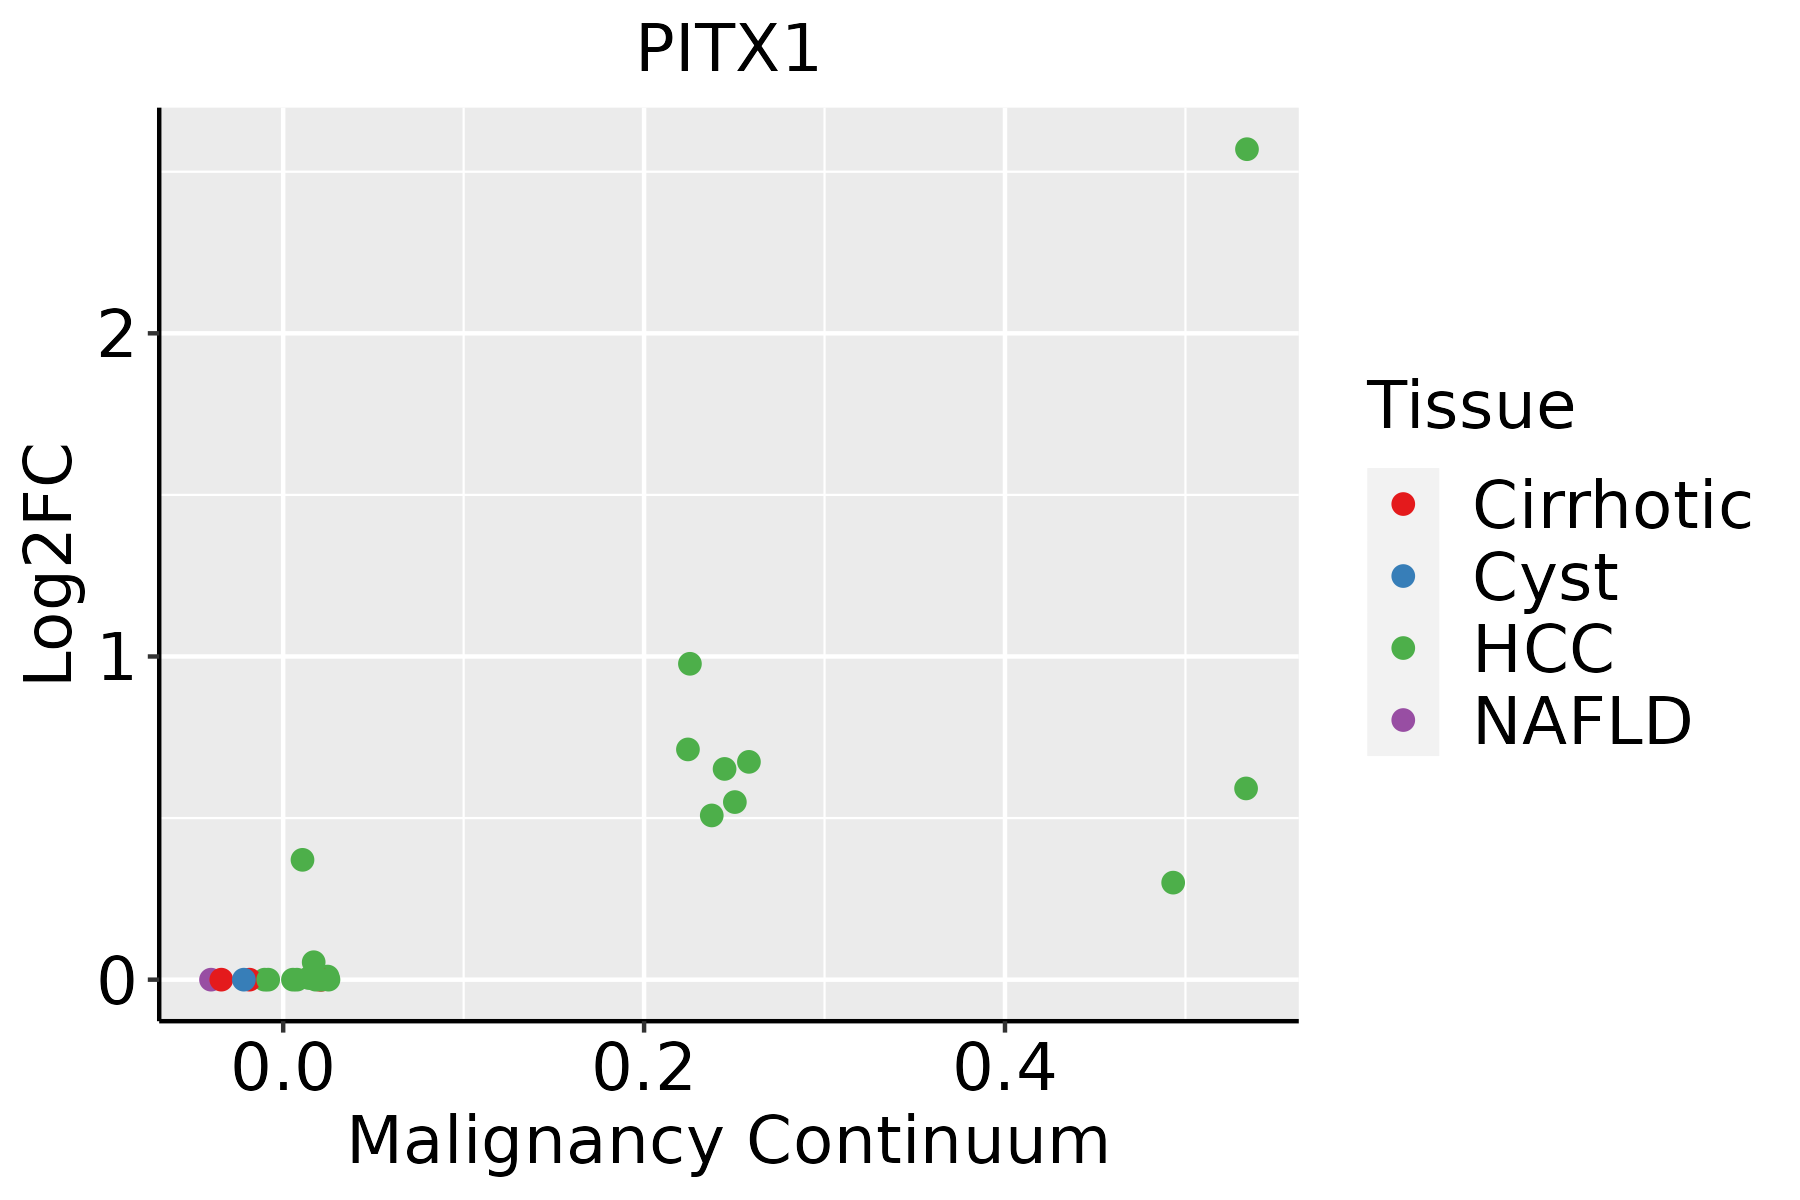 | HCC: Hepatocellular carcinoma |
| NAFLD: Non-alcoholic fatty liver disease | ||
| Oral Cavity | 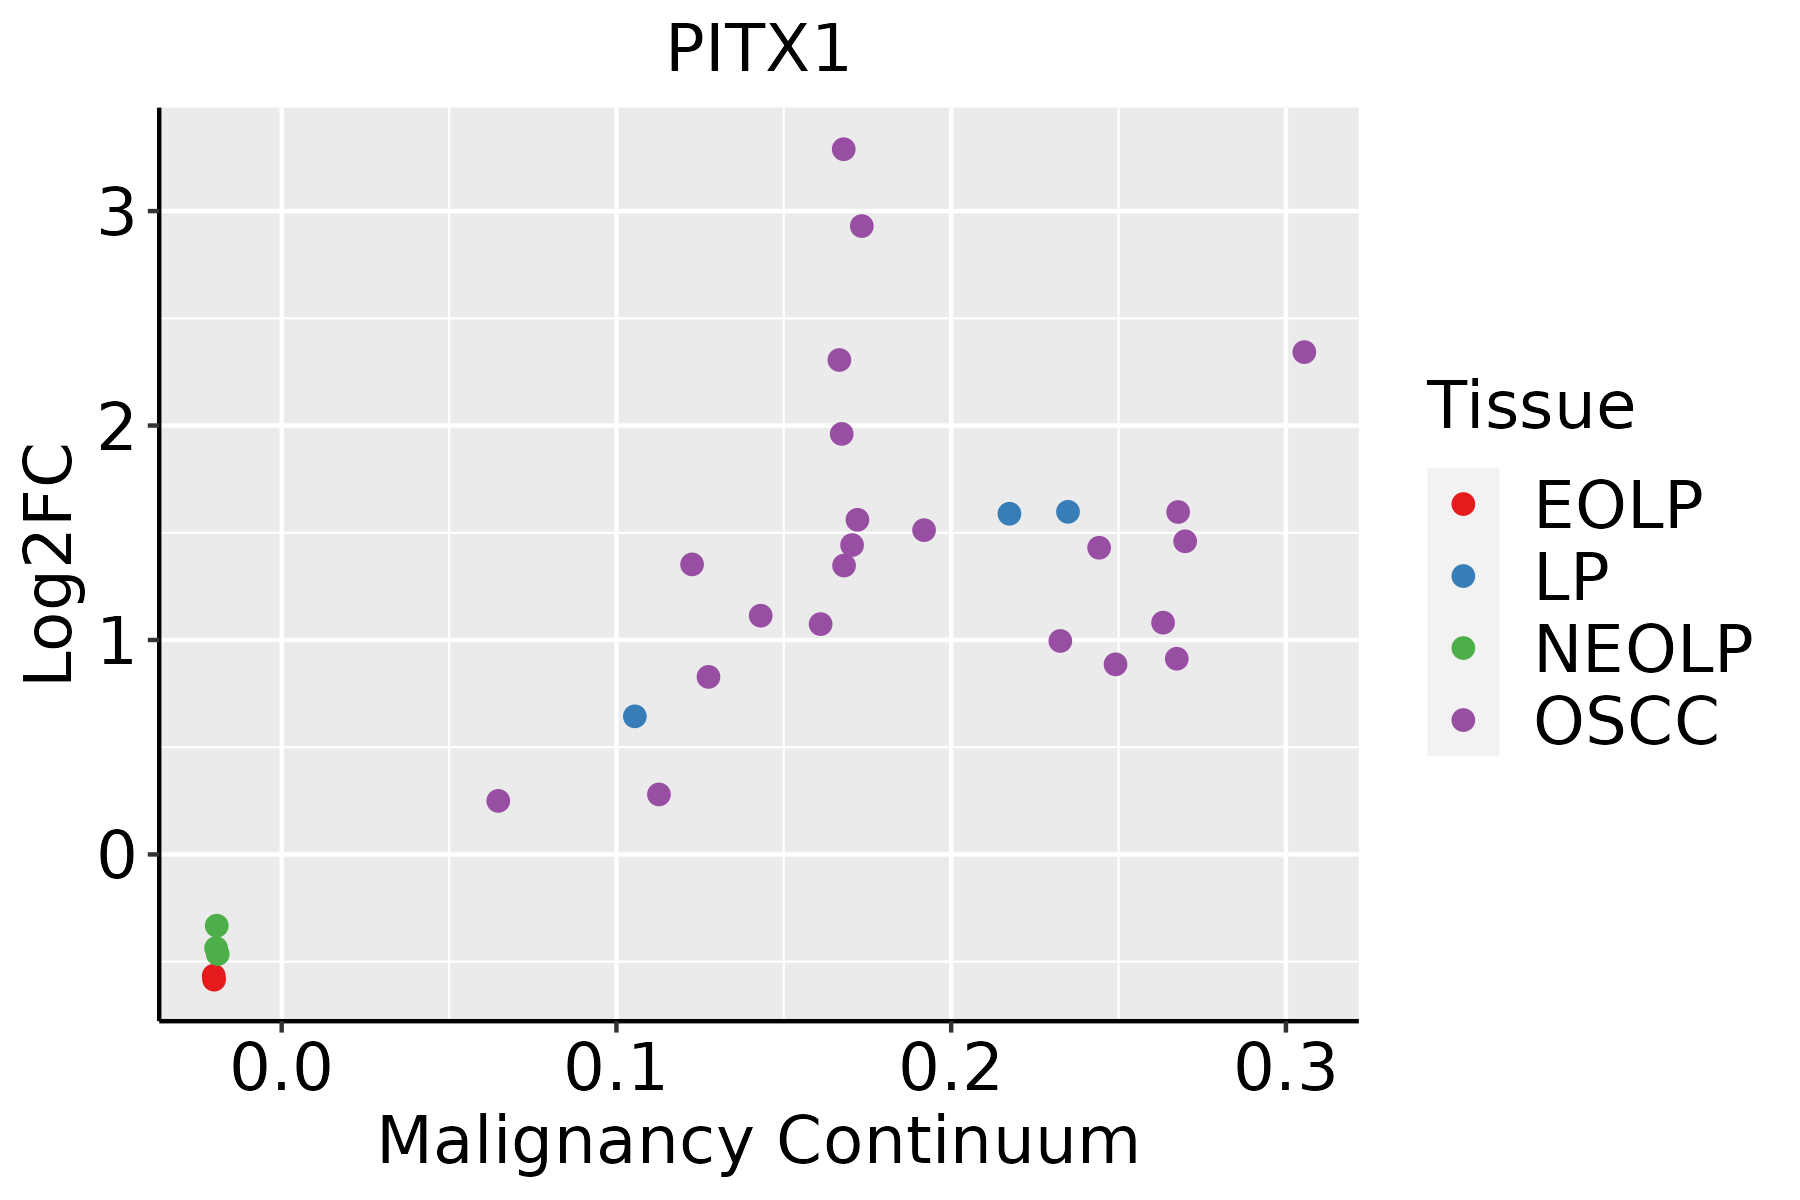 | EOLP: Erosive Oral lichen planus |
| LP: leukoplakia | ||
| NEOLP: Non-erosive oral lichen planus | ||
| OSCC: Oral squamous cell carcinoma | ||
| Skin | 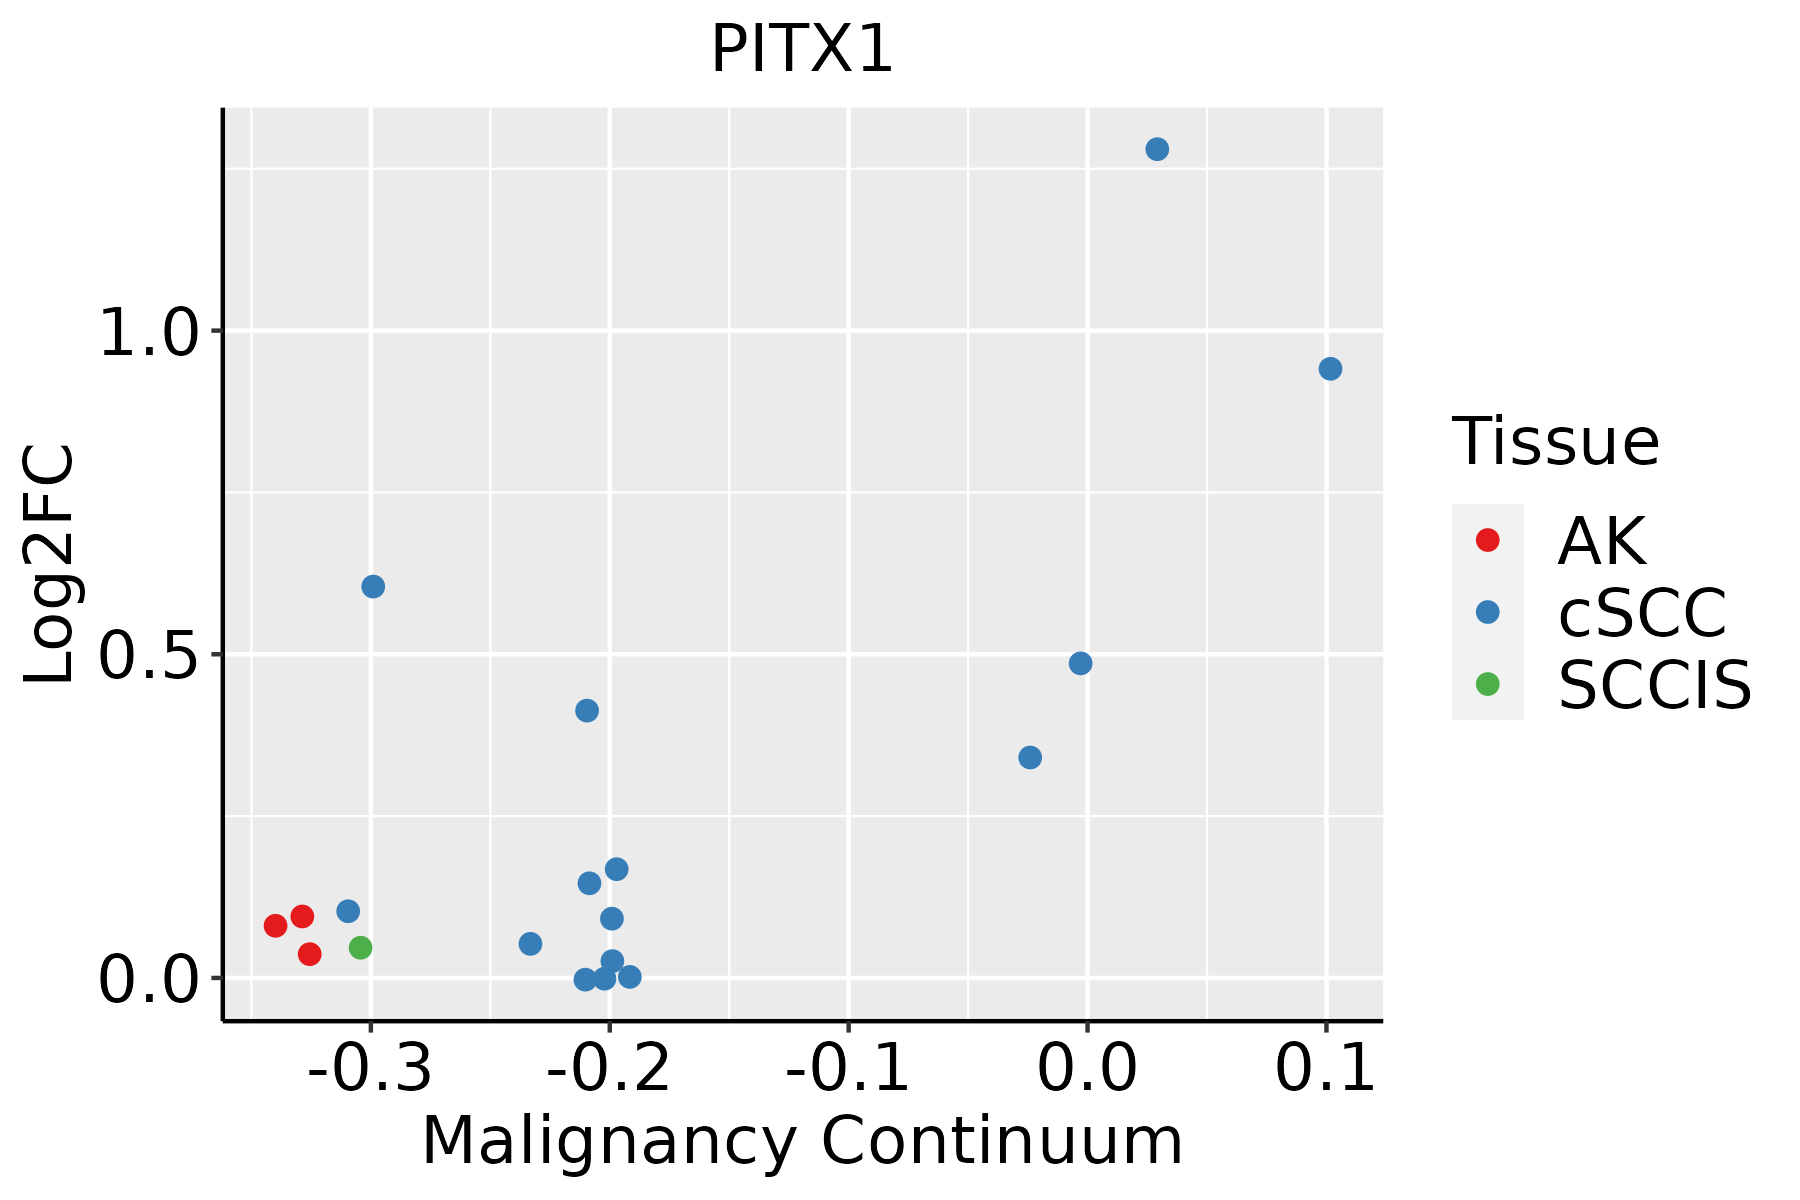 | AK: Actinic keratosis |
| cSCC: Cutaneous squamous cell carcinoma | ||
| SCCIS:squamous cell carcinoma in situ | ||
| Thyroid | 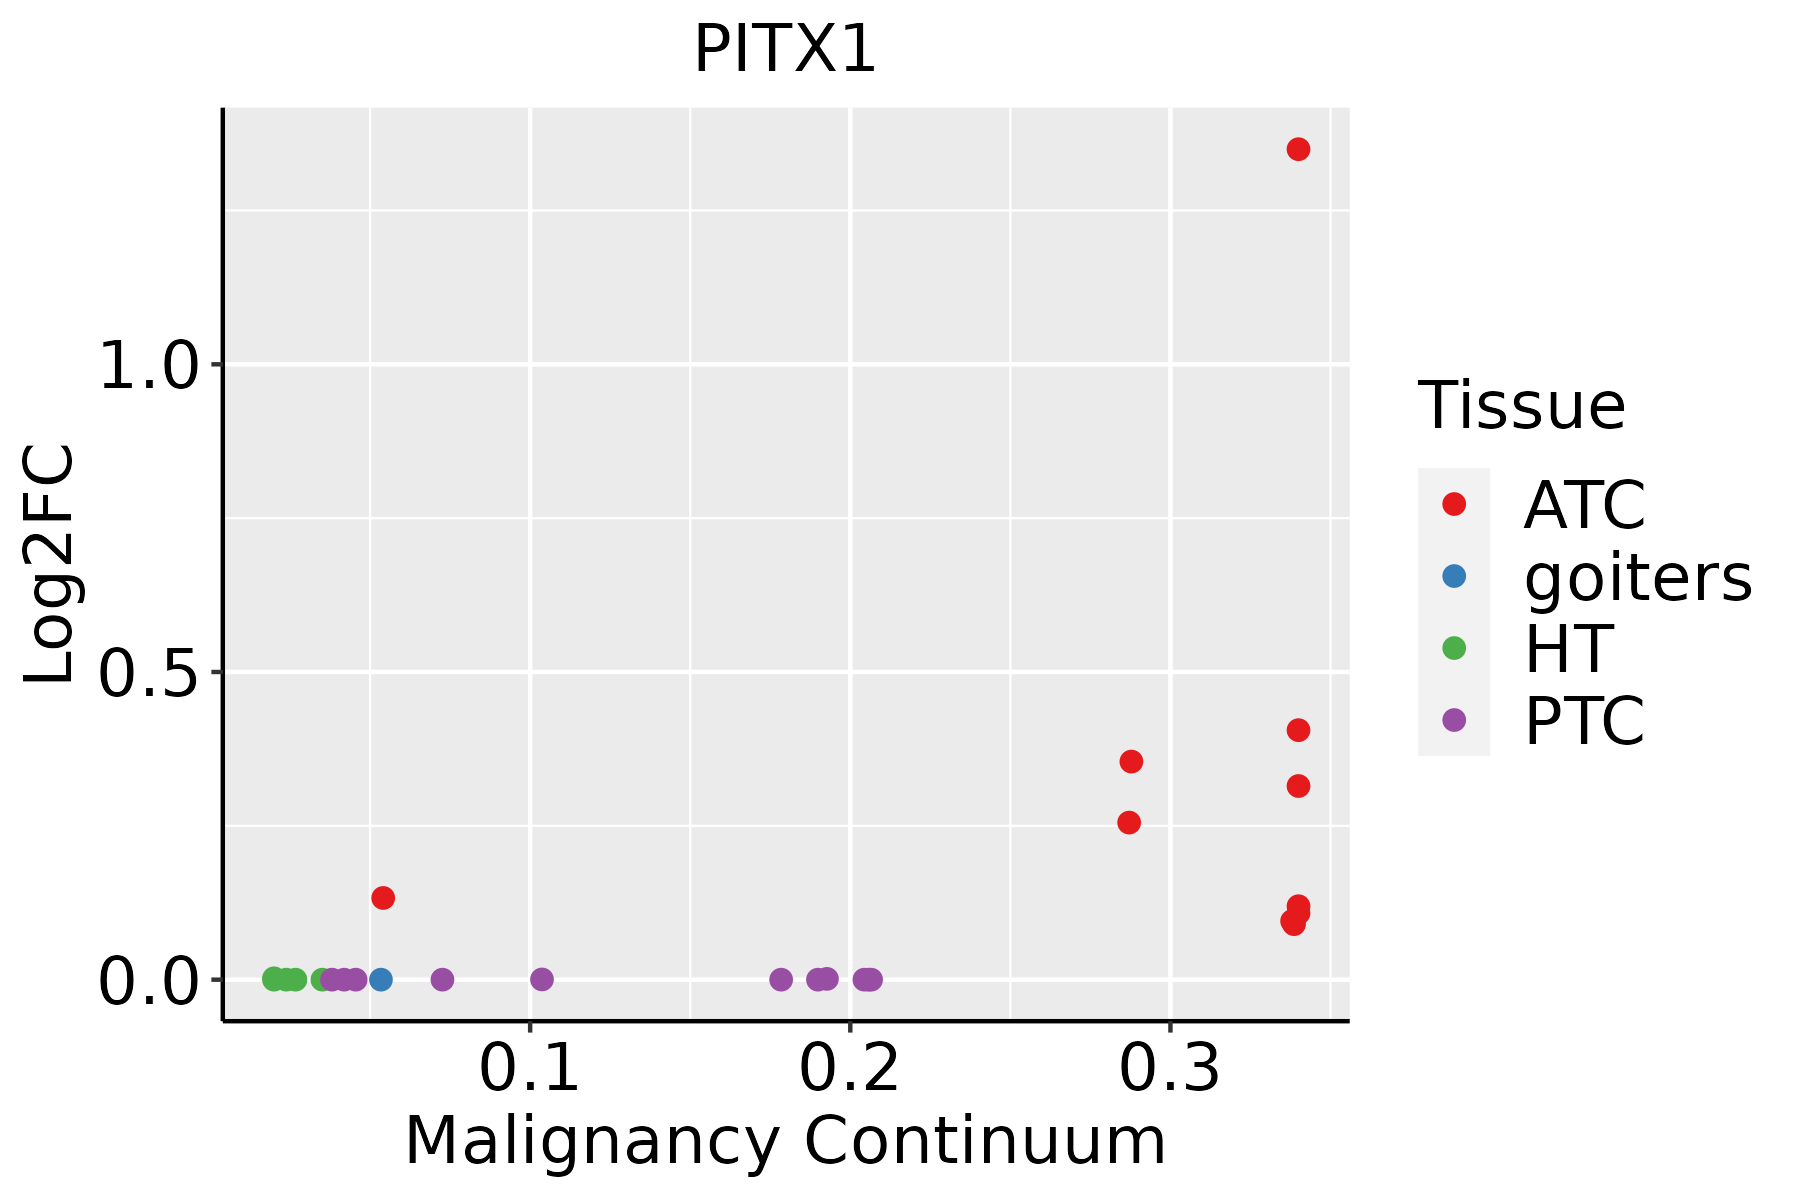 | ATC: Anaplastic thyroid cancer |
| HT: Hashimoto's thyroiditis | ||
| PTC: Papillary thyroid cancer |
| ∗log2FC in expression of this searched gene in stem-like cells from each diseased tissue sample relative to stem-like cells in normal samples in each tissue plotted against the malignancy continuum. Samples are colored based on if they are from different disease stage. |
Top |
Malignant transformation related pathway analysis |
| Find out the enriched GO biological processes and KEGG pathways involved in transition from healthy to precancer to cancer |
| Tissue | Disease Stage | Enriched GO biological Processes |
| Colorectum | AD |  |
| Colorectum | SER |  |
| Colorectum | MSS |  |
| Colorectum | MSI-H |  |
| Colorectum | FAP |  |
| ∗Top 15 enriched GO BP terms are showed in the bar plot of each disease state in each tissue. Each row represents a significant GO biological process which is colored according to the -log10(p.adjust). |
| Page: 1 2 3 4 5 6 7 8 9 |
| GO ID | Tissue | Disease Stage | Description | Gene Ratio | Bg Ratio | pvalue | p.adjust | Count |
| GO:004873214 | Breast | IDC | gland development | 64/1434 | 436/18723 | 3.47e-07 | 1.74e-05 | 64 |
| GO:006053711 | Breast | IDC | muscle tissue development | 50/1434 | 403/18723 | 4.91e-04 | 6.45e-03 | 50 |
| GO:00147061 | Breast | IDC | striated muscle tissue development | 46/1434 | 384/18723 | 1.67e-03 | 1.63e-02 | 46 |
| GO:00075172 | Breast | IDC | muscle organ development | 38/1434 | 327/18723 | 6.63e-03 | 4.62e-02 | 38 |
| GO:004873223 | Breast | DCIS | gland development | 60/1390 | 436/18723 | 2.50e-06 | 8.74e-05 | 60 |
| GO:006053721 | Breast | DCIS | muscle tissue development | 50/1390 | 403/18723 | 2.39e-04 | 3.74e-03 | 50 |
| GO:00147062 | Breast | DCIS | striated muscle tissue development | 46/1390 | 384/18723 | 8.88e-04 | 1.01e-02 | 46 |
| GO:00075171 | Breast | DCIS | muscle organ development | 37/1390 | 327/18723 | 6.86e-03 | 4.75e-02 | 37 |
| GO:004873210 | Cervix | CC | gland development | 84/2311 | 436/18723 | 1.93e-05 | 3.54e-04 | 84 |
| GO:00605375 | Cervix | CC | muscle tissue development | 76/2311 | 403/18723 | 9.76e-05 | 1.27e-03 | 76 |
| GO:00147064 | Cervix | CC | striated muscle tissue development | 72/2311 | 384/18723 | 1.76e-04 | 2.07e-03 | 72 |
| GO:0045445 | Cervix | CC | myoblast differentiation | 21/2311 | 84/18723 | 1.08e-03 | 8.94e-03 | 21 |
| GO:00487365 | Cervix | CC | appendage development | 35/2311 | 172/18723 | 1.88e-03 | 1.39e-02 | 35 |
| GO:00601735 | Cervix | CC | limb development | 35/2311 | 172/18723 | 1.88e-03 | 1.39e-02 | 35 |
| GO:00075173 | Cervix | CC | muscle organ development | 58/2311 | 327/18723 | 2.73e-03 | 1.85e-02 | 58 |
| GO:00309003 | Cervix | CC | forebrain development | 64/2311 | 379/18723 | 5.53e-03 | 3.19e-02 | 64 |
| GO:00075192 | Cervix | CC | skeletal muscle tissue development | 30/2311 | 155/18723 | 7.97e-03 | 4.18e-02 | 30 |
| GO:00075191 | Cervix | HSIL_HPV | skeletal muscle tissue development | 16/737 | 155/18723 | 4.13e-04 | 6.25e-03 | 16 |
| GO:00605381 | Cervix | HSIL_HPV | skeletal muscle organ development | 16/737 | 166/18723 | 8.78e-04 | 1.13e-02 | 16 |
| GO:001470611 | Cervix | HSIL_HPV | striated muscle tissue development | 28/737 | 384/18723 | 1.35e-03 | 1.55e-02 | 28 |
| Page: 1 2 3 4 5 |
| Pathway ID | Tissue | Disease Stage | Description | Gene Ratio | Bg Ratio | pvalue | p.adjust | qvalue | Count |
| Page: 1 |
Top |
Cell-cell communication analysis |
| Identification of potential cell-cell interactions between two cell types and their ligand-receptor pairs for different disease states |
| Ligand | Receptor | LRpair | Pathway | Tissue | Disease Stage |
| Page: 1 |
Top |
Single-cell gene regulatory network inference analysis |
| Find out the significant the regulons (TFs) and the target genes of each regulon across cell types for different disease states |
| TF | Cell Type | Tissue | Disease Stage | Target Gene | RSS | Regulon Activity |
| PITX1 | ICAF | Cervix | ADJ | KRTDAP,DMKN,CADM3, etc. | 2.16e-01 |  |
| PITX1 | MSC.MVA | Cervix | CC | KRTDAP,DMKN,CADM3, etc. | 1.68e-01 |  |
| PITX1 | BSM | Cervix | CC | KRTDAP,DMKN,CADM3, etc. | 8.10e-02 | |
| PITX1 | ICAF | Colorectum | AD | TMEM176A,TMEM176B,BMP4, etc. | 4.75e-01 |  |
| PITX1 | ICAF | Colorectum | ADJ | TMEM176A,TMEM176B,BMP4, etc. | 2.20e-01 |  |
| PITX1 | ICAF | Colorectum | Healthy | TMEM176A,TMEM176B,BMP4, etc. | 3.45e-02 |  |
| PITX1 | ICAF | Colorectum | SER | TMEM176A,TMEM176B,BMP4, etc. | 5.14e-01 |  |
| PITX1 | KER | Esophagus | Healthy | RGCC,AQP3,DSP, etc. | 2.49e-01 |  |
| PITX1 | ICAF | Esophagus | ADJ | C5orf66-AS1,GREM2,PTGDS, etc. | 1.48e-01 |  |
| PITX1 | STM | Liver | HCC | S100A11,CEACAM6,GSTP1, etc. | 1.97e-01 |  |
| ∗The dot plots of a searched regulon are shown for all cell subpopulations in each disease state of each tissue based on the regulon specific score inferred using pySCENIC and by calculating the average expression. |
| Page: 1 2 3 |
Top |
Somatic mutation of malignant transformation related genes |
| Annotation of somatic variants for genes involved in malignant transformation |
| Hugo Symbol | Variant Class | Variant Classification | dbSNP RS | HGVSc | HGVSp | HGVSp Short | SWISSPROT | BIOTYPE | SIFT | PolyPhen | Tumor Sample Barcode | Tissue | Histology | Sex | Age | Stage | Therapy Types | Drugs | Outcome |
| PITX1 | SNV | Missense_Mutation | novel | c.706G>A | p.Gly236Ser | p.G236S | P78337 | protein_coding | tolerated(0.11) | probably_damaging(0.991) | TCGA-A2-A0CO-01 | Breast | breast invasive carcinoma | Female | >=65 | I/II | Hormone Therapy | tamoxiphen | CR |
| PITX1 | SNV | Missense_Mutation | novel | c.703C>T | p.Pro235Ser | p.P235S | P78337 | protein_coding | tolerated(0.12) | benign(0.038) | TCGA-2W-A8YY-01 | Cervix | cervical & endocervical cancer | Female | <65 | I/II | Chemotherapy | cisplatin | CR |
| PITX1 | SNV | Missense_Mutation | rs754287927 | c.392C>T | p.Pro131Leu | p.P131L | P78337 | protein_coding | deleterious(0.03) | benign(0.146) | TCGA-2W-A8YY-01 | Cervix | cervical & endocervical cancer | Female | <65 | I/II | Chemotherapy | cisplatin | CR |
| PITX1 | SNV | Missense_Mutation | novel | c.194A>G | p.Lys65Arg | p.K65R | P78337 | protein_coding | tolerated(0.21) | benign(0.001) | TCGA-AA-3710-01 | Colorectum | colon adenocarcinoma | Female | >=65 | I/II | Unknown | Unknown | SD |
| PITX1 | SNV | Missense_Mutation | c.278G>A | p.Arg93His | p.R93H | P78337 | protein_coding | deleterious(0.03) | probably_damaging(0.998) | TCGA-AA-3966-01 | Colorectum | colon adenocarcinoma | Female | >=65 | I/II | Unknown | Unknown | SD | |
| PITX1 | SNV | Missense_Mutation | c.445C>T | p.Arg149Cys | p.R149C | P78337 | protein_coding | deleterious(0) | probably_damaging(0.967) | TCGA-AZ-6601-01 | Colorectum | colon adenocarcinoma | Male | >=65 | I/II | Unknown | Unknown | PD | |
| PITX1 | SNV | Missense_Mutation | rs773259804 | c.526N>A | p.Ala176Thr | p.A176T | P78337 | protein_coding | tolerated(0.35) | benign(0.212) | TCGA-CK-6746-01 | Colorectum | colon adenocarcinoma | Female | >=65 | I/II | Unknown | Unknown | SD |
| PITX1 | SNV | Missense_Mutation | novel | c.773N>T | p.Ser258Leu | p.S258L | P78337 | protein_coding | deleterious(0.02) | probably_damaging(0.945) | TCGA-A5-A0G1-01 | Endometrium | uterine corpus endometrioid carcinoma | Female | >=65 | I/II | Unknown | Unknown | SD |
| PITX1 | SNV | Missense_Mutation | novel | c.642C>A | p.Phe214Leu | p.F214L | P78337 | protein_coding | deleterious(0.05) | probably_damaging(0.914) | TCGA-A5-A1OF-01 | Endometrium | uterine corpus endometrioid carcinoma | Female | <65 | I/II | Unknown | Unknown | SD |
| PITX1 | SNV | Missense_Mutation | novel | c.209G>A | p.Ser70Asn | p.S70N | P78337 | protein_coding | tolerated(0.16) | benign(0.007) | TCGA-AJ-A8CW-01 | Endometrium | uterine corpus endometrioid carcinoma | Female | <65 | I/II | Unknown | Unknown | SD |
| Page: 1 2 3 4 |
Top |
Related drugs of malignant transformation related genes |
| Identification of chemicals and drugs interact with genes involved in malignant transfromation |
| (DGIdb 4.0) |
| Entrez ID | Symbol | Category | Interaction Types | Drug Claim Name | Drug Name | PMIDs |
| Page: 1 |

Copyright 2023-Present -The University of Texas Health Science Center at Houston |