
|
|||||
|
 | |
| |
| |
| |
| |
| |
|
Gene: PITRM1 |
Gene summary for PITRM1 |
| Gene information | Species | Human | Gene symbol | PITRM1 | Gene ID | 10531 |
| Gene name | pitrilysin metallopeptidase 1 | |
| Gene Alias | MP1 | |
| Cytomap | 10p15.2 | |
| Gene Type | protein-coding | GO ID | GO:0006508 | UniProtAcc | Q5JRX3 |
Top |
Malignant transformation analysis |
| Identification of the aberrant gene expression in precancerous and cancerous lesions by comparing the gene expression of stem-like cells in diseased tissues with normal stem cells |
| Entrez ID | Symbol | Replicates | Species | Organ | Tissue | Adj P-value | Log2FC | Malignancy |
| 10531 | PITRM1 | LZE4T | Human | Esophagus | ESCC | 5.45e-06 | 1.31e-01 | 0.0811 |
| 10531 | PITRM1 | LZE8T | Human | Esophagus | ESCC | 2.48e-08 | 1.84e-01 | 0.067 |
| 10531 | PITRM1 | LZE22T | Human | Esophagus | ESCC | 2.53e-03 | 2.44e-01 | 0.068 |
| 10531 | PITRM1 | LZE24T | Human | Esophagus | ESCC | 2.24e-15 | 3.87e-01 | 0.0596 |
| 10531 | PITRM1 | LZE6T | Human | Esophagus | ESCC | 8.07e-05 | 2.04e-01 | 0.0845 |
| 10531 | PITRM1 | P1T-E | Human | Esophagus | ESCC | 2.24e-03 | 3.72e-01 | 0.0875 |
| 10531 | PITRM1 | P2T-E | Human | Esophagus | ESCC | 1.96e-13 | 1.84e-01 | 0.1177 |
| 10531 | PITRM1 | P4T-E | Human | Esophagus | ESCC | 1.13e-16 | 2.48e-01 | 0.1323 |
| 10531 | PITRM1 | P5T-E | Human | Esophagus | ESCC | 3.89e-10 | 1.54e-01 | 0.1327 |
| 10531 | PITRM1 | P8T-E | Human | Esophagus | ESCC | 4.41e-11 | 2.21e-01 | 0.0889 |
| 10531 | PITRM1 | P9T-E | Human | Esophagus | ESCC | 1.17e-06 | 6.40e-02 | 0.1131 |
| 10531 | PITRM1 | P10T-E | Human | Esophagus | ESCC | 4.05e-12 | 1.05e-01 | 0.116 |
| 10531 | PITRM1 | P11T-E | Human | Esophagus | ESCC | 1.13e-06 | 2.84e-01 | 0.1426 |
| 10531 | PITRM1 | P12T-E | Human | Esophagus | ESCC | 5.68e-14 | 2.81e-01 | 0.1122 |
| 10531 | PITRM1 | P15T-E | Human | Esophagus | ESCC | 2.48e-18 | 1.71e-01 | 0.1149 |
| 10531 | PITRM1 | P16T-E | Human | Esophagus | ESCC | 3.27e-07 | 1.29e-01 | 0.1153 |
| 10531 | PITRM1 | P17T-E | Human | Esophagus | ESCC | 4.74e-10 | 3.37e-01 | 0.1278 |
| 10531 | PITRM1 | P19T-E | Human | Esophagus | ESCC | 3.35e-07 | 3.13e-01 | 0.1662 |
| 10531 | PITRM1 | P20T-E | Human | Esophagus | ESCC | 1.28e-09 | 1.64e-01 | 0.1124 |
| 10531 | PITRM1 | P21T-E | Human | Esophagus | ESCC | 2.76e-35 | 6.45e-01 | 0.1617 |
| Page: 1 2 3 4 |
| Tissue | Expression Dynamics | Abbreviation |
| Esophagus |  | ESCC: Esophageal squamous cell carcinoma |
| HGIN: High-grade intraepithelial neoplasias | ||
| LGIN: Low-grade intraepithelial neoplasias | ||
| Liver |  | HCC: Hepatocellular carcinoma |
| NAFLD: Non-alcoholic fatty liver disease | ||
| Oral Cavity | 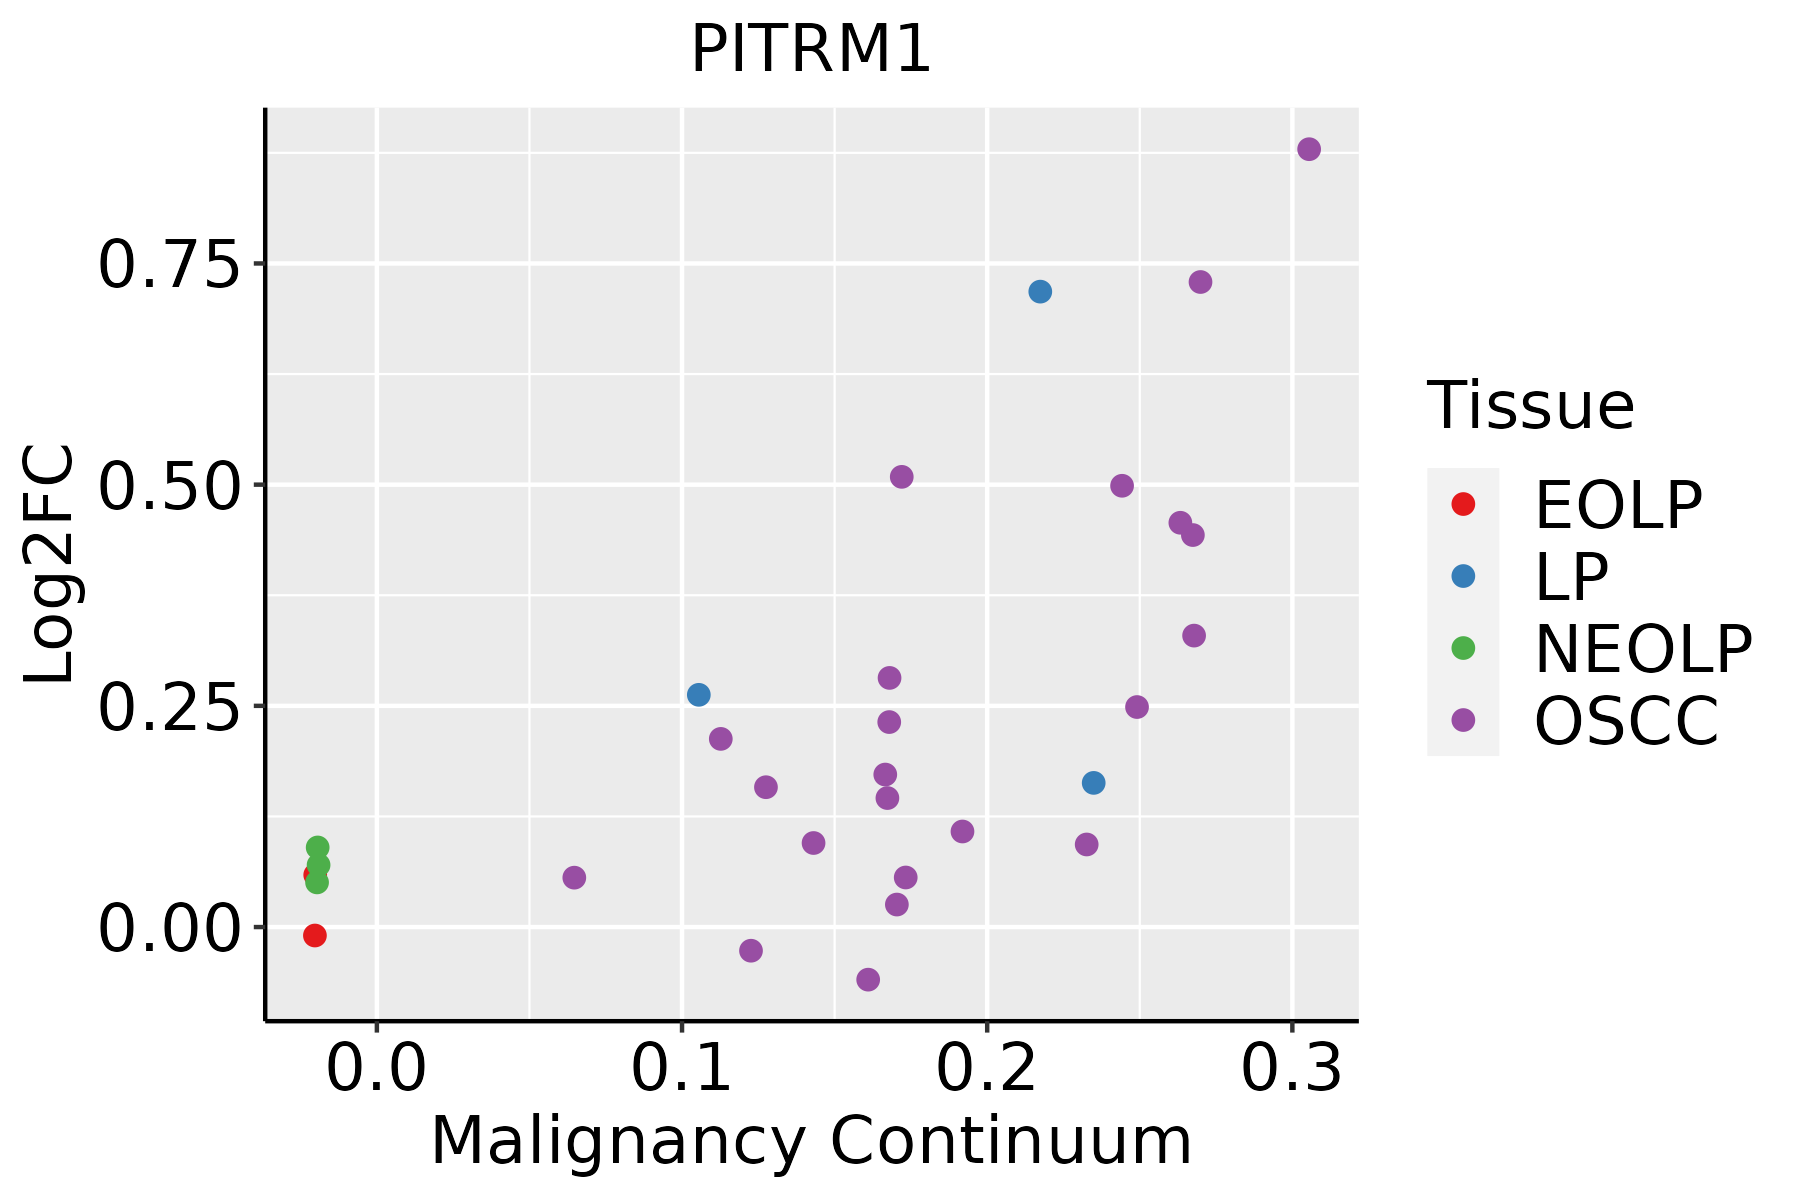 | EOLP: Erosive Oral lichen planus |
| LP: leukoplakia | ||
| NEOLP: Non-erosive oral lichen planus | ||
| OSCC: Oral squamous cell carcinoma |
| ∗log2FC in expression of this searched gene in stem-like cells from each diseased tissue sample relative to stem-like cells in normal samples in each tissue plotted against the malignancy continuum. Samples are colored based on if they are from different disease stage. |
Top |
Malignant transformation related pathway analysis |
| Find out the enriched GO biological processes and KEGG pathways involved in transition from healthy to precancer to cancer |
| Tissue | Disease Stage | Enriched GO biological Processes |
| Colorectum | AD |  |
| Colorectum | SER |  |
| Colorectum | MSS |  |
| Colorectum | MSI-H |  |
| Colorectum | FAP |  |
| ∗Top 15 enriched GO BP terms are showed in the bar plot of each disease state in each tissue. Each row represents a significant GO biological process which is colored according to the -log10(p.adjust). |
| Page: 1 2 3 4 5 6 7 8 9 |
| GO ID | Tissue | Disease Stage | Description | Gene Ratio | Bg Ratio | pvalue | p.adjust | Count |
| GO:0072594110 | Esophagus | ESCC | establishment of protein localization to organelle | 311/8552 | 422/18723 | 3.02e-32 | 2.13e-29 | 311 |
| GO:0006605111 | Esophagus | ESCC | protein targeting | 229/8552 | 314/18723 | 4.93e-23 | 1.01e-20 | 229 |
| GO:0006839110 | Esophagus | ESCC | mitochondrial transport | 187/8552 | 254/18723 | 8.35e-20 | 9.81e-18 | 187 |
| GO:0072655110 | Esophagus | ESCC | establishment of protein localization to mitochondrion | 97/8552 | 120/18723 | 2.17e-15 | 1.33e-13 | 97 |
| GO:0070585110 | Esophagus | ESCC | protein localization to mitochondrion | 100/8552 | 125/18723 | 2.96e-15 | 1.77e-13 | 100 |
| GO:0006626110 | Esophagus | ESCC | protein targeting to mitochondrion | 81/8552 | 100/18723 | 3.60e-13 | 1.67e-11 | 81 |
| GO:005160418 | Esophagus | ESCC | protein maturation | 189/8552 | 294/18723 | 7.64e-11 | 2.39e-09 | 189 |
| GO:001648514 | Esophagus | ESCC | protein processing | 134/8552 | 225/18723 | 1.81e-05 | 1.60e-04 | 134 |
| GO:007259422 | Liver | HCC | establishment of protein localization to organelle | 299/7958 | 422/18723 | 1.06e-32 | 6.10e-30 | 299 |
| GO:000660512 | Liver | HCC | protein targeting | 219/7958 | 314/18723 | 7.74e-23 | 1.49e-20 | 219 |
| GO:000683912 | Liver | HCC | mitochondrial transport | 184/7958 | 254/18723 | 2.30e-22 | 3.83e-20 | 184 |
| GO:007265512 | Liver | HCC | establishment of protein localization to mitochondrion | 98/7958 | 120/18723 | 1.18e-18 | 1.46e-16 | 98 |
| GO:007058512 | Liver | HCC | protein localization to mitochondrion | 101/7958 | 125/18723 | 1.53e-18 | 1.86e-16 | 101 |
| GO:000662612 | Liver | HCC | protein targeting to mitochondrion | 82/7958 | 100/18723 | 4.93e-16 | 4.05e-14 | 82 |
| GO:005160412 | Liver | HCC | protein maturation | 171/7958 | 294/18723 | 3.80e-08 | 8.30e-07 | 171 |
| GO:001648511 | Liver | HCC | protein processing | 121/7958 | 225/18723 | 4.01e-04 | 2.71e-03 | 121 |
| GO:007259418 | Oral cavity | OSCC | establishment of protein localization to organelle | 284/7305 | 422/18723 | 1.50e-32 | 1.35e-29 | 284 |
| GO:000660520 | Oral cavity | OSCC | protein targeting | 204/7305 | 314/18723 | 6.78e-21 | 1.13e-18 | 204 |
| GO:000683918 | Oral cavity | OSCC | mitochondrial transport | 162/7305 | 254/18723 | 8.96e-16 | 6.52e-14 | 162 |
| GO:007058518 | Oral cavity | OSCC | protein localization to mitochondrion | 91/7305 | 125/18723 | 1.60e-14 | 9.27e-13 | 91 |
| Page: 1 2 |
| Pathway ID | Tissue | Disease Stage | Description | Gene Ratio | Bg Ratio | pvalue | p.adjust | qvalue | Count |
| Page: 1 |
Top |
Cell-cell communication analysis |
| Identification of potential cell-cell interactions between two cell types and their ligand-receptor pairs for different disease states |
| Ligand | Receptor | LRpair | Pathway | Tissue | Disease Stage |
| Page: 1 |
Top |
Single-cell gene regulatory network inference analysis |
| Find out the significant the regulons (TFs) and the target genes of each regulon across cell types for different disease states |
| TF | Cell Type | Tissue | Disease Stage | Target Gene | RSS | Regulon Activity |
| ∗The dot plots of a searched regulon are shown for all cell subpopulations in each disease state of each tissue based on the regulon specific score inferred using pySCENIC and by calculating the average expression. |
| Page: 1 |
Top |
Somatic mutation of malignant transformation related genes |
| Annotation of somatic variants for genes involved in malignant transformation |
| Hugo Symbol | Variant Class | Variant Classification | dbSNP RS | HGVSc | HGVSp | HGVSp Short | SWISSPROT | BIOTYPE | SIFT | PolyPhen | Tumor Sample Barcode | Tissue | Histology | Sex | Age | Stage | Therapy Types | Drugs | Outcome |
| PITRM1 | SNV | Missense_Mutation | c.2801N>T | p.Gln934Leu | p.Q934L | Q5JRX3 | protein_coding | deleterious(0.03) | benign(0.21) | TCGA-A8-A075-01 | Breast | breast invasive carcinoma | Female | <65 | I/II | Chemotherapy | epirubicin | CR | |
| PITRM1 | SNV | Missense_Mutation | c.2180N>T | p.Ala727Val | p.A727V | Q5JRX3 | protein_coding | deleterious(0) | probably_damaging(0.998) | TCGA-A8-A097-01 | Breast | breast invasive carcinoma | Female | >=65 | I/II | Hormone Therapy | tamoxiphen | SD | |
| PITRM1 | SNV | Missense_Mutation | c.2747N>G | p.Asn916Ser | p.N916S | Q5JRX3 | protein_coding | tolerated(0.77) | benign(0.001) | TCGA-A8-A09Z-01 | Breast | breast invasive carcinoma | Female | >=65 | I/II | Unknown | Unknown | SD | |
| PITRM1 | SNV | Missense_Mutation | c.795C>G | p.Phe265Leu | p.F265L | Q5JRX3 | protein_coding | deleterious(0) | probably_damaging(0.991) | TCGA-AC-A23H-01 | Breast | breast invasive carcinoma | Female | >=65 | I/II | Unknown | Unknown | PD | |
| PITRM1 | SNV | Missense_Mutation | novel | c.769N>A | p.His257Asn | p.H257N | Q5JRX3 | protein_coding | deleterious(0) | possibly_damaging(0.893) | TCGA-AC-A3W5-01 | Breast | breast invasive carcinoma | Female | >=65 | I/II | Chemotherapy | docetaxel | CR |
| PITRM1 | SNV | Missense_Mutation | c.1987N>C | p.Glu663Gln | p.E663Q | Q5JRX3 | protein_coding | deleterious(0) | possibly_damaging(0.869) | TCGA-AN-A0FT-01 | Breast | breast invasive carcinoma | Female | <65 | I/II | Unknown | Unknown | SD | |
| PITRM1 | SNV | Missense_Mutation | rs534536142 | c.2896N>A | p.Ala966Thr | p.A966T | Q5JRX3 | protein_coding | deleterious(0.03) | possibly_damaging(0.493) | TCGA-D8-A1X9-01 | Breast | breast invasive carcinoma | Female | >=65 | I/II | Chemotherapy | adriamycin+cyclophosphamide | SD |
| PITRM1 | insertion | Nonsense_Mutation | novel | c.2118_2119insTATACGTAATTTTTCAAACAGGTGTTCAGTGAATGCG | p.Thr707TyrfsTer3 | p.T707Yfs*3 | Q5JRX3 | protein_coding | TCGA-A8-A08H-01 | Breast | breast invasive carcinoma | Female | >=65 | I/II | Unknown | Unknown | SD | ||
| PITRM1 | insertion | Nonsense_Mutation | novel | c.1800_1801insAAATATCAGATTTAGAAATGATCACAAAGGATATATCTGAAG | p.Ala600_Phe601insLysTyrGlnIleTerLysTerSerGlnArgIleTyrLeuLys | p.A600_F601insKYQI*K*SQRIYLK | Q5JRX3 | protein_coding | TCGA-A8-A08H-01 | Breast | breast invasive carcinoma | Female | >=65 | I/II | Unknown | Unknown | SD | ||
| PITRM1 | deletion | Frame_Shift_Del | novel | c.2875delT | p.Ser959LeufsTer6 | p.S959Lfs*6 | Q5JRX3 | protein_coding | TCGA-EW-A2FV-01 | Breast | breast invasive carcinoma | Female | <65 | III/IV | Chemotherapy | docetaxel | SD |
| Page: 1 2 3 4 5 6 7 8 9 10 |
Top |
Related drugs of malignant transformation related genes |
| Identification of chemicals and drugs interact with genes involved in malignant transfromation |
| (DGIdb 4.0) |
| Entrez ID | Symbol | Category | Interaction Types | Drug Claim Name | Drug Name | PMIDs |
| Page: 1 |

Copyright 2023-Present -The University of Texas Health Science Center at Houston |