
|
|||||
|
 | |
| |
| |
| |
| |
| |
|
Gene: PITPNB |
Gene summary for PITPNB |
| Gene information | Species | Human | Gene symbol | PITPNB | Gene ID | 23760 |
| Gene name | phosphatidylinositol transfer protein beta | |
| Gene Alias | PI-TP-beta | |
| Cytomap | 22q12.1 | |
| Gene Type | protein-coding | GO ID | GO:0006629 | UniProtAcc | P48739 |
Top |
Malignant transformation analysis |
| Identification of the aberrant gene expression in precancerous and cancerous lesions by comparing the gene expression of stem-like cells in diseased tissues with normal stem cells |
| Entrez ID | Symbol | Replicates | Species | Organ | Tissue | Adj P-value | Log2FC | Malignancy |
| 23760 | PITPNB | HTA11_3410_2000001011 | Human | Colorectum | AD | 4.12e-04 | -2.81e-01 | 0.0155 |
| 23760 | PITPNB | HTA11_2487_2000001011 | Human | Colorectum | SER | 2.82e-02 | -3.67e-01 | -0.1808 |
| 23760 | PITPNB | HTA11_3361_2000001011 | Human | Colorectum | AD | 4.25e-06 | -6.05e-01 | -0.1207 |
| 23760 | PITPNB | HTA11_696_2000001011 | Human | Colorectum | AD | 7.08e-04 | -3.44e-01 | -0.1464 |
| 23760 | PITPNB | HTA11_866_2000001011 | Human | Colorectum | AD | 3.17e-02 | -3.06e-01 | -0.1001 |
| 23760 | PITPNB | HTA11_8622_2000001021 | Human | Colorectum | SER | 1.62e-02 | -3.41e-01 | 0.0528 |
| 23760 | PITPNB | HTA11_10711_2000001011 | Human | Colorectum | AD | 2.02e-03 | -4.86e-01 | 0.0338 |
| 23760 | PITPNB | HTA11_99999965104_69814 | Human | Colorectum | MSS | 7.17e-04 | 6.08e-01 | 0.281 |
| 23760 | PITPNB | F007 | Human | Colorectum | FAP | 4.96e-06 | -5.19e-01 | 0.1176 |
| 23760 | PITPNB | A001-C-207 | Human | Colorectum | FAP | 1.09e-04 | -3.23e-01 | 0.1278 |
| 23760 | PITPNB | A015-C-203 | Human | Colorectum | FAP | 2.03e-31 | -5.35e-01 | -0.1294 |
| 23760 | PITPNB | A015-C-204 | Human | Colorectum | FAP | 3.94e-08 | -3.31e-01 | -0.0228 |
| 23760 | PITPNB | A014-C-040 | Human | Colorectum | FAP | 5.20e-03 | -3.73e-01 | -0.1184 |
| 23760 | PITPNB | A002-C-201 | Human | Colorectum | FAP | 1.92e-17 | -5.37e-01 | 0.0324 |
| 23760 | PITPNB | A002-C-203 | Human | Colorectum | FAP | 4.48e-04 | -2.34e-01 | 0.2786 |
| 23760 | PITPNB | A001-C-119 | Human | Colorectum | FAP | 1.01e-09 | -5.04e-01 | -0.1557 |
| 23760 | PITPNB | A001-C-108 | Human | Colorectum | FAP | 2.24e-22 | -4.32e-01 | -0.0272 |
| 23760 | PITPNB | A002-C-205 | Human | Colorectum | FAP | 8.87e-26 | -6.03e-01 | -0.1236 |
| 23760 | PITPNB | A001-C-104 | Human | Colorectum | FAP | 1.76e-05 | -3.38e-01 | 0.0184 |
| 23760 | PITPNB | A015-C-005 | Human | Colorectum | FAP | 8.65e-06 | -3.59e-01 | -0.0336 |
| Page: 1 2 3 4 5 6 7 8 9 |
| Tissue | Expression Dynamics | Abbreviation |
| Colorectum (GSE201348) |  | FAP: Familial adenomatous polyposis |
| CRC: Colorectal cancer | ||
| Colorectum (HTA11) | 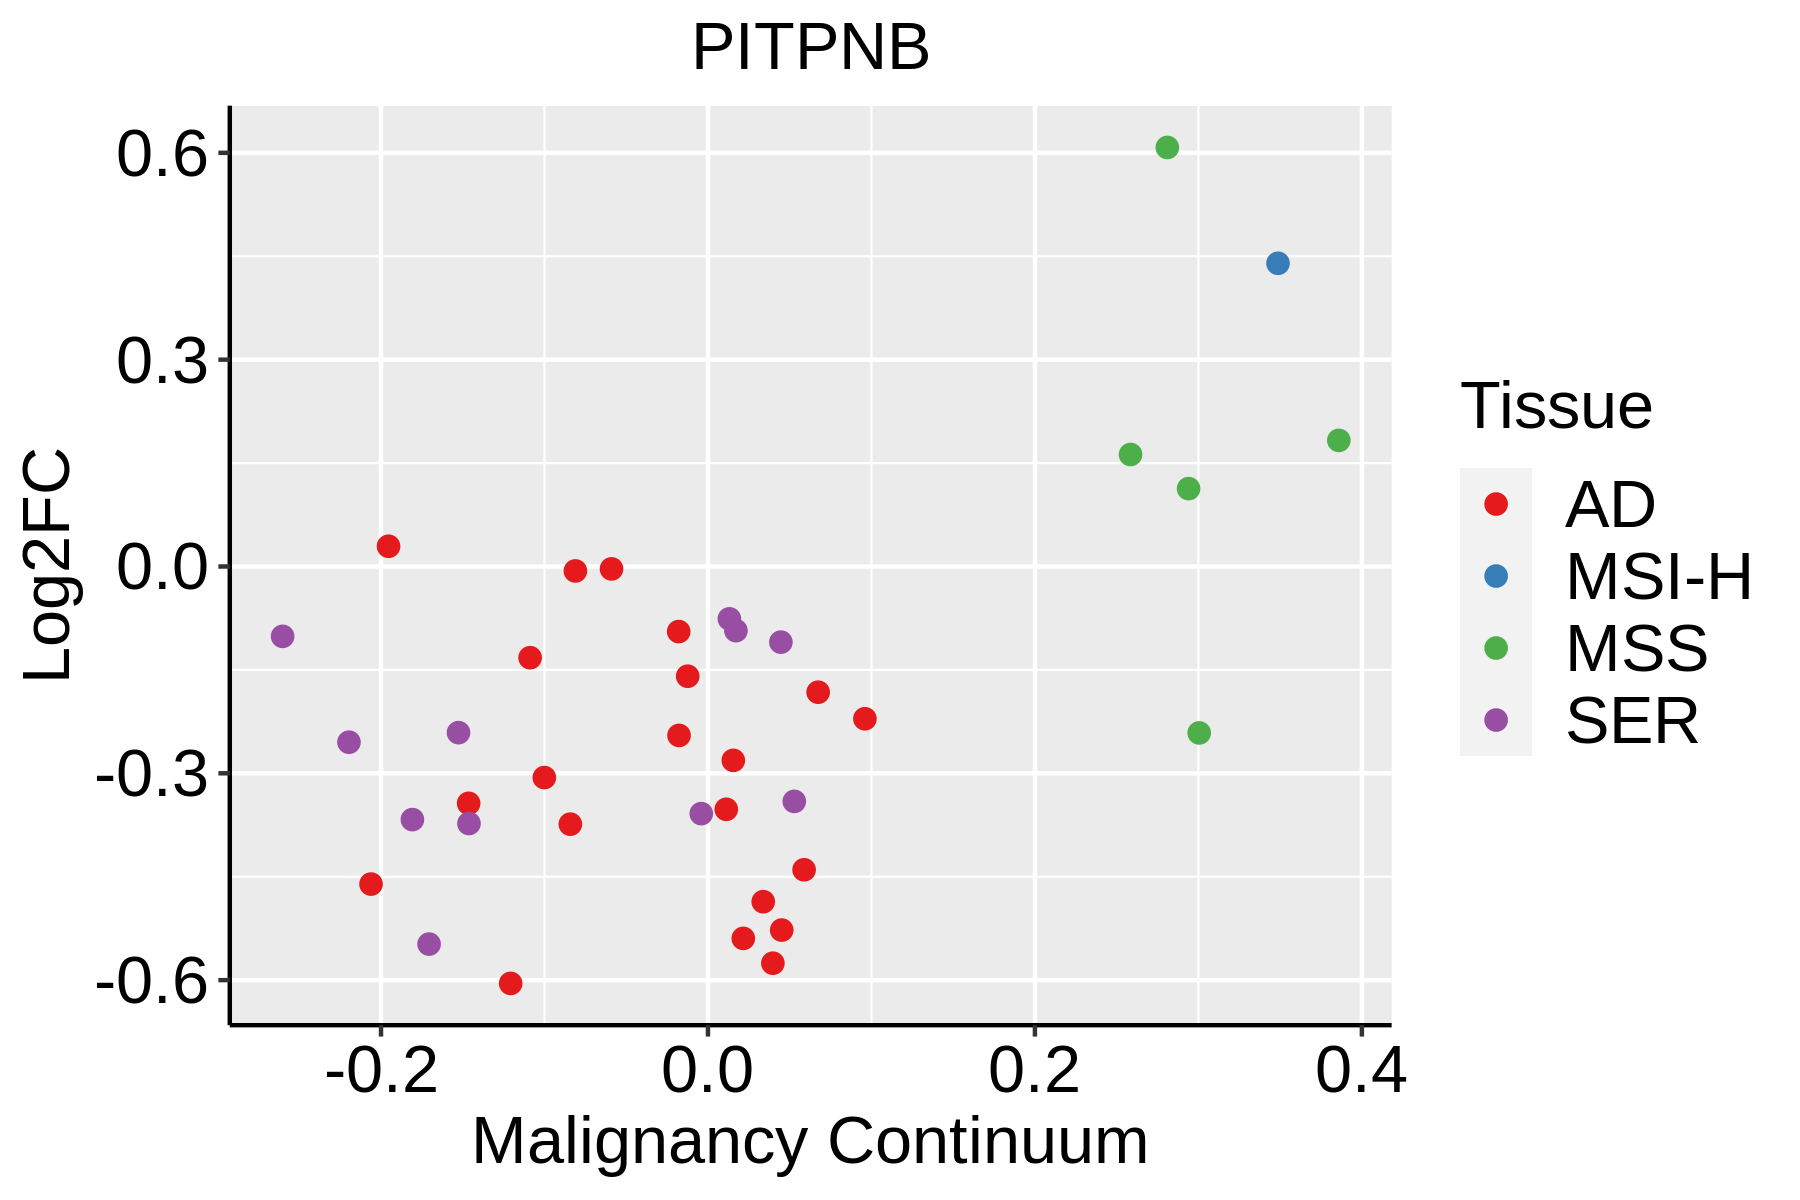 | AD: Adenomas |
| SER: Sessile serrated lesions | ||
| MSI-H: Microsatellite-high colorectal cancer | ||
| MSS: Microsatellite stable colorectal cancer | ||
| Esophagus |  | ESCC: Esophageal squamous cell carcinoma |
| HGIN: High-grade intraepithelial neoplasias | ||
| LGIN: Low-grade intraepithelial neoplasias | ||
| Liver |  | HCC: Hepatocellular carcinoma |
| NAFLD: Non-alcoholic fatty liver disease | ||
| Oral Cavity |  | EOLP: Erosive Oral lichen planus |
| LP: leukoplakia | ||
| NEOLP: Non-erosive oral lichen planus | ||
| OSCC: Oral squamous cell carcinoma | ||
| Prostate |  | BPH: Benign Prostatic Hyperplasia |
| Skin | 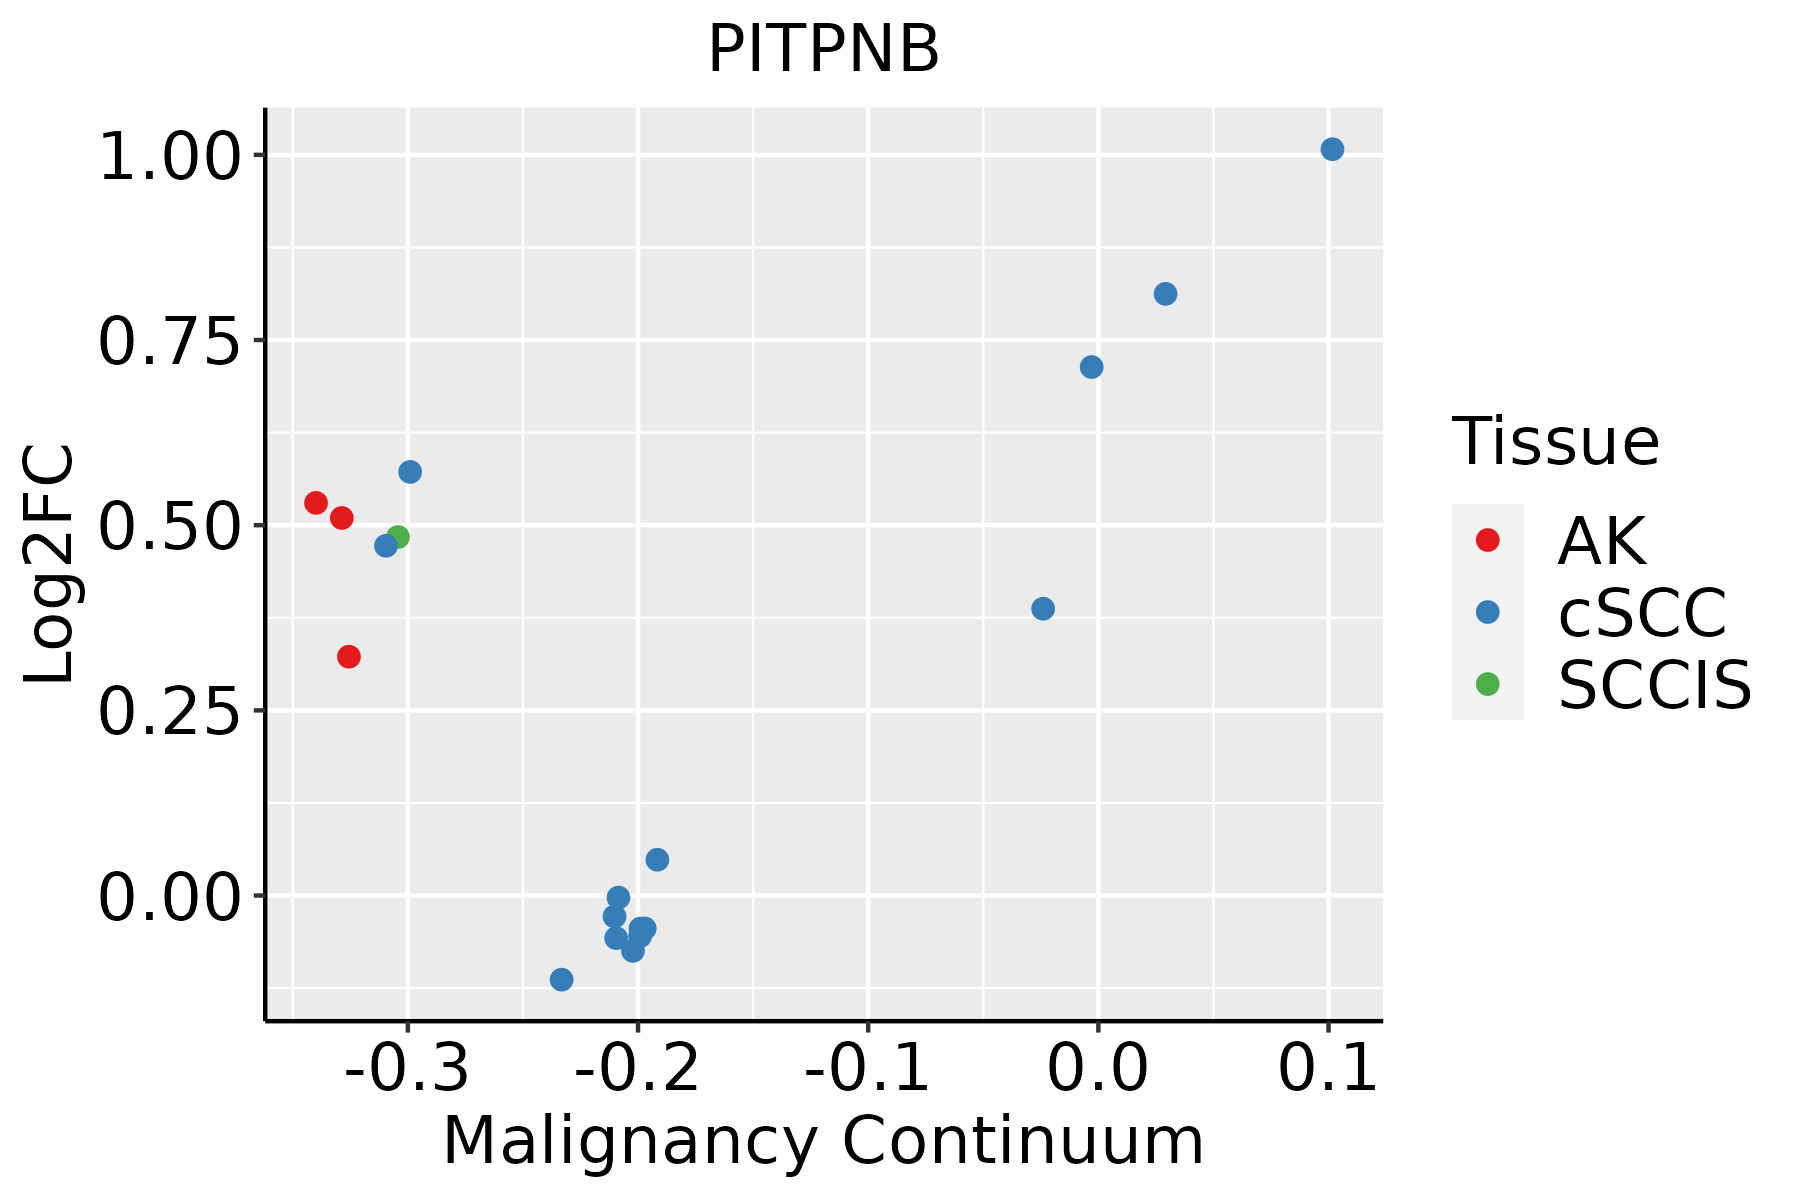 | AK: Actinic keratosis |
| cSCC: Cutaneous squamous cell carcinoma | ||
| SCCIS:squamous cell carcinoma in situ | ||
| Thyroid |  | ATC: Anaplastic thyroid cancer |
| HT: Hashimoto's thyroiditis | ||
| PTC: Papillary thyroid cancer |
| ∗log2FC in expression of this searched gene in stem-like cells from each diseased tissue sample relative to stem-like cells in normal samples in each tissue plotted against the malignancy continuum. Samples are colored based on if they are from different disease stage. |
Top |
Malignant transformation related pathway analysis |
| Find out the enriched GO biological processes and KEGG pathways involved in transition from healthy to precancer to cancer |
| Tissue | Disease Stage | Enriched GO biological Processes |
| Colorectum | AD |  |
| Colorectum | SER |  |
| Colorectum | MSS |  |
| Colorectum | MSI-H |  |
| Colorectum | FAP |  |
| ∗Top 15 enriched GO BP terms are showed in the bar plot of each disease state in each tissue. Each row represents a significant GO biological process which is colored according to the -log10(p.adjust). |
| Page: 1 2 3 4 5 6 7 8 9 |
| GO ID | Tissue | Disease Stage | Description | Gene Ratio | Bg Ratio | pvalue | p.adjust | Count |
| GO:0048193 | Colorectum | AD | Golgi vesicle transport | 109/3918 | 296/18723 | 1.80e-10 | 1.68e-08 | 109 |
| GO:0006890 | Colorectum | AD | retrograde vesicle-mediated transport, Golgi to endoplasmic reticulum | 27/3918 | 52/18723 | 7.67e-07 | 2.70e-05 | 27 |
| GO:0010876 | Colorectum | AD | lipid localization | 120/3918 | 448/18723 | 1.59e-03 | 1.33e-02 | 120 |
| GO:0006869 | Colorectum | AD | lipid transport | 108/3918 | 398/18723 | 1.67e-03 | 1.39e-02 | 108 |
| GO:0015748 | Colorectum | AD | organophosphate ester transport | 42/3918 | 140/18723 | 7.04e-03 | 4.31e-02 | 42 |
| GO:00481931 | Colorectum | SER | Golgi vesicle transport | 79/2897 | 296/18723 | 4.20e-07 | 2.15e-05 | 79 |
| GO:00068901 | Colorectum | SER | retrograde vesicle-mediated transport, Golgi to endoplasmic reticulum | 20/2897 | 52/18723 | 4.80e-05 | 1.18e-03 | 20 |
| GO:00481932 | Colorectum | MSS | Golgi vesicle transport | 101/3467 | 296/18723 | 9.09e-11 | 9.77e-09 | 101 |
| GO:00068902 | Colorectum | MSS | retrograde vesicle-mediated transport, Golgi to endoplasmic reticulum | 26/3467 | 52/18723 | 2.66e-07 | 1.10e-05 | 26 |
| GO:00108761 | Colorectum | MSS | lipid localization | 104/3467 | 448/18723 | 6.76e-03 | 4.38e-02 | 104 |
| GO:00481934 | Colorectum | FAP | Golgi vesicle transport | 77/2622 | 296/18723 | 2.86e-08 | 2.62e-06 | 77 |
| GO:00068904 | Colorectum | FAP | retrograde vesicle-mediated transport, Golgi to endoplasmic reticulum | 18/2622 | 52/18723 | 1.48e-04 | 2.29e-03 | 18 |
| GO:00068691 | Colorectum | FAP | lipid transport | 81/2622 | 398/18723 | 2.84e-04 | 3.76e-03 | 81 |
| GO:00108762 | Colorectum | FAP | lipid localization | 85/2622 | 448/18723 | 1.92e-03 | 1.63e-02 | 85 |
| GO:0015914 | Colorectum | FAP | phospholipid transport | 23/2622 | 96/18723 | 6.09e-03 | 3.82e-02 | 23 |
| GO:00481935 | Colorectum | CRC | Golgi vesicle transport | 59/2078 | 296/18723 | 5.47e-06 | 2.17e-04 | 59 |
| GO:00068692 | Colorectum | CRC | lipid transport | 63/2078 | 398/18723 | 2.36e-03 | 2.26e-02 | 63 |
| GO:00108763 | Colorectum | CRC | lipid localization | 68/2078 | 448/18723 | 4.60e-03 | 3.58e-02 | 68 |
| GO:004819317 | Esophagus | HGIN | Golgi vesicle transport | 83/2587 | 296/18723 | 8.59e-11 | 8.89e-09 | 83 |
| GO:000689016 | Esophagus | HGIN | retrograde vesicle-mediated transport, Golgi to endoplasmic reticulum | 19/2587 | 52/18723 | 3.44e-05 | 8.67e-04 | 19 |
| Page: 1 2 3 4 |
| Pathway ID | Tissue | Disease Stage | Description | Gene Ratio | Bg Ratio | pvalue | p.adjust | qvalue | Count |
| Page: 1 |
Top |
Cell-cell communication analysis |
| Identification of potential cell-cell interactions between two cell types and their ligand-receptor pairs for different disease states |
| Ligand | Receptor | LRpair | Pathway | Tissue | Disease Stage |
| Page: 1 |
Top |
Single-cell gene regulatory network inference analysis |
| Find out the significant the regulons (TFs) and the target genes of each regulon across cell types for different disease states |
| TF | Cell Type | Tissue | Disease Stage | Target Gene | RSS | Regulon Activity |
| ∗The dot plots of a searched regulon are shown for all cell subpopulations in each disease state of each tissue based on the regulon specific score inferred using pySCENIC and by calculating the average expression. |
| Page: 1 |
Top |
Somatic mutation of malignant transformation related genes |
| Annotation of somatic variants for genes involved in malignant transformation |
| Hugo Symbol | Variant Class | Variant Classification | dbSNP RS | HGVSc | HGVSp | HGVSp Short | SWISSPROT | BIOTYPE | SIFT | PolyPhen | Tumor Sample Barcode | Tissue | Histology | Sex | Age | Stage | Therapy Types | Drugs | Outcome |
| PITPNB | SNV | Missense_Mutation | c.15G>C | p.Leu5Phe | p.L5F | P48739 | protein_coding | deleterious(0.03) | benign(0.073) | TCGA-E2-A152-01 | Breast | breast invasive carcinoma | Female | <65 | I/II | Targeted Molecular therapy | trastuzumab | PD | |
| PITPNB | SNV | Missense_Mutation | c.103N>C | p.Glu35Gln | p.E35Q | P48739 | protein_coding | deleterious(0.04) | probably_damaging(0.975) | TCGA-IR-A3LK-01 | Cervix | cervical & endocervical cancer | Female | >=65 | I/II | Chemotherapy | cisplatin | PD | |
| PITPNB | SNV | Missense_Mutation | novel | c.316A>C | p.Lys106Gln | p.K106Q | P48739 | protein_coding | tolerated(0.06) | possibly_damaging(0.675) | TCGA-AA-3984-01 | Colorectum | colon adenocarcinoma | Female | <65 | I/II | Unknown | Unknown | SD |
| PITPNB | SNV | Missense_Mutation | novel | c.140N>G | p.Asn47Ser | p.N47S | P48739 | protein_coding | deleterious(0.01) | possibly_damaging(0.452) | TCGA-AA-A00N-01 | Colorectum | colon adenocarcinoma | Male | >=65 | I/II | Unknown | Unknown | PD |
| PITPNB | SNV | Missense_Mutation | novel | c.340N>A | p.Glu114Lys | p.E114K | P48739 | protein_coding | deleterious(0.04) | possibly_damaging(0.459) | TCGA-AZ-4315-01 | Colorectum | colon adenocarcinoma | Male | <65 | I/II | Unknown | Unknown | SD |
| PITPNB | SNV | Missense_Mutation | c.220N>T | p.Val74Leu | p.V74L | P48739 | protein_coding | tolerated(0.37) | benign(0.007) | TCGA-EI-7002-01 | Colorectum | rectum adenocarcinoma | Male | <65 | III/IV | Chemotherapy | irinotecan+5-fluorouracilim | SD | |
| PITPNB | SNV | Missense_Mutation | novel | c.662G>A | p.Arg221Gln | p.R221Q | P48739 | protein_coding | tolerated(0.05) | probably_damaging(0.99) | TCGA-A5-A0G2-01 | Endometrium | uterine corpus endometrioid carcinoma | Female | <65 | III/IV | Unknown | Unknown | SD |
| PITPNB | SNV | Missense_Mutation | c.631N>A | p.Val211Ile | p.V211I | P48739 | protein_coding | tolerated(0.56) | benign(0.065) | TCGA-AP-A051-01 | Endometrium | uterine corpus endometrioid carcinoma | Female | >=65 | I/II | Unknown | Unknown | SD | |
| PITPNB | SNV | Missense_Mutation | c.557G>A | p.Ser186Asn | p.S186N | P48739 | protein_coding | tolerated(1) | benign(0) | TCGA-AP-A0LM-01 | Endometrium | uterine corpus endometrioid carcinoma | Female | <65 | III/IV | Chemotherapy | cisplatin | SD | |
| PITPNB | SNV | Missense_Mutation | novel | c.386N>A | p.Gly129Asp | p.G129D | P48739 | protein_coding | tolerated(0.23) | benign(0) | TCGA-AX-A1CE-01 | Endometrium | uterine corpus endometrioid carcinoma | Female | <65 | I/II | Unspecific | Paclitaxel | SD |
| Page: 1 2 3 4 |
Top |
Related drugs of malignant transformation related genes |
| Identification of chemicals and drugs interact with genes involved in malignant transfromation |
| (DGIdb 4.0) |
| Entrez ID | Symbol | Category | Interaction Types | Drug Claim Name | Drug Name | PMIDs |
| Page: 1 |

Copyright 2023-Present -The University of Texas Health Science Center at Houston |