
|
|||||
|
 | |
| |
| |
| |
| |
| |
|
Gene: PITPNA |
Gene summary for PITPNA |
| Gene information | Species | Human | Gene symbol | PITPNA | Gene ID | 5306 |
| Gene name | phosphatidylinositol transfer protein alpha | |
| Gene Alias | HEL-S-36 | |
| Cytomap | 17p13.3 | |
| Gene Type | protein-coding | GO ID | GO:0003008 | UniProtAcc | Q00169 |
Top |
Malignant transformation analysis |
| Identification of the aberrant gene expression in precancerous and cancerous lesions by comparing the gene expression of stem-like cells in diseased tissues with normal stem cells |
| Entrez ID | Symbol | Replicates | Species | Organ | Tissue | Adj P-value | Log2FC | Malignancy |
| 5306 | PITPNA | HTA11_347_2000001011 | Human | Colorectum | AD | 4.16e-02 | 3.13e-01 | -0.1954 |
| 5306 | PITPNA | HTA11_411_2000001011 | Human | Colorectum | SER | 5.17e-03 | 8.34e-01 | -0.2602 |
| 5306 | PITPNA | HTA11_83_2000001011 | Human | Colorectum | SER | 4.57e-02 | 4.54e-01 | -0.1526 |
| 5306 | PITPNA | HTA11_696_2000001011 | Human | Colorectum | AD | 1.79e-02 | 4.13e-01 | -0.1464 |
| 5306 | PITPNA | HTA11_1391_2000001011 | Human | Colorectum | AD | 9.80e-04 | 5.38e-01 | -0.059 |
| 5306 | PITPNA | A001-C-207 | Human | Colorectum | FAP | 3.49e-02 | -1.92e-01 | 0.1278 |
| 5306 | PITPNA | A015-C-203 | Human | Colorectum | FAP | 7.94e-23 | -4.12e-01 | -0.1294 |
| 5306 | PITPNA | A015-C-204 | Human | Colorectum | FAP | 4.10e-02 | -2.16e-01 | -0.0228 |
| 5306 | PITPNA | A014-C-040 | Human | Colorectum | FAP | 1.02e-02 | -3.66e-01 | -0.1184 |
| 5306 | PITPNA | A002-C-201 | Human | Colorectum | FAP | 3.21e-07 | -2.62e-01 | 0.0324 |
| 5306 | PITPNA | A002-C-203 | Human | Colorectum | FAP | 8.73e-04 | -1.91e-01 | 0.2786 |
| 5306 | PITPNA | A001-C-119 | Human | Colorectum | FAP | 4.73e-02 | -2.94e-01 | -0.1557 |
| 5306 | PITPNA | A001-C-108 | Human | Colorectum | FAP | 1.09e-14 | -3.58e-01 | -0.0272 |
| 5306 | PITPNA | A002-C-205 | Human | Colorectum | FAP | 2.12e-14 | -2.61e-01 | -0.1236 |
| 5306 | PITPNA | A001-C-104 | Human | Colorectum | FAP | 9.45e-03 | -2.34e-01 | 0.0184 |
| 5306 | PITPNA | A015-C-005 | Human | Colorectum | FAP | 5.61e-03 | -2.86e-01 | -0.0336 |
| 5306 | PITPNA | A015-C-006 | Human | Colorectum | FAP | 7.85e-10 | -4.38e-01 | -0.0994 |
| 5306 | PITPNA | A015-C-106 | Human | Colorectum | FAP | 8.44e-11 | -3.25e-01 | -0.0511 |
| 5306 | PITPNA | A002-C-114 | Human | Colorectum | FAP | 8.75e-12 | -3.81e-01 | -0.1561 |
| 5306 | PITPNA | A015-C-104 | Human | Colorectum | FAP | 3.67e-22 | -4.12e-01 | -0.1899 |
| Page: 1 2 3 4 5 6 7 |
| Tissue | Expression Dynamics | Abbreviation |
| Colorectum (GSE201348) |  | FAP: Familial adenomatous polyposis |
| CRC: Colorectal cancer | ||
| Colorectum (HTA11) |  | AD: Adenomas |
| SER: Sessile serrated lesions | ||
| MSI-H: Microsatellite-high colorectal cancer | ||
| MSS: Microsatellite stable colorectal cancer | ||
| Esophagus | 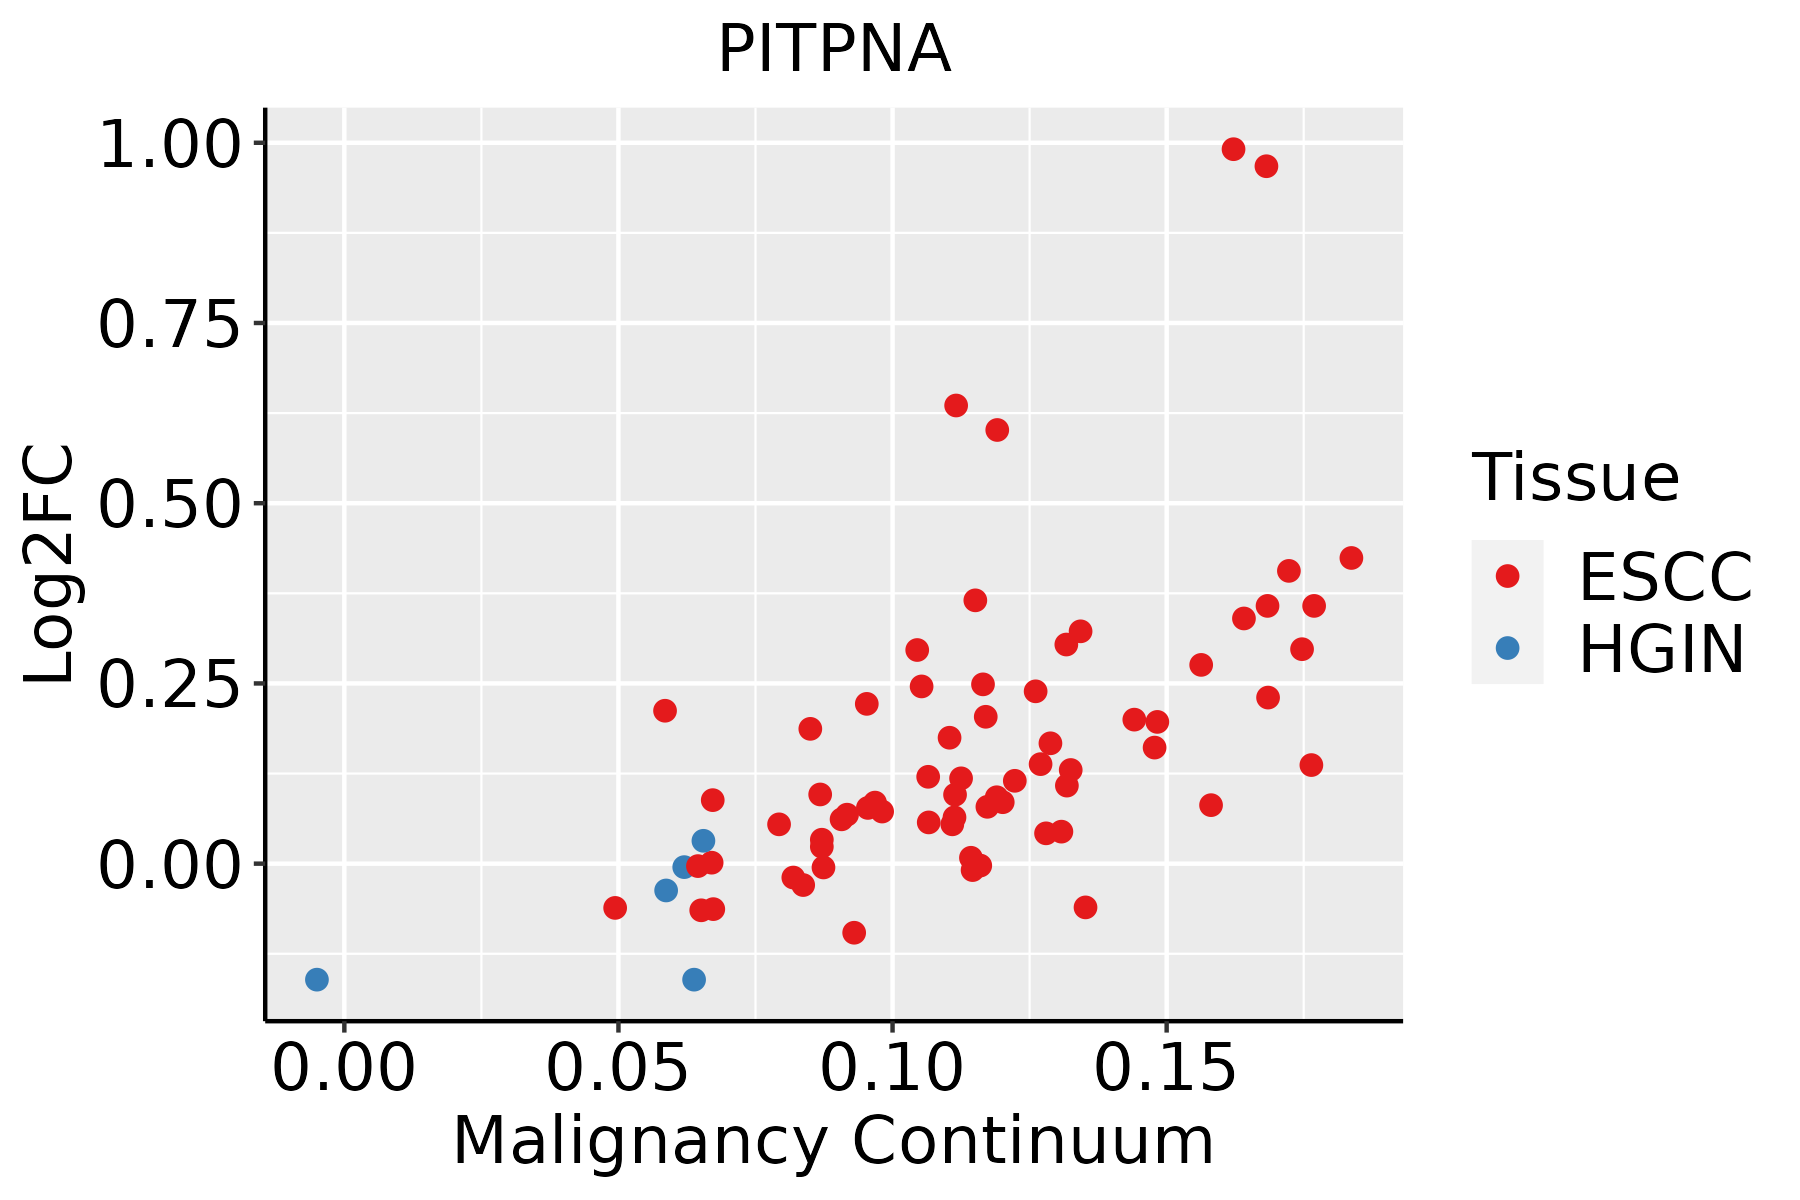 | ESCC: Esophageal squamous cell carcinoma |
| HGIN: High-grade intraepithelial neoplasias | ||
| LGIN: Low-grade intraepithelial neoplasias | ||
| Oral Cavity |  | EOLP: Erosive Oral lichen planus |
| LP: leukoplakia | ||
| NEOLP: Non-erosive oral lichen planus | ||
| OSCC: Oral squamous cell carcinoma | ||
| Prostate | 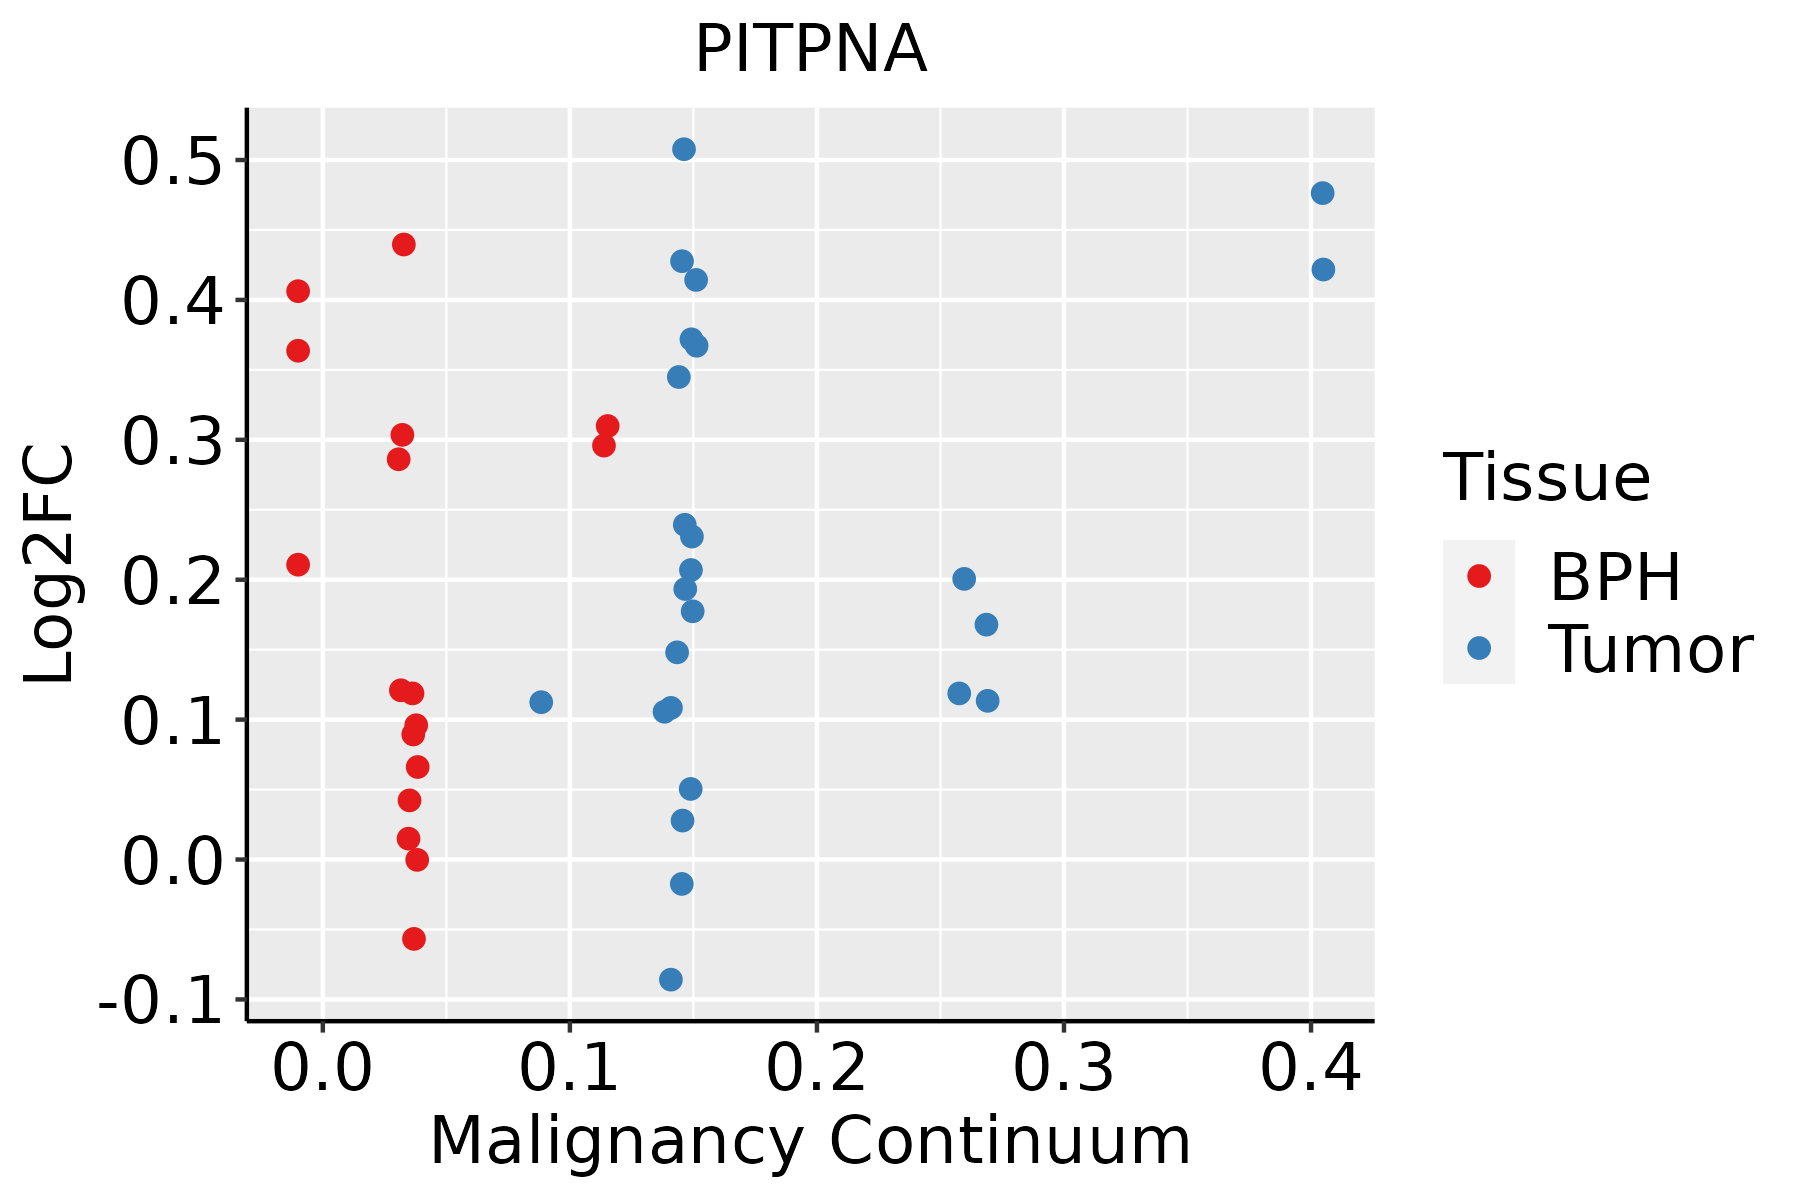 | BPH: Benign Prostatic Hyperplasia |
| Skin | 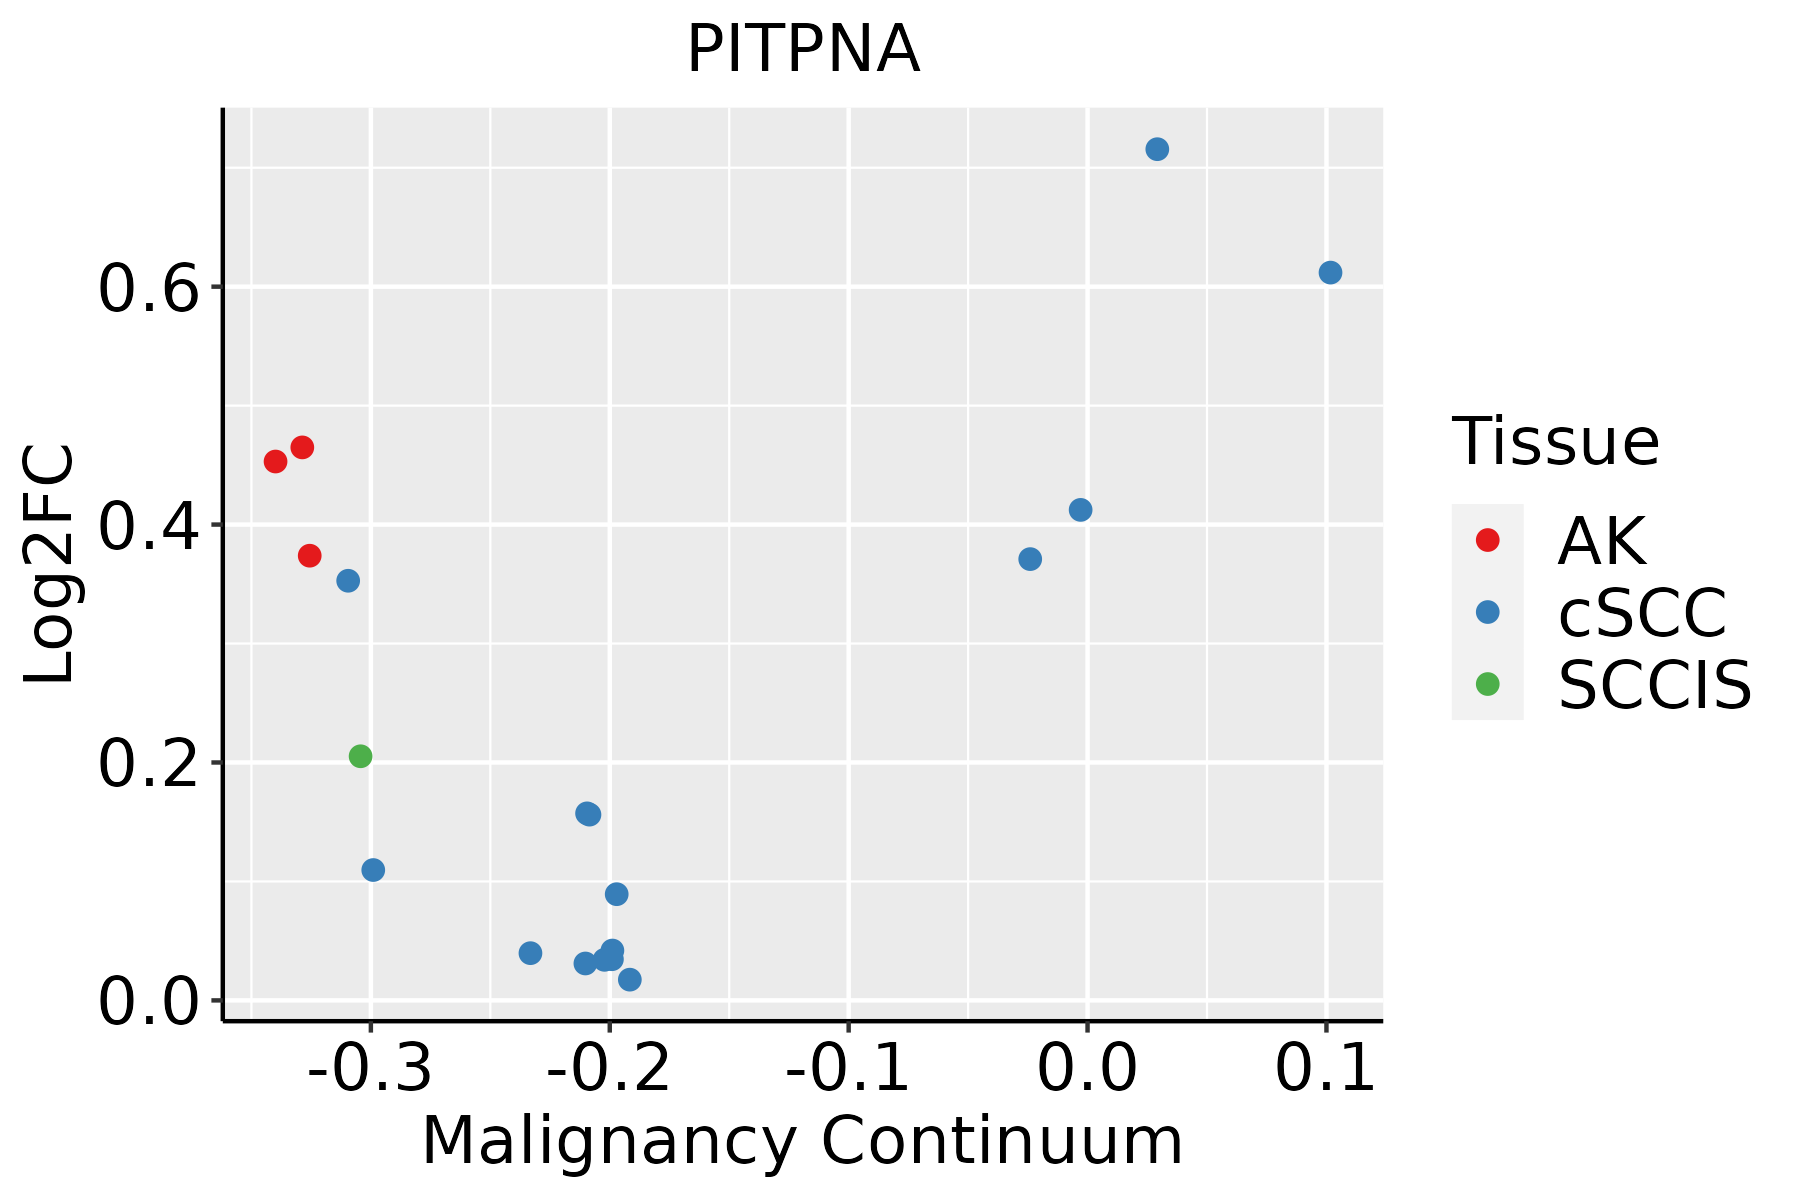 | AK: Actinic keratosis |
| cSCC: Cutaneous squamous cell carcinoma | ||
| SCCIS:squamous cell carcinoma in situ | ||
| Thyroid |  | ATC: Anaplastic thyroid cancer |
| HT: Hashimoto's thyroiditis | ||
| PTC: Papillary thyroid cancer |
| ∗log2FC in expression of this searched gene in stem-like cells from each diseased tissue sample relative to stem-like cells in normal samples in each tissue plotted against the malignancy continuum. Samples are colored based on if they are from different disease stage. |
Top |
Malignant transformation related pathway analysis |
| Find out the enriched GO biological processes and KEGG pathways involved in transition from healthy to precancer to cancer |
| Tissue | Disease Stage | Enriched GO biological Processes |
| Colorectum | AD |  |
| Colorectum | SER |  |
| Colorectum | MSS |  |
| Colorectum | MSI-H |  |
| Colorectum | FAP |  |
| ∗Top 15 enriched GO BP terms are showed in the bar plot of each disease state in each tissue. Each row represents a significant GO biological process which is colored according to the -log10(p.adjust). |
| Page: 1 2 3 4 5 6 7 8 9 |
| GO ID | Tissue | Disease Stage | Description | Gene Ratio | Bg Ratio | pvalue | p.adjust | Count |
| GO:0010876 | Colorectum | AD | lipid localization | 120/3918 | 448/18723 | 1.59e-03 | 1.33e-02 | 120 |
| GO:0006869 | Colorectum | AD | lipid transport | 108/3918 | 398/18723 | 1.67e-03 | 1.39e-02 | 108 |
| GO:0015748 | Colorectum | AD | organophosphate ester transport | 42/3918 | 140/18723 | 7.04e-03 | 4.31e-02 | 42 |
| GO:00068691 | Colorectum | FAP | lipid transport | 81/2622 | 398/18723 | 2.84e-04 | 3.76e-03 | 81 |
| GO:00108762 | Colorectum | FAP | lipid localization | 85/2622 | 448/18723 | 1.92e-03 | 1.63e-02 | 85 |
| GO:0015914 | Colorectum | FAP | phospholipid transport | 23/2622 | 96/18723 | 6.09e-03 | 3.82e-02 | 23 |
| GO:00068692 | Colorectum | CRC | lipid transport | 63/2078 | 398/18723 | 2.36e-03 | 2.26e-02 | 63 |
| GO:00108763 | Colorectum | CRC | lipid localization | 68/2078 | 448/18723 | 4.60e-03 | 3.58e-02 | 68 |
| GO:00157483 | Oral cavity | EOLP | organophosphate ester transport | 28/2218 | 140/18723 | 3.66e-03 | 2.05e-02 | 28 |
| GO:001574811 | Oral cavity | NEOLP | organophosphate ester transport | 25/2005 | 140/18723 | 7.16e-03 | 3.63e-02 | 25 |
| GO:01200094 | Skin | AK | intermembrane lipid transfer | 11/1910 | 48/18723 | 7.81e-03 | 3.96e-02 | 11 |
| Page: 1 |
| Pathway ID | Tissue | Disease Stage | Description | Gene Ratio | Bg Ratio | pvalue | p.adjust | qvalue | Count |
| Page: 1 |
Top |
Cell-cell communication analysis |
| Identification of potential cell-cell interactions between two cell types and their ligand-receptor pairs for different disease states |
| Ligand | Receptor | LRpair | Pathway | Tissue | Disease Stage |
| Page: 1 |
Top |
Single-cell gene regulatory network inference analysis |
| Find out the significant the regulons (TFs) and the target genes of each regulon across cell types for different disease states |
| TF | Cell Type | Tissue | Disease Stage | Target Gene | RSS | Regulon Activity |
| ∗The dot plots of a searched regulon are shown for all cell subpopulations in each disease state of each tissue based on the regulon specific score inferred using pySCENIC and by calculating the average expression. |
| Page: 1 |
Top |
Somatic mutation of malignant transformation related genes |
| Annotation of somatic variants for genes involved in malignant transformation |
| Hugo Symbol | Variant Class | Variant Classification | dbSNP RS | HGVSc | HGVSp | HGVSp Short | SWISSPROT | BIOTYPE | SIFT | PolyPhen | Tumor Sample Barcode | Tissue | Histology | Sex | Age | Stage | Therapy Types | Drugs | Outcome |
| PITPNA | SNV | Missense_Mutation | novel | c.374N>C | p.Val125Ala | p.V125A | Q00169 | protein_coding | tolerated(0.27) | probably_damaging(0.998) | TCGA-2W-A8YY-01 | Cervix | cervical & endocervical cancer | Female | <65 | I/II | Chemotherapy | cisplatin | CR |
| PITPNA | SNV | Missense_Mutation | c.183N>G | p.Ile61Met | p.I61M | Q00169 | protein_coding | deleterious(0) | probably_damaging(0.996) | TCGA-IR-A3LA-01 | Cervix | cervical & endocervical cancer | Female | <65 | I/II | Chemotherapy | cisplatin | CR | |
| PITPNA | SNV | Missense_Mutation | novel | c.239N>T | p.Ala80Val | p.A80V | Q00169 | protein_coding | deleterious(0) | benign(0.331) | TCGA-VS-A8QF-01 | Cervix | cervical & endocervical cancer | Female | <65 | I/II | Chemotherapy | cisplatin | CR |
| PITPNA | SNV | Missense_Mutation | rs369131097 | c.395C>T | p.Ala132Val | p.A132V | Q00169 | protein_coding | tolerated(0.22) | benign(0) | TCGA-AM-5821-01 | Colorectum | colon adenocarcinoma | Female | >=65 | I/II | Unknown | Unknown | SD |
| PITPNA | SNV | Missense_Mutation | rs201928722 | c.527N>G | p.Asn176Ser | p.N176S | Q00169 | protein_coding | tolerated(0.1) | benign(0.01) | TCGA-NH-A50T-01 | Colorectum | colon adenocarcinoma | Female | >=65 | I/II | Unknown | Unknown | SD |
| PITPNA | SNV | Missense_Mutation | novel | c.478N>A | p.Pro160Thr | p.P160T | Q00169 | protein_coding | deleterious(0.01) | benign(0.427) | TCGA-A5-A0G1-01 | Endometrium | uterine corpus endometrioid carcinoma | Female | >=65 | I/II | Unknown | Unknown | SD |
| PITPNA | SNV | Missense_Mutation | novel | c.23N>A | p.Arg8Gln | p.R8Q | Q00169 | protein_coding | deleterious(0.01) | possibly_damaging(0.793) | TCGA-A5-A0G2-01 | Endometrium | uterine corpus endometrioid carcinoma | Female | <65 | III/IV | Unknown | Unknown | SD |
| PITPNA | SNV | Missense_Mutation | novel | c.272N>G | p.Tyr91Cys | p.Y91C | Q00169 | protein_coding | deleterious(0) | probably_damaging(0.984) | TCGA-A5-A2K5-01 | Endometrium | uterine corpus endometrioid carcinoma | Female | >=65 | I/II | Unknown | Unknown | SD |
| PITPNA | SNV | Missense_Mutation | c.211N>C | p.Phe71Leu | p.F71L | Q00169 | protein_coding | tolerated(0.07) | benign(0.124) | TCGA-AP-A056-01 | Endometrium | uterine corpus endometrioid carcinoma | Female | <65 | I/II | Unknown | Unknown | SD | |
| PITPNA | SNV | Missense_Mutation | c.700A>G | p.Lys234Glu | p.K234E | Q00169 | protein_coding | tolerated(1) | benign(0.202) | TCGA-AX-A063-01 | Endometrium | uterine corpus endometrioid carcinoma | Female | <65 | I/II | Unknown | Unknown | SD |
| Page: 1 2 3 |
Top |
Related drugs of malignant transformation related genes |
| Identification of chemicals and drugs interact with genes involved in malignant transfromation |
| (DGIdb 4.0) |
| Entrez ID | Symbol | Category | Interaction Types | Drug Claim Name | Drug Name | PMIDs |
| Page: 1 |

Copyright 2023-Present -The University of Texas Health Science Center at Houston |