
|
|||||
|
 | |
| |
| |
| |
| |
| |
|
Gene: PITHD1 |
Gene summary for PITHD1 |
| Gene information | Species | Human | Gene symbol | PITHD1 | Gene ID | 57095 |
| Gene name | PITH domain containing 1 | |
| Gene Alias | C1orf128 | |
| Cytomap | 1p36.11 | |
| Gene Type | protein-coding | GO ID | GO:0000003 | UniProtAcc | Q9GZP4 |
Top |
Malignant transformation analysis |
| Identification of the aberrant gene expression in precancerous and cancerous lesions by comparing the gene expression of stem-like cells in diseased tissues with normal stem cells |
| Entrez ID | Symbol | Replicates | Species | Organ | Tissue | Adj P-value | Log2FC | Malignancy |
| 57095 | PITHD1 | LZE4T | Human | Esophagus | ESCC | 1.15e-14 | 2.45e-01 | 0.0811 |
| 57095 | PITHD1 | LZE5T | Human | Esophagus | ESCC | 1.11e-03 | 4.33e-02 | 0.0514 |
| 57095 | PITHD1 | LZE8T | Human | Esophagus | ESCC | 1.98e-02 | -1.27e-01 | 0.067 |
| 57095 | PITHD1 | LZE20T | Human | Esophagus | ESCC | 2.16e-11 | 4.52e-01 | 0.0662 |
| 57095 | PITHD1 | LZE22D1 | Human | Esophagus | HGIN | 1.73e-04 | 1.06e-01 | 0.0595 |
| 57095 | PITHD1 | LZE24T | Human | Esophagus | ESCC | 1.29e-28 | 7.63e-01 | 0.0596 |
| 57095 | PITHD1 | P1T-E | Human | Esophagus | ESCC | 1.51e-06 | 6.01e-01 | 0.0875 |
| 57095 | PITHD1 | P2T-E | Human | Esophagus | ESCC | 1.09e-44 | 9.23e-01 | 0.1177 |
| 57095 | PITHD1 | P4T-E | Human | Esophagus | ESCC | 9.47e-32 | 8.40e-01 | 0.1323 |
| 57095 | PITHD1 | P5T-E | Human | Esophagus | ESCC | 1.07e-11 | 2.73e-01 | 0.1327 |
| 57095 | PITHD1 | P8T-E | Human | Esophagus | ESCC | 2.56e-26 | 5.85e-01 | 0.0889 |
| 57095 | PITHD1 | P9T-E | Human | Esophagus | ESCC | 3.38e-09 | 2.74e-01 | 0.1131 |
| 57095 | PITHD1 | P10T-E | Human | Esophagus | ESCC | 3.92e-53 | 9.76e-01 | 0.116 |
| 57095 | PITHD1 | P11T-E | Human | Esophagus | ESCC | 1.24e-14 | 8.14e-01 | 0.1426 |
| 57095 | PITHD1 | P12T-E | Human | Esophagus | ESCC | 1.56e-33 | 6.81e-01 | 0.1122 |
| 57095 | PITHD1 | P15T-E | Human | Esophagus | ESCC | 2.70e-35 | 7.89e-01 | 0.1149 |
| 57095 | PITHD1 | P16T-E | Human | Esophagus | ESCC | 1.54e-26 | 4.64e-01 | 0.1153 |
| 57095 | PITHD1 | P17T-E | Human | Esophagus | ESCC | 3.92e-07 | 4.89e-01 | 0.1278 |
| 57095 | PITHD1 | P19T-E | Human | Esophagus | ESCC | 1.28e-06 | 1.06e+00 | 0.1662 |
| 57095 | PITHD1 | P20T-E | Human | Esophagus | ESCC | 6.64e-34 | 8.32e-01 | 0.1124 |
| Page: 1 2 3 4 5 6 |
| Tissue | Expression Dynamics | Abbreviation |
| Esophagus | 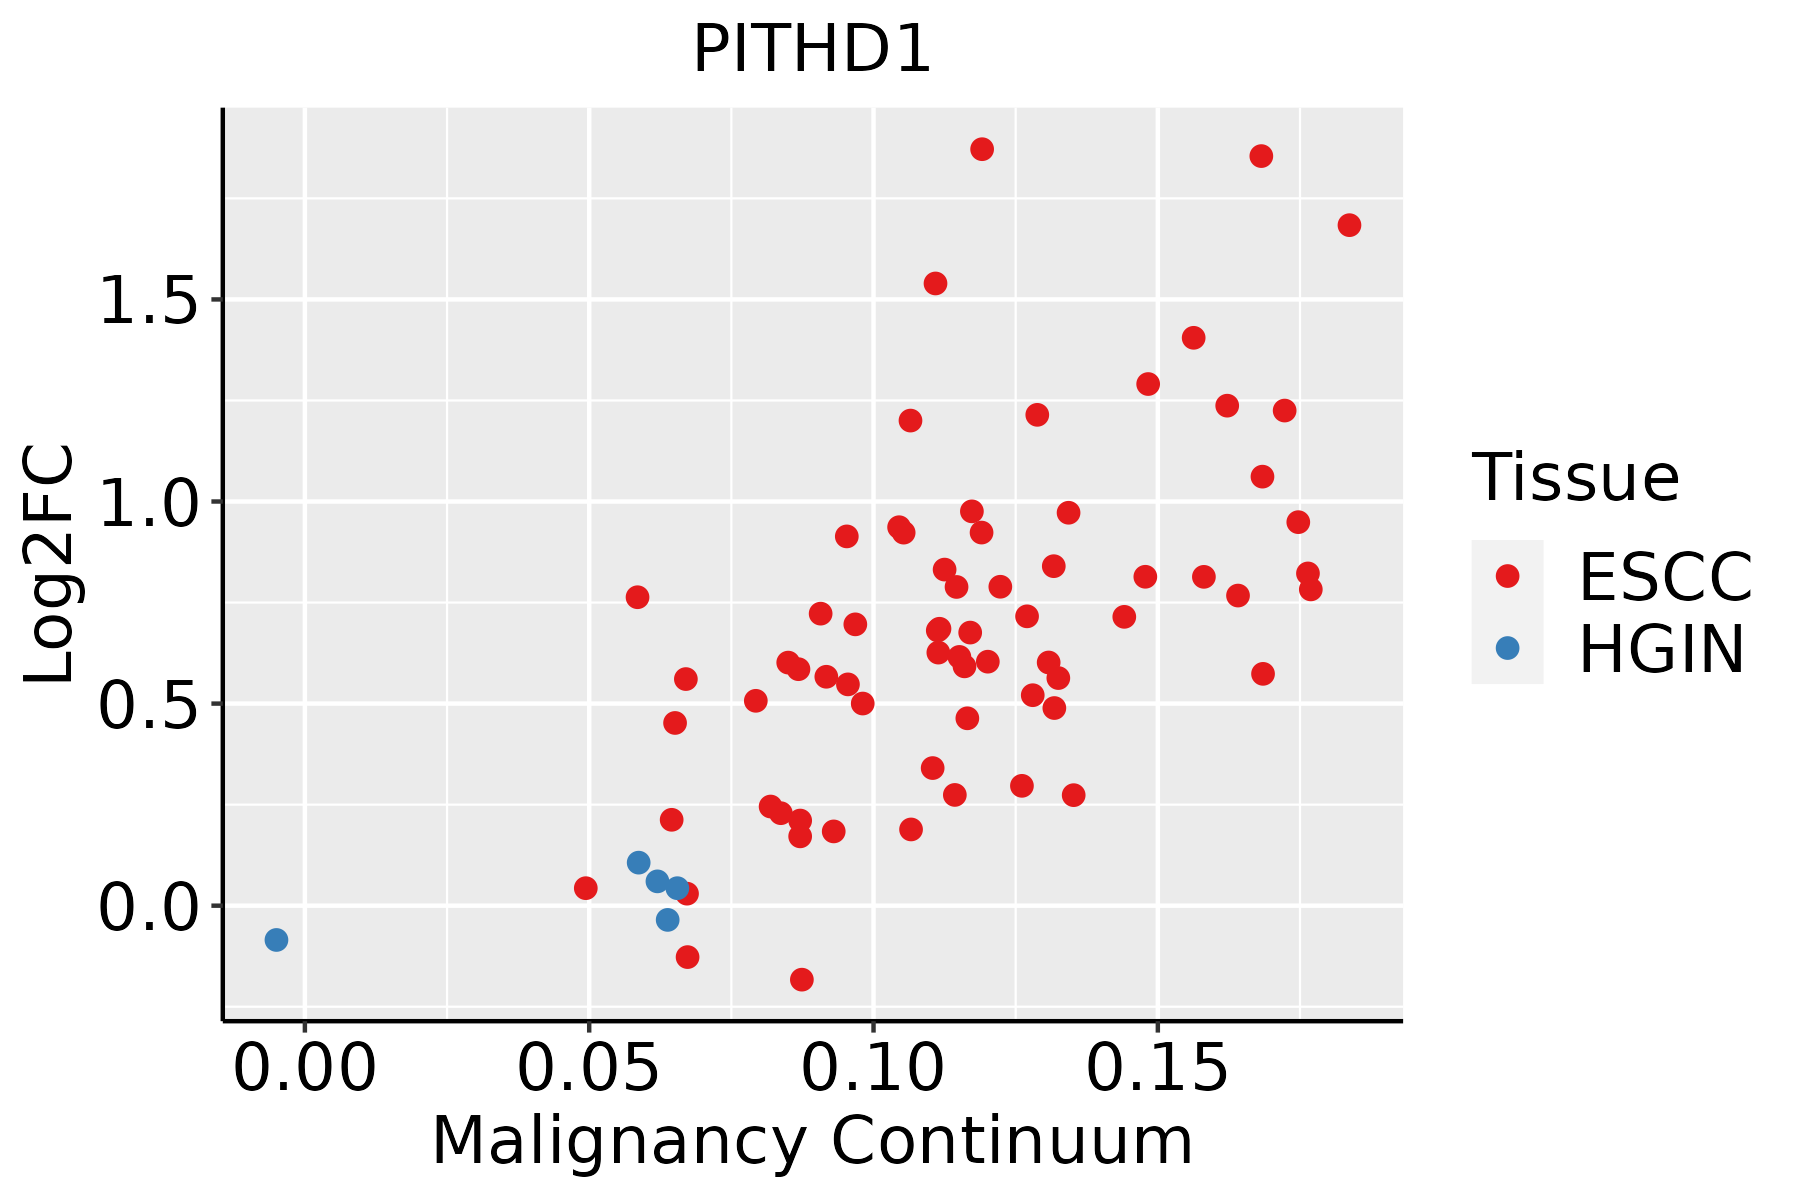 | ESCC: Esophageal squamous cell carcinoma |
| HGIN: High-grade intraepithelial neoplasias | ||
| LGIN: Low-grade intraepithelial neoplasias | ||
| Liver | 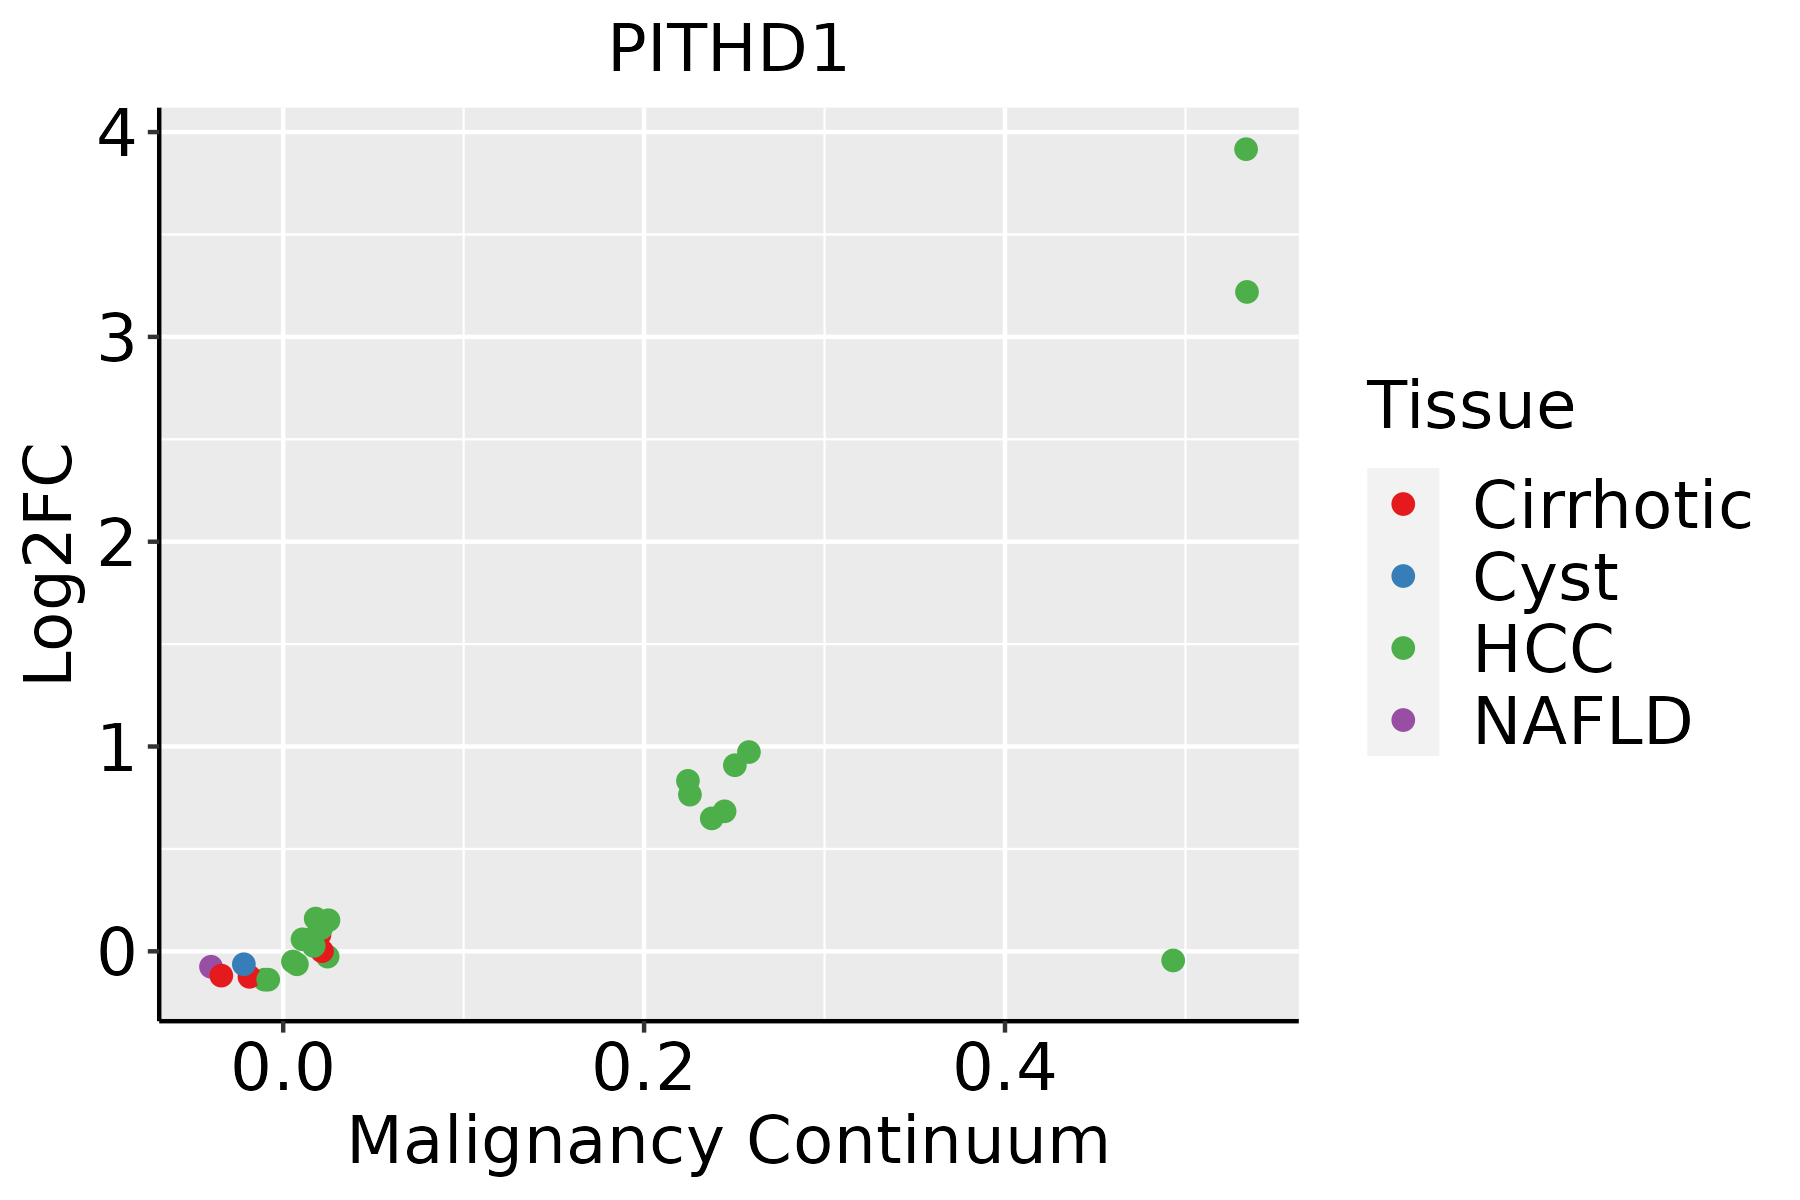 | HCC: Hepatocellular carcinoma |
| NAFLD: Non-alcoholic fatty liver disease | ||
| Oral Cavity | 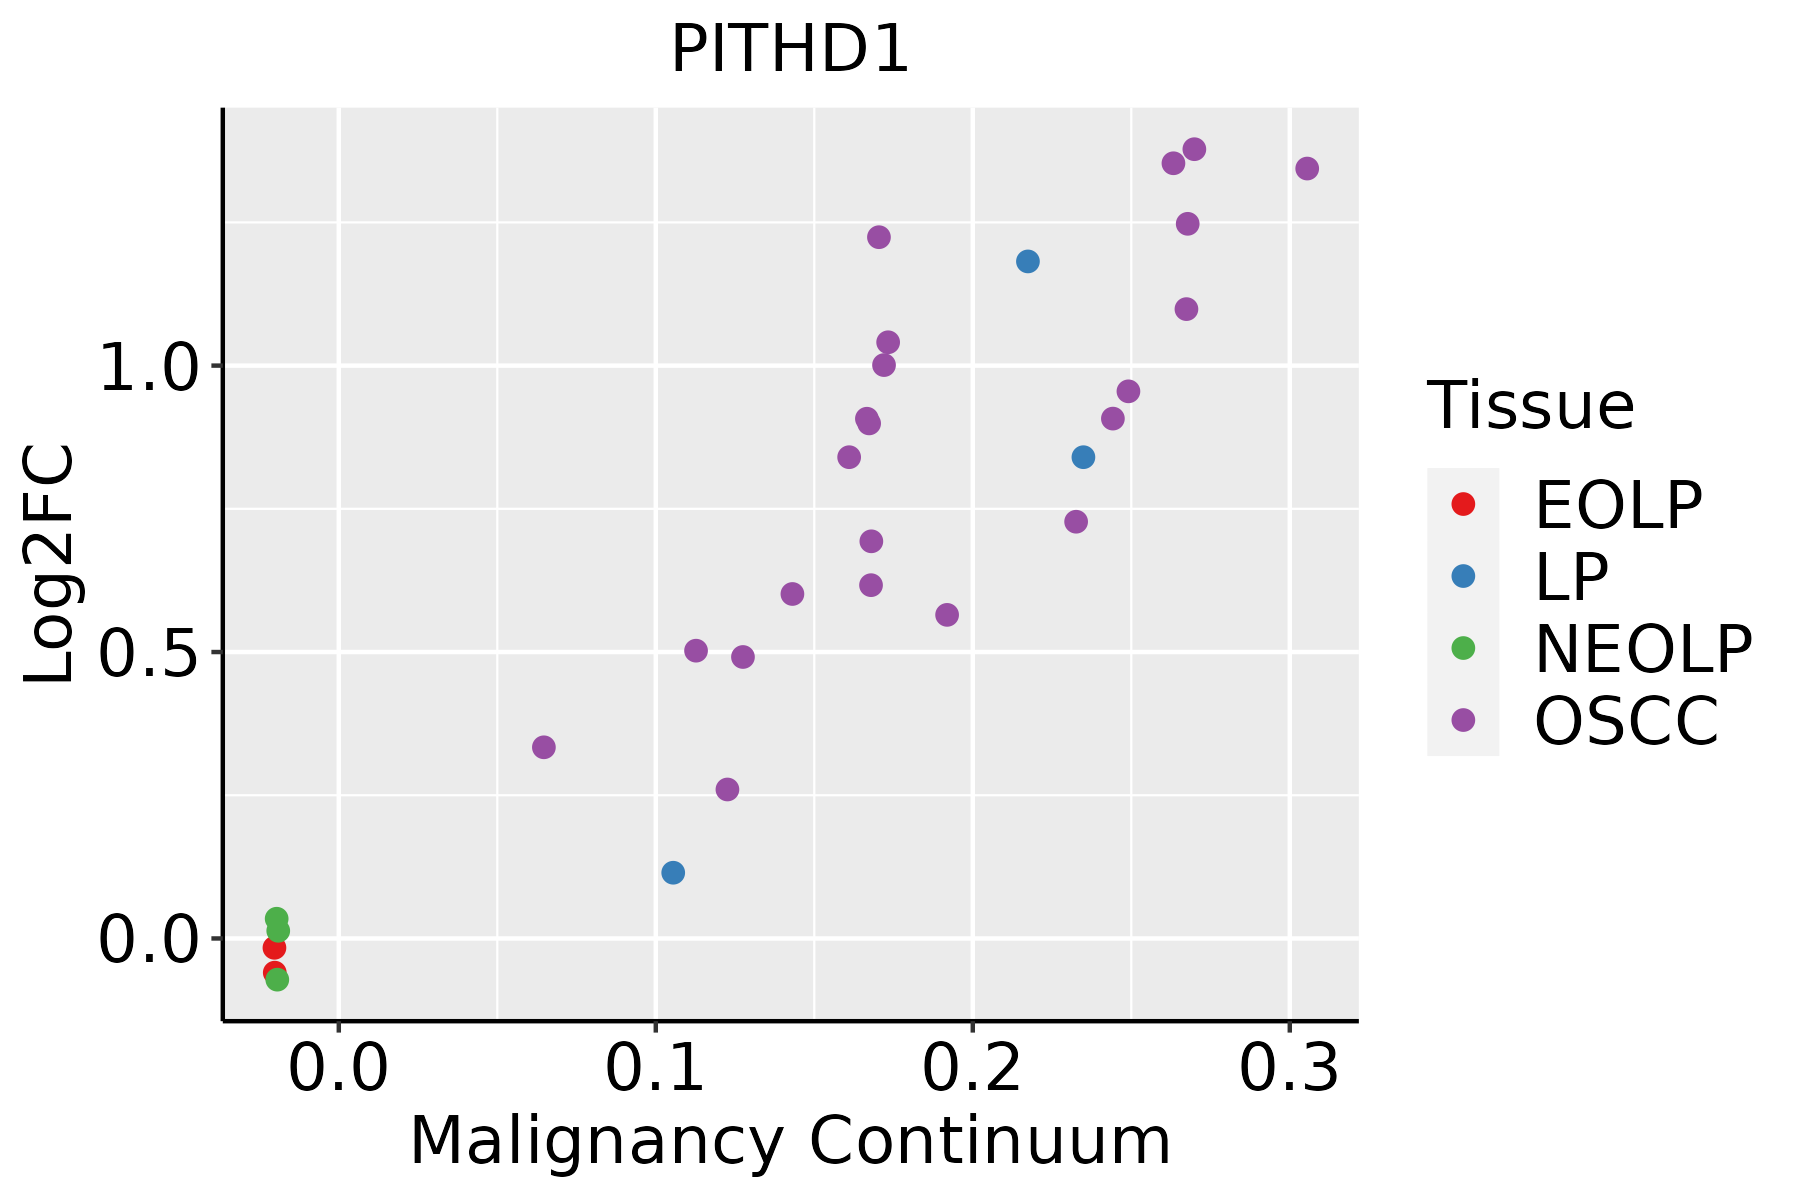 | EOLP: Erosive Oral lichen planus |
| LP: leukoplakia | ||
| NEOLP: Non-erosive oral lichen planus | ||
| OSCC: Oral squamous cell carcinoma | ||
| Prostate | 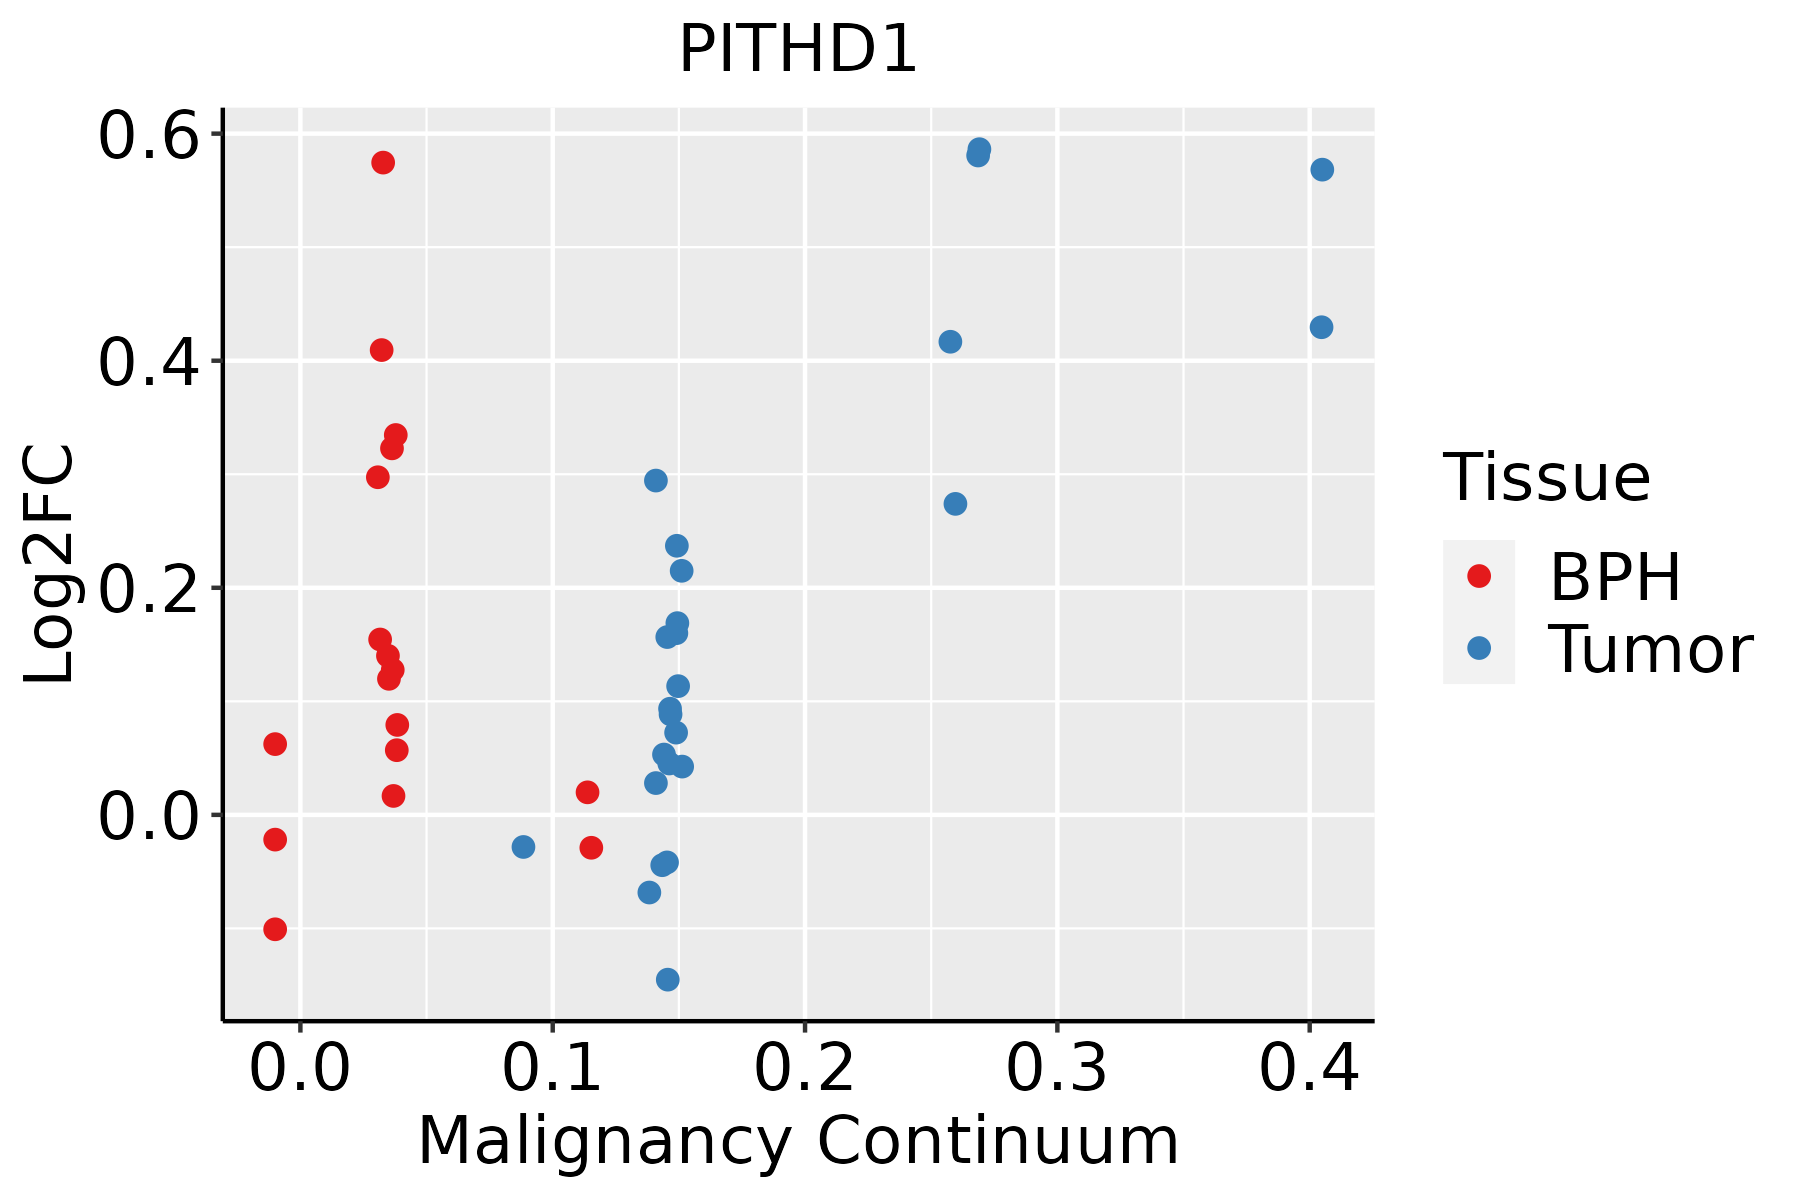 | BPH: Benign Prostatic Hyperplasia |
| Skin |  | AK: Actinic keratosis |
| cSCC: Cutaneous squamous cell carcinoma | ||
| SCCIS:squamous cell carcinoma in situ | ||
| Thyroid |  | ATC: Anaplastic thyroid cancer |
| HT: Hashimoto's thyroiditis | ||
| PTC: Papillary thyroid cancer |
| ∗log2FC in expression of this searched gene in stem-like cells from each diseased tissue sample relative to stem-like cells in normal samples in each tissue plotted against the malignancy continuum. Samples are colored based on if they are from different disease stage. |
Top |
Malignant transformation related pathway analysis |
| Find out the enriched GO biological processes and KEGG pathways involved in transition from healthy to precancer to cancer |
| Tissue | Disease Stage | Enriched GO biological Processes |
| Colorectum | AD |  |
| Colorectum | SER |  |
| Colorectum | MSS |  |
| Colorectum | MSI-H |  |
| Colorectum | FAP |  |
| ∗Top 15 enriched GO BP terms are showed in the bar plot of each disease state in each tissue. Each row represents a significant GO biological process which is colored according to the -log10(p.adjust). |
| Page: 1 2 3 4 5 6 7 8 9 |
| GO ID | Tissue | Disease Stage | Description | Gene Ratio | Bg Ratio | pvalue | p.adjust | Count |
| GO:004217627 | Esophagus | HGIN | regulation of protein catabolic process | 119/2587 | 391/18723 | 8.09e-18 | 2.43e-15 | 119 |
| GO:001049826 | Esophagus | HGIN | proteasomal protein catabolic process | 139/2587 | 490/18723 | 1.20e-17 | 3.41e-15 | 139 |
| GO:190336227 | Esophagus | HGIN | regulation of cellular protein catabolic process | 81/2587 | 255/18723 | 1.16e-13 | 1.93e-11 | 81 |
| GO:190305027 | Esophagus | HGIN | regulation of proteolysis involved in cellular protein catabolic process | 70/2587 | 221/18723 | 6.21e-12 | 7.76e-10 | 70 |
| GO:006113627 | Esophagus | HGIN | regulation of proteasomal protein catabolic process | 60/2587 | 187/18723 | 1.10e-10 | 1.12e-08 | 60 |
| GO:003009927 | Esophagus | HGIN | myeloid cell differentiation | 83/2587 | 381/18723 | 1.26e-05 | 3.52e-04 | 83 |
| GO:004563725 | Esophagus | HGIN | regulation of myeloid cell differentiation | 49/2587 | 210/18723 | 1.28e-04 | 2.61e-03 | 49 |
| GO:004563917 | Esophagus | HGIN | positive regulation of myeloid cell differentiation | 26/2587 | 103/18723 | 1.40e-03 | 1.63e-02 | 26 |
| GO:190370620 | Esophagus | HGIN | regulation of hemopoiesis | 69/2587 | 367/18723 | 4.39e-03 | 3.86e-02 | 69 |
| GO:0010498111 | Esophagus | ESCC | proteasomal protein catabolic process | 369/8552 | 490/18723 | 1.13e-41 | 1.80e-38 | 369 |
| GO:0042176111 | Esophagus | ESCC | regulation of protein catabolic process | 280/8552 | 391/18723 | 8.65e-26 | 2.39e-23 | 280 |
| GO:1903362111 | Esophagus | ESCC | regulation of cellular protein catabolic process | 188/8552 | 255/18723 | 5.12e-20 | 6.62e-18 | 188 |
| GO:1903050111 | Esophagus | ESCC | regulation of proteolysis involved in cellular protein catabolic process | 163/8552 | 221/18723 | 1.44e-17 | 1.27e-15 | 163 |
| GO:0061136111 | Esophagus | ESCC | regulation of proteasomal protein catabolic process | 142/8552 | 187/18723 | 2.40e-17 | 2.00e-15 | 142 |
| GO:0030099111 | Esophagus | ESCC | myeloid cell differentiation | 232/8552 | 381/18723 | 1.22e-09 | 2.90e-08 | 232 |
| GO:1903706110 | Esophagus | ESCC | regulation of hemopoiesis | 201/8552 | 367/18723 | 2.60e-04 | 1.58e-03 | 201 |
| GO:004563918 | Esophagus | ESCC | positive regulation of myeloid cell differentiation | 64/8552 | 103/18723 | 5.54e-04 | 3.03e-03 | 64 |
| GO:0045637111 | Esophagus | ESCC | regulation of myeloid cell differentiation | 118/8552 | 210/18723 | 1.35e-03 | 6.43e-03 | 118 |
| GO:001049812 | Liver | Cirrhotic | proteasomal protein catabolic process | 216/4634 | 490/18723 | 2.52e-21 | 9.29e-19 | 216 |
| GO:004217612 | Liver | Cirrhotic | regulation of protein catabolic process | 181/4634 | 391/18723 | 7.94e-21 | 2.77e-18 | 181 |
| Page: 1 2 3 4 5 |
| Pathway ID | Tissue | Disease Stage | Description | Gene Ratio | Bg Ratio | pvalue | p.adjust | qvalue | Count |
| Page: 1 |
Top |
Cell-cell communication analysis |
| Identification of potential cell-cell interactions between two cell types and their ligand-receptor pairs for different disease states |
| Ligand | Receptor | LRpair | Pathway | Tissue | Disease Stage |
| Page: 1 |
Top |
Single-cell gene regulatory network inference analysis |
| Find out the significant the regulons (TFs) and the target genes of each regulon across cell types for different disease states |
| TF | Cell Type | Tissue | Disease Stage | Target Gene | RSS | Regulon Activity |
| ∗The dot plots of a searched regulon are shown for all cell subpopulations in each disease state of each tissue based on the regulon specific score inferred using pySCENIC and by calculating the average expression. |
| Page: 1 |
Top |
Somatic mutation of malignant transformation related genes |
| Annotation of somatic variants for genes involved in malignant transformation |
| Hugo Symbol | Variant Class | Variant Classification | dbSNP RS | HGVSc | HGVSp | HGVSp Short | SWISSPROT | BIOTYPE | SIFT | PolyPhen | Tumor Sample Barcode | Tissue | Histology | Sex | Age | Stage | Therapy Types | Drugs | Outcome |
| PITHD1 | SNV | Missense_Mutation | c.547G>A | p.Glu183Lys | p.E183K | Q9GZP4 | protein_coding | tolerated(0.23) | benign(0.034) | TCGA-EK-A2PG-01 | Cervix | cervical & endocervical cancer | Female | >=65 | I/II | Unknown | Unknown | SD | |
| PITHD1 | SNV | Missense_Mutation | c.247N>G | p.Thr83Ala | p.T83A | Q9GZP4 | protein_coding | deleterious(0.02) | probably_damaging(0.93) | TCGA-A6-6780-01 | Colorectum | colon adenocarcinoma | Male | >=65 | I/II | Unknown | Unknown | SD | |
| PITHD1 | SNV | Missense_Mutation | rs763501501 | c.491C>T | p.Thr164Met | p.T164M | Q9GZP4 | protein_coding | deleterious(0.04) | possibly_damaging(0.9) | TCGA-AA-3977-01 | Colorectum | colon adenocarcinoma | Male | >=65 | I/II | Unknown | Unknown | SD |
| PITHD1 | SNV | Missense_Mutation | novel | c.347N>G | p.Phe116Cys | p.F116C | Q9GZP4 | protein_coding | deleterious(0) | probably_damaging(1) | TCGA-AA-3984-01 | Colorectum | colon adenocarcinoma | Female | <65 | I/II | Unknown | Unknown | SD |
| PITHD1 | SNV | Missense_Mutation | novel | c.211G>T | p.Asp71Tyr | p.D71Y | Q9GZP4 | protein_coding | deleterious(0) | probably_damaging(0.994) | TCGA-AZ-4315-01 | Colorectum | colon adenocarcinoma | Male | <65 | I/II | Unknown | Unknown | SD |
| PITHD1 | SNV | Missense_Mutation | c.253N>G | p.Asn85Asp | p.N85D | Q9GZP4 | protein_coding | tolerated(0.09) | benign(0.081) | TCGA-NH-A5IV-01 | Colorectum | colon adenocarcinoma | Female | >=65 | I/II | Unknown | Unknown | SD | |
| PITHD1 | SNV | Missense_Mutation | c.454N>A | p.Leu152Ile | p.L152I | Q9GZP4 | protein_coding | deleterious(0.03) | probably_damaging(1) | TCGA-D1-A103-01 | Endometrium | uterine corpus endometrioid carcinoma | Female | >=65 | I/II | Unknown | Unknown | SD | |
| PITHD1 | SNV | Missense_Mutation | rs757948298 | c.434N>A | p.Arg145His | p.R145H | Q9GZP4 | protein_coding | deleterious(0.05) | probably_damaging(0.978) | TCGA-E6-A1LX-01 | Endometrium | uterine corpus endometrioid carcinoma | Female | <65 | I/II | Unknown | Unknown | SD |
| PITHD1 | SNV | Missense_Mutation | c.542N>A | p.Arg181Gln | p.R181Q | Q9GZP4 | protein_coding | tolerated(0.09) | benign(0.133) | TCGA-EO-A22R-01 | Endometrium | uterine corpus endometrioid carcinoma | Female | <65 | I/II | Unknown | Unknown | SD | |
| PITHD1 | SNV | Missense_Mutation | rs763501501 | c.491C>T | p.Thr164Met | p.T164M | Q9GZP4 | protein_coding | deleterious(0.04) | possibly_damaging(0.9) | TCGA-FI-A2D0-01 | Endometrium | uterine corpus endometrioid carcinoma | Female | <65 | I/II | Unknown | Unknown | SD |
| Page: 1 2 |
Top |
Related drugs of malignant transformation related genes |
| Identification of chemicals and drugs interact with genes involved in malignant transfromation |
| (DGIdb 4.0) |
| Entrez ID | Symbol | Category | Interaction Types | Drug Claim Name | Drug Name | PMIDs |
| Page: 1 |

Copyright 2023-Present -The University of Texas Health Science Center at Houston |