
|
|||||
|
 | |
| |
| |
| |
| |
| |
|
Gene: PIR |
Gene summary for PIR |
| Gene information | Species | Human | Gene symbol | PIR | Gene ID | 8544 |
| Gene name | pirin | |
| Gene Alias | PIR | |
| Cytomap | Xp22.2 | |
| Gene Type | protein-coding | GO ID | GO:0002376 | UniProtAcc | A0A024RBX6 |
Top |
Malignant transformation analysis |
| Identification of the aberrant gene expression in precancerous and cancerous lesions by comparing the gene expression of stem-like cells in diseased tissues with normal stem cells |
| Entrez ID | Symbol | Replicates | Species | Organ | Tissue | Adj P-value | Log2FC | Malignancy |
| 8544 | PIR | LZE2T | Human | Esophagus | ESCC | 1.97e-07 | 1.01e+00 | 0.082 |
| 8544 | PIR | LZE4T | Human | Esophagus | ESCC | 3.27e-38 | 1.53e+00 | 0.0811 |
| 8544 | PIR | LZE7T | Human | Esophagus | ESCC | 2.64e-11 | 7.92e-01 | 0.0667 |
| 8544 | PIR | LZE8T | Human | Esophagus | ESCC | 9.11e-14 | 5.65e-01 | 0.067 |
| 8544 | PIR | LZE20T | Human | Esophagus | ESCC | 4.09e-11 | 4.20e-01 | 0.0662 |
| 8544 | PIR | LZE22T | Human | Esophagus | ESCC | 6.35e-08 | 7.24e-01 | 0.068 |
| 8544 | PIR | LZE24T | Human | Esophagus | ESCC | 2.43e-09 | 2.26e-01 | 0.0596 |
| 8544 | PIR | LZE21T | Human | Esophagus | ESCC | 4.06e-10 | 9.19e-01 | 0.0655 |
| 8544 | PIR | LZE6T | Human | Esophagus | ESCC | 2.33e-03 | 3.98e-01 | 0.0845 |
| 8544 | PIR | P2T-E | Human | Esophagus | ESCC | 5.40e-38 | 7.92e-01 | 0.1177 |
| 8544 | PIR | P4T-E | Human | Esophagus | ESCC | 2.15e-37 | 1.07e+00 | 0.1323 |
| 8544 | PIR | P5T-E | Human | Esophagus | ESCC | 5.38e-21 | 4.67e-01 | 0.1327 |
| 8544 | PIR | P8T-E | Human | Esophagus | ESCC | 9.93e-24 | 4.22e-01 | 0.0889 |
| 8544 | PIR | P9T-E | Human | Esophagus | ESCC | 1.05e-39 | 1.03e+00 | 0.1131 |
| 8544 | PIR | P10T-E | Human | Esophagus | ESCC | 9.57e-30 | 4.92e-01 | 0.116 |
| 8544 | PIR | P11T-E | Human | Esophagus | ESCC | 1.25e-06 | 4.85e-01 | 0.1426 |
| 8544 | PIR | P12T-E | Human | Esophagus | ESCC | 9.99e-35 | 6.27e-01 | 0.1122 |
| 8544 | PIR | P15T-E | Human | Esophagus | ESCC | 3.44e-71 | 1.75e+00 | 0.1149 |
| 8544 | PIR | P16T-E | Human | Esophagus | ESCC | 2.24e-16 | 3.05e-01 | 0.1153 |
| 8544 | PIR | P19T-E | Human | Esophagus | ESCC | 8.88e-07 | 7.60e-01 | 0.1662 |
| Page: 1 2 3 4 5 |
| Tissue | Expression Dynamics | Abbreviation |
| Esophagus | 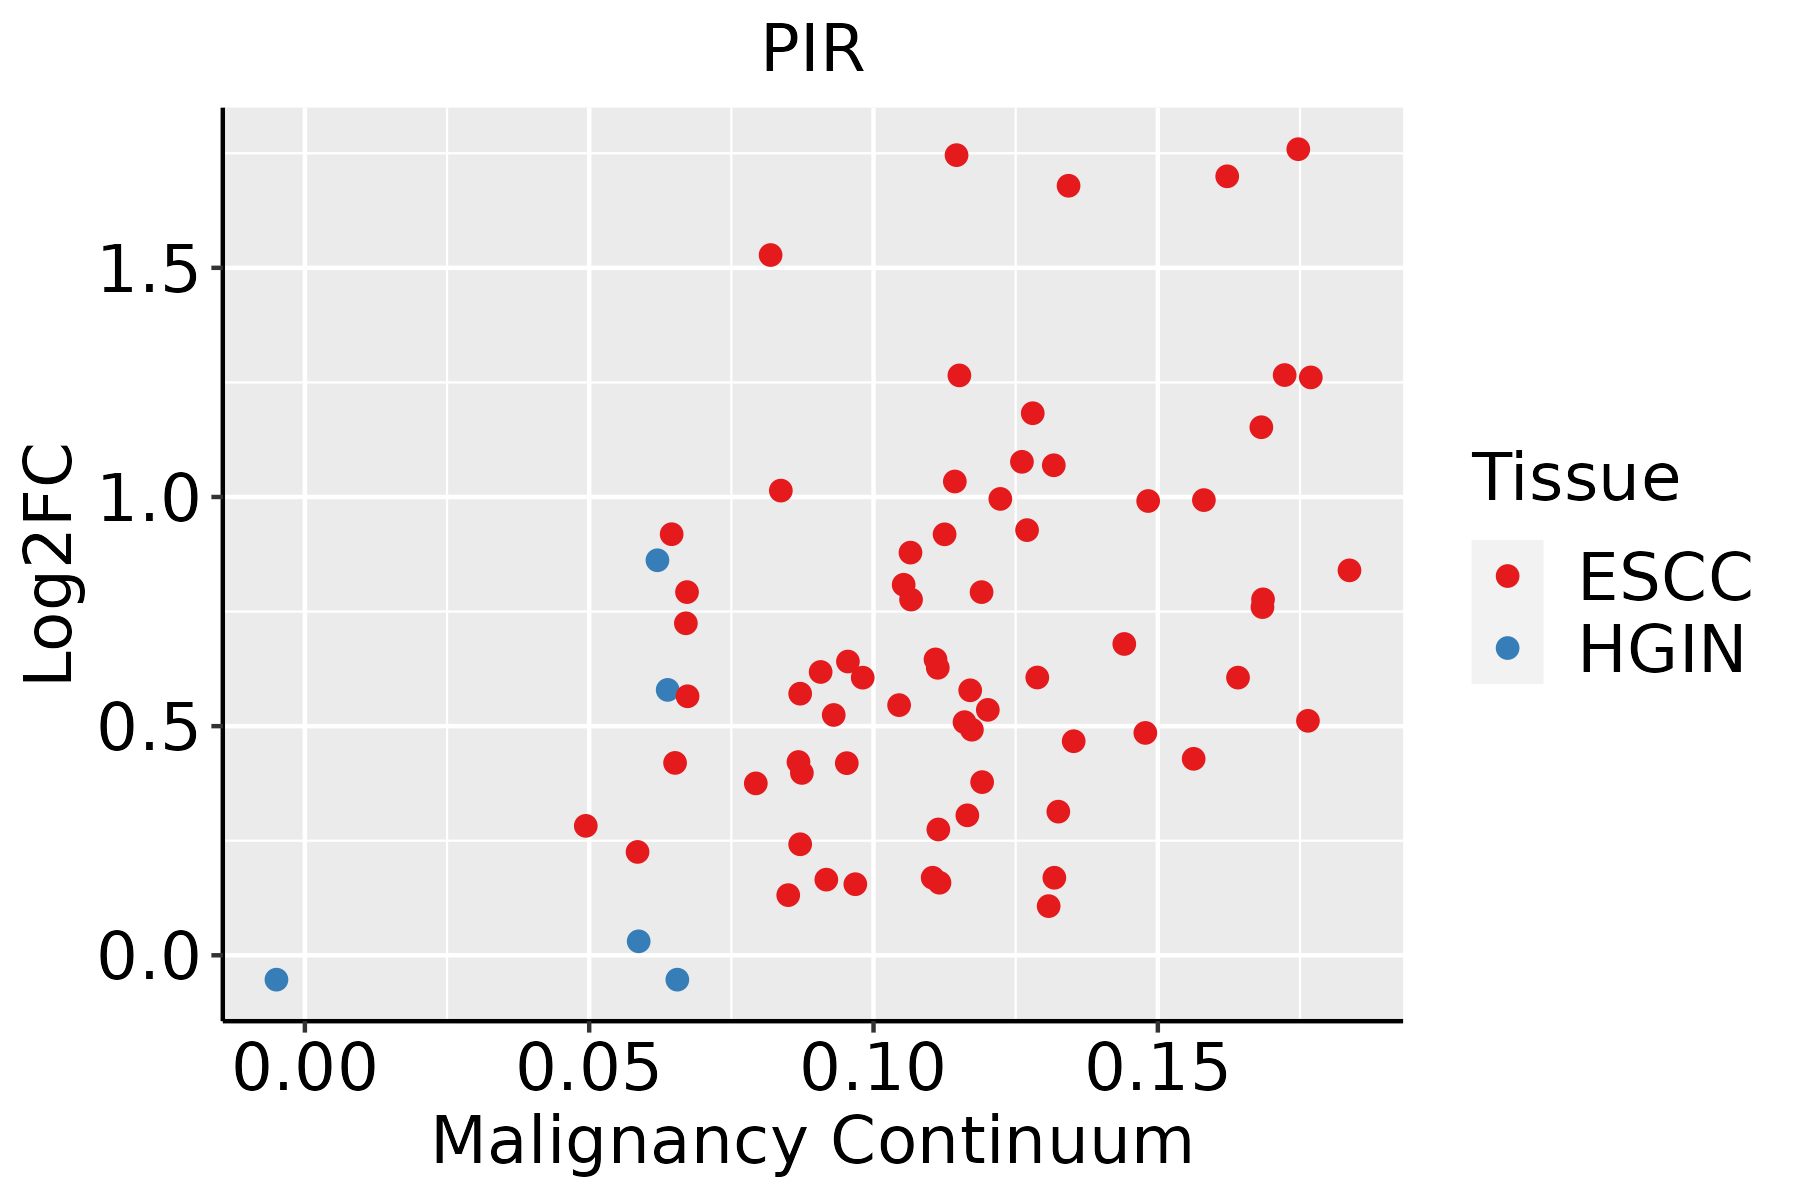 | ESCC: Esophageal squamous cell carcinoma |
| HGIN: High-grade intraepithelial neoplasias | ||
| LGIN: Low-grade intraepithelial neoplasias | ||
| Liver |  | HCC: Hepatocellular carcinoma |
| NAFLD: Non-alcoholic fatty liver disease | ||
| Oral Cavity |  | EOLP: Erosive Oral lichen planus |
| LP: leukoplakia | ||
| NEOLP: Non-erosive oral lichen planus | ||
| OSCC: Oral squamous cell carcinoma |
| ∗log2FC in expression of this searched gene in stem-like cells from each diseased tissue sample relative to stem-like cells in normal samples in each tissue plotted against the malignancy continuum. Samples are colored based on if they are from different disease stage. |
Top |
Malignant transformation related pathway analysis |
| Find out the enriched GO biological processes and KEGG pathways involved in transition from healthy to precancer to cancer |
| Tissue | Disease Stage | Enriched GO biological Processes |
| Colorectum | AD |  |
| Colorectum | SER |  |
| Colorectum | MSS |  |
| Colorectum | MSI-H |  |
| Colorectum | FAP |  |
| ∗Top 15 enriched GO BP terms are showed in the bar plot of each disease state in each tissue. Each row represents a significant GO biological process which is colored according to the -log10(p.adjust). |
| Page: 1 2 3 4 5 6 7 8 9 |
| GO ID | Tissue | Disease Stage | Description | Gene Ratio | Bg Ratio | pvalue | p.adjust | Count |
| GO:004819318 | Esophagus | ESCC | Golgi vesicle transport | 231/8552 | 296/18723 | 1.82e-30 | 9.63e-28 | 231 |
| GO:005165617 | Esophagus | ESCC | establishment of organelle localization | 273/8552 | 390/18723 | 9.13e-23 | 1.81e-20 | 273 |
| GO:0043254111 | Esophagus | ESCC | regulation of protein-containing complex assembly | 278/8552 | 428/18723 | 3.81e-16 | 2.77e-14 | 278 |
| GO:0031334111 | Esophagus | ESCC | positive regulation of protein-containing complex assembly | 166/8552 | 237/18723 | 2.06e-14 | 1.07e-12 | 166 |
| GO:005105215 | Esophagus | ESCC | regulation of DNA metabolic process | 232/8552 | 359/18723 | 2.40e-13 | 1.13e-11 | 232 |
| GO:00482853 | Esophagus | ESCC | organelle fission | 301/8552 | 488/18723 | 4.64e-13 | 2.12e-11 | 301 |
| GO:0010821110 | Esophagus | ESCC | regulation of mitochondrion organization | 107/8552 | 144/18723 | 2.31e-12 | 9.41e-11 | 107 |
| GO:00002802 | Esophagus | ESCC | nuclear division | 270/8552 | 439/18723 | 1.17e-11 | 4.24e-10 | 270 |
| GO:005105417 | Esophagus | ESCC | positive regulation of DNA metabolic process | 139/8552 | 201/18723 | 1.20e-11 | 4.33e-10 | 139 |
| GO:1902905111 | Esophagus | ESCC | positive regulation of supramolecular fiber organization | 142/8552 | 209/18723 | 5.51e-11 | 1.76e-09 | 142 |
| GO:1902903111 | Esophagus | ESCC | regulation of supramolecular fiber organization | 237/8552 | 383/18723 | 9.06e-11 | 2.75e-09 | 237 |
| GO:2001020110 | Esophagus | ESCC | regulation of response to DNA damage stimulus | 145/8552 | 219/18723 | 5.97e-10 | 1.50e-08 | 145 |
| GO:0030099111 | Esophagus | ESCC | myeloid cell differentiation | 232/8552 | 381/18723 | 1.22e-09 | 2.90e-08 | 232 |
| GO:005149520 | Esophagus | ESCC | positive regulation of cytoskeleton organization | 147/8552 | 226/18723 | 2.93e-09 | 6.38e-08 | 147 |
| GO:001082215 | Esophagus | ESCC | positive regulation of mitochondrion organization | 58/8552 | 74/18723 | 8.55e-09 | 1.73e-07 | 58 |
| GO:003250614 | Esophagus | ESCC | cytokinetic process | 35/8552 | 39/18723 | 9.38e-09 | 1.90e-07 | 35 |
| GO:0051258111 | Esophagus | ESCC | protein polymerization | 183/8552 | 297/18723 | 1.94e-08 | 3.75e-07 | 183 |
| GO:000701527 | Esophagus | ESCC | actin filament organization | 259/8552 | 442/18723 | 2.37e-08 | 4.50e-07 | 259 |
| GO:000091016 | Esophagus | ESCC | cytokinesis | 115/8552 | 173/18723 | 2.48e-08 | 4.68e-07 | 115 |
| GO:0032273111 | Esophagus | ESCC | positive regulation of protein polymerization | 95/8552 | 138/18723 | 2.97e-08 | 5.57e-07 | 95 |
| Page: 1 2 3 4 5 6 7 8 9 10 11 12 13 14 15 |
| Pathway ID | Tissue | Disease Stage | Description | Gene Ratio | Bg Ratio | pvalue | p.adjust | qvalue | Count |
| Page: 1 |
Top |
Cell-cell communication analysis |
| Identification of potential cell-cell interactions between two cell types and their ligand-receptor pairs for different disease states |
| Ligand | Receptor | LRpair | Pathway | Tissue | Disease Stage |
| Page: 1 |
Top |
Single-cell gene regulatory network inference analysis |
| Find out the significant the regulons (TFs) and the target genes of each regulon across cell types for different disease states |
| TF | Cell Type | Tissue | Disease Stage | Target Gene | RSS | Regulon Activity |
| PIR | DPC | Skin | ADJ | NAA25,PCAT1,FZD8, etc. | 1.26e-01 |  |
| ∗The dot plots of a searched regulon are shown for all cell subpopulations in each disease state of each tissue based on the regulon specific score inferred using pySCENIC and by calculating the average expression. |
| Page: 1 |
Top |
Somatic mutation of malignant transformation related genes |
| Annotation of somatic variants for genes involved in malignant transformation |
| Hugo Symbol | Variant Class | Variant Classification | dbSNP RS | HGVSc | HGVSp | HGVSp Short | SWISSPROT | BIOTYPE | SIFT | PolyPhen | Tumor Sample Barcode | Tissue | Histology | Sex | Age | Stage | Therapy Types | Drugs | Outcome |
| PIR | SNV | Missense_Mutation | c.334N>G | p.His112Asp | p.H112D | O00625 | protein_coding | tolerated(0.4) | possibly_damaging(0.455) | TCGA-A8-A09W-01 | Breast | breast invasive carcinoma | Female | >=65 | III/IV | Unknown | Unknown | SD | |
| PIR | SNV | Missense_Mutation | rs200350682 | c.587C>T | p.Thr196Met | p.T196M | O00625 | protein_coding | deleterious(0.04) | probably_damaging(0.994) | TCGA-D8-A1XJ-01 | Breast | breast invasive carcinoma | Female | >=65 | III/IV | Hormone Therapy | tamoxiphen | SD |
| PIR | SNV | Missense_Mutation | novel | c.397N>C | p.Glu133Gln | p.E133Q | O00625 | protein_coding | deleterious(0) | possibly_damaging(0.806) | TCGA-E2-A1LG-01 | Breast | breast invasive carcinoma | Female | <65 | I/II | Chemotherapy | doxorubicin | SD |
| PIR | insertion | Frame_Shift_Ins | novel | c.338_339insA | p.Leu114ProfsTer6 | p.L114Pfs*6 | O00625 | protein_coding | TCGA-BH-A0HF-01 | Breast | breast invasive carcinoma | Female | >=65 | I/II | Hormone Therapy | arimidex | SD | ||
| PIR | insertion | Nonsense_Mutation | novel | c.337_338insATTTTGTTTTGTGTTTCTAGTGCAAACAAAAGTAATT | p.Gly113AspfsTer7 | p.G113Dfs*7 | O00625 | protein_coding | TCGA-BH-A0HF-01 | Breast | breast invasive carcinoma | Female | >=65 | I/II | Hormone Therapy | arimidex | SD | ||
| PIR | SNV | Missense_Mutation | rs757971715 | c.539N>T | p.Ala180Val | p.A180V | O00625 | protein_coding | deleterious(0.01) | benign(0.329) | TCGA-EX-A69M-01 | Cervix | cervical & endocervical cancer | Female | <65 | I/II | Unknown | Unknown | PD |
| PIR | SNV | Missense_Mutation | novel | c.448N>A | p.Ala150Thr | p.A150T | O00625 | protein_coding | tolerated(0.06) | benign(0.007) | TCGA-5M-AAT6-01 | Colorectum | colon adenocarcinoma | Female | <65 | III/IV | Unknown | Unknown | PD |
| PIR | SNV | Missense_Mutation | c.623C>T | p.Ala208Val | p.A208V | O00625 | protein_coding | tolerated(0.37) | benign(0.014) | TCGA-AD-A5EJ-01 | Colorectum | colon adenocarcinoma | Female | >=65 | I/II | Unknown | Unknown | SD | |
| PIR | SNV | Missense_Mutation | c.554C>T | p.Pro185Leu | p.P185L | O00625 | protein_coding | deleterious(0.03) | benign(0.013) | TCGA-NH-A5IV-01 | Colorectum | colon adenocarcinoma | Female | >=65 | I/II | Unknown | Unknown | SD | |
| PIR | SNV | Missense_Mutation | c.776N>G | p.Asn259Ser | p.N259S | O00625 | protein_coding | tolerated(0.09) | probably_damaging(0.922) | TCGA-AP-A056-01 | Endometrium | uterine corpus endometrioid carcinoma | Female | <65 | I/II | Unknown | Unknown | SD |
| Page: 1 2 3 |
Top |
Related drugs of malignant transformation related genes |
| Identification of chemicals and drugs interact with genes involved in malignant transfromation |
| (DGIdb 4.0) |
| Entrez ID | Symbol | Category | Interaction Types | Drug Claim Name | Drug Name | PMIDs |
| Page: 1 |

Copyright 2023-Present -The University of Texas Health Science Center at Houston |