
|
|||||
|
 | |
| |
| |
| |
| |
| |
|
Gene: PIPOX |
Gene summary for PIPOX |
| Gene information | Species | Human | Gene symbol | PIPOX | Gene ID | 51268 |
| Gene name | pipecolic acid and sarcosine oxidase | |
| Gene Alias | LPIPOX | |
| Cytomap | 17q11.2 | |
| Gene Type | protein-coding | GO ID | GO:0006082 | UniProtAcc | Q9P0Z9 |
Top |
Malignant transformation analysis |
| Identification of the aberrant gene expression in precancerous and cancerous lesions by comparing the gene expression of stem-like cells in diseased tissues with normal stem cells |
| Entrez ID | Symbol | Replicates | Species | Organ | Tissue | Adj P-value | Log2FC | Malignancy |
| 51268 | PIPOX | NAFLD1 | Human | Liver | NAFLD | 9.45e-06 | 6.16e-01 | -0.04 |
| 51268 | PIPOX | HCC1_Meng | Human | Liver | HCC | 1.16e-53 | 1.41e-01 | 0.0246 |
| 51268 | PIPOX | HCC1 | Human | Liver | HCC | 7.94e-16 | 3.72e+00 | 0.5336 |
| 51268 | PIPOX | HCC2 | Human | Liver | HCC | 2.09e-19 | 3.31e+00 | 0.5341 |
| 51268 | PIPOX | HCC5 | Human | Liver | HCC | 1.83e-04 | 2.47e+00 | 0.4932 |
| 51268 | PIPOX | Pt14.b | Human | Liver | HCC | 7.01e-05 | 3.62e-01 | 0.018 |
| 51268 | PIPOX | S016 | Human | Liver | HCC | 1.94e-03 | 3.68e-01 | 0.2243 |
| 51268 | PIPOX | S027 | Human | Liver | HCC | 1.50e-06 | 9.77e-01 | 0.2446 |
| 51268 | PIPOX | S028 | Human | Liver | HCC | 8.31e-27 | 1.06e+00 | 0.2503 |
| 51268 | PIPOX | S029 | Human | Liver | HCC | 4.20e-23 | 1.10e+00 | 0.2581 |
| Page: 1 |
| Tissue | Expression Dynamics | Abbreviation |
| Liver | 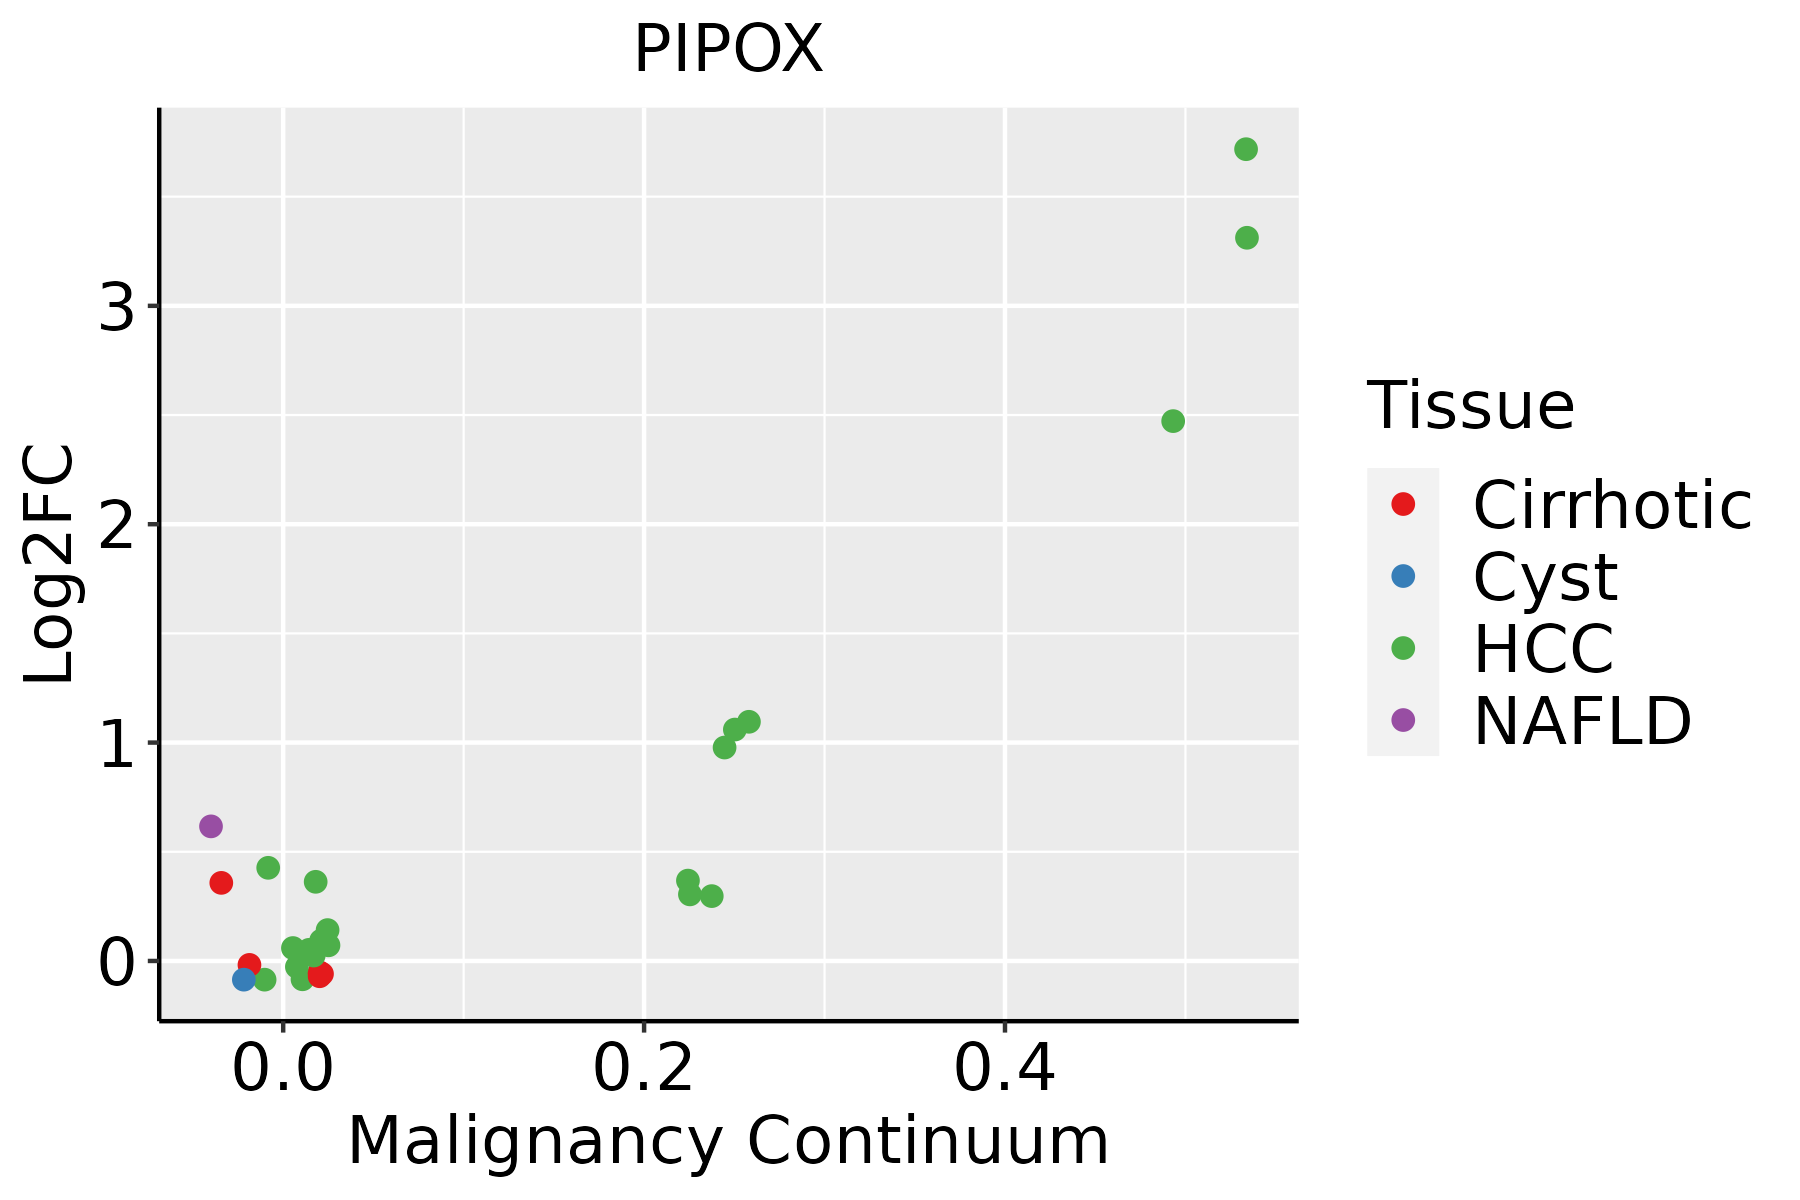 | HCC: Hepatocellular carcinoma |
| NAFLD: Non-alcoholic fatty liver disease |
| ∗log2FC in expression of this searched gene in stem-like cells from each diseased tissue sample relative to stem-like cells in normal samples in each tissue plotted against the malignancy continuum. Samples are colored based on if they are from different disease stage. |
Top |
Malignant transformation related pathway analysis |
| Find out the enriched GO biological processes and KEGG pathways involved in transition from healthy to precancer to cancer |
| Tissue | Disease Stage | Enriched GO biological Processes |
| Colorectum | AD |  |
| Colorectum | SER |  |
| Colorectum | MSS |  |
| Colorectum | MSI-H |  |
| Colorectum | FAP |  |
| ∗Top 15 enriched GO BP terms are showed in the bar plot of each disease state in each tissue. Each row represents a significant GO biological process which is colored according to the -log10(p.adjust). |
| Page: 1 2 3 4 5 6 7 8 9 |
| GO ID | Tissue | Disease Stage | Description | Gene Ratio | Bg Ratio | pvalue | p.adjust | Count |
| GO:00463953 | Liver | NAFLD | carboxylic acid catabolic process | 73/1882 | 236/18723 | 4.16e-19 | 1.22e-15 | 73 |
| GO:00160544 | Liver | NAFLD | organic acid catabolic process | 73/1882 | 240/18723 | 1.20e-18 | 2.34e-15 | 73 |
| GO:00442825 | Liver | NAFLD | small molecule catabolic process | 91/1882 | 376/18723 | 8.96e-16 | 1.31e-12 | 91 |
| GO:0009063 | Liver | NAFLD | cellular amino acid catabolic process | 36/1882 | 110/18723 | 6.56e-11 | 1.99e-08 | 36 |
| GO:00065203 | Liver | NAFLD | cellular amino acid metabolic process | 63/1882 | 284/18723 | 1.14e-09 | 2.17e-07 | 63 |
| GO:19016053 | Liver | NAFLD | alpha-amino acid metabolic process | 46/1882 | 195/18723 | 2.74e-08 | 2.86e-06 | 46 |
| GO:00092596 | Liver | NAFLD | ribonucleotide metabolic process | 72/1882 | 385/18723 | 1.51e-07 | 1.09e-05 | 72 |
| GO:00196936 | Liver | NAFLD | ribose phosphate metabolic process | 73/1882 | 396/18723 | 2.23e-07 | 1.53e-05 | 73 |
| GO:00091177 | Liver | NAFLD | nucleotide metabolic process | 85/1882 | 489/18723 | 3.31e-07 | 2.18e-05 | 85 |
| GO:00067537 | Liver | NAFLD | nucleoside phosphate metabolic process | 85/1882 | 497/18723 | 6.69e-07 | 3.83e-05 | 85 |
| GO:00725217 | Liver | NAFLD | purine-containing compound metabolic process | 74/1882 | 416/18723 | 7.73e-07 | 4.27e-05 | 74 |
| GO:1901606 | Liver | NAFLD | alpha-amino acid catabolic process | 25/1882 | 87/18723 | 8.67e-07 | 4.60e-05 | 25 |
| GO:00091507 | Liver | NAFLD | purine ribonucleotide metabolic process | 67/1882 | 368/18723 | 1.10e-06 | 5.44e-05 | 67 |
| GO:00061637 | Liver | NAFLD | purine nucleotide metabolic process | 70/1882 | 396/18723 | 1.93e-06 | 8.23e-05 | 70 |
| GO:00067904 | Liver | NAFLD | sulfur compound metabolic process | 58/1882 | 339/18723 | 3.79e-05 | 9.38e-04 | 58 |
| GO:0009066 | Liver | NAFLD | aspartate family amino acid metabolic process | 15/1882 | 49/18723 | 5.88e-05 | 1.30e-03 | 15 |
| GO:00338653 | Liver | NAFLD | nucleoside bisphosphate metabolic process | 28/1882 | 128/18723 | 5.89e-05 | 1.30e-03 | 28 |
| GO:00338753 | Liver | NAFLD | ribonucleoside bisphosphate metabolic process | 28/1882 | 128/18723 | 5.89e-05 | 1.30e-03 | 28 |
| GO:00340323 | Liver | NAFLD | purine nucleoside bisphosphate metabolic process | 28/1882 | 128/18723 | 5.89e-05 | 1.30e-03 | 28 |
| GO:00425582 | Liver | NAFLD | pteridine-containing compound metabolic process | 11/1882 | 33/18723 | 2.45e-04 | 4.09e-03 | 11 |
| Page: 1 2 3 |
| Pathway ID | Tissue | Disease Stage | Description | Gene Ratio | Bg Ratio | pvalue | p.adjust | qvalue | Count |
| hsa003108 | Liver | NAFLD | Lysine degradation | 21/1043 | 63/8465 | 1.09e-05 | 3.58e-04 | 2.89e-04 | 21 |
| hsa04146 | Liver | NAFLD | Peroxisome | 19/1043 | 82/8465 | 4.37e-03 | 4.10e-02 | 3.30e-02 | 19 |
| hsa0031011 | Liver | NAFLD | Lysine degradation | 21/1043 | 63/8465 | 1.09e-05 | 3.58e-04 | 2.89e-04 | 21 |
| hsa041461 | Liver | NAFLD | Peroxisome | 19/1043 | 82/8465 | 4.37e-03 | 4.10e-02 | 3.30e-02 | 19 |
| hsa0031041 | Liver | HCC | Lysine degradation | 47/4020 | 63/8465 | 1.02e-05 | 7.58e-05 | 4.22e-05 | 47 |
| hsa041464 | Liver | HCC | Peroxisome | 58/4020 | 82/8465 | 1.57e-05 | 1.05e-04 | 5.85e-05 | 58 |
| hsa002602 | Liver | HCC | Glycine, serine and threonine metabolism | 28/4020 | 40/8465 | 3.28e-03 | 1.07e-02 | 5.93e-03 | 28 |
| hsa0031051 | Liver | HCC | Lysine degradation | 47/4020 | 63/8465 | 1.02e-05 | 7.58e-05 | 4.22e-05 | 47 |
| hsa041465 | Liver | HCC | Peroxisome | 58/4020 | 82/8465 | 1.57e-05 | 1.05e-04 | 5.85e-05 | 58 |
| hsa002603 | Liver | HCC | Glycine, serine and threonine metabolism | 28/4020 | 40/8465 | 3.28e-03 | 1.07e-02 | 5.93e-03 | 28 |
| Page: 1 |
Top |
Cell-cell communication analysis |
| Identification of potential cell-cell interactions between two cell types and their ligand-receptor pairs for different disease states |
| Ligand | Receptor | LRpair | Pathway | Tissue | Disease Stage |
| Page: 1 |
Top |
Single-cell gene regulatory network inference analysis |
| Find out the significant the regulons (TFs) and the target genes of each regulon across cell types for different disease states |
| TF | Cell Type | Tissue | Disease Stage | Target Gene | RSS | Regulon Activity |
| ∗The dot plots of a searched regulon are shown for all cell subpopulations in each disease state of each tissue based on the regulon specific score inferred using pySCENIC and by calculating the average expression. |
| Page: 1 |
Top |
Somatic mutation of malignant transformation related genes |
| Annotation of somatic variants for genes involved in malignant transformation |
| Hugo Symbol | Variant Class | Variant Classification | dbSNP RS | HGVSc | HGVSp | HGVSp Short | SWISSPROT | BIOTYPE | SIFT | PolyPhen | Tumor Sample Barcode | Tissue | Histology | Sex | Age | Stage | Therapy Types | Drugs | Outcome |
| PIPOX | SNV | Missense_Mutation | rs142705261 | c.488N>A | p.Arg163Gln | p.R163Q | Q9P0Z9 | protein_coding | tolerated(0.58) | benign(0.013) | TCGA-D8-A13Z-01 | Breast | breast invasive carcinoma | Female | <65 | I/II | Chemotherapy | doxorubicine | SD |
| PIPOX | insertion | Frame_Shift_Ins | novel | c.669_670insCTCTTTTCTGCCCCAGGCAAAAGGCTTTCTGTCC | p.Ile224LeufsTer69 | p.I224Lfs*69 | Q9P0Z9 | protein_coding | TCGA-BH-A0BA-01 | Breast | breast invasive carcinoma | Female | <65 | III/IV | Chemotherapy | cytoxan | SD | ||
| PIPOX | SNV | Missense_Mutation | novel | c.862N>A | p.Ala288Thr | p.A288T | Q9P0Z9 | protein_coding | tolerated(0.44) | benign(0.017) | TCGA-2W-A8YY-01 | Cervix | cervical & endocervical cancer | Female | <65 | I/II | Chemotherapy | cisplatin | CR |
| PIPOX | SNV | Missense_Mutation | c.789N>C | p.Glu263Asp | p.E263D | Q9P0Z9 | protein_coding | deleterious(0.02) | possibly_damaging(0.841) | TCGA-A6-2686-01 | Colorectum | colon adenocarcinoma | Female | >=65 | I/II | Unknown | Unknown | SD | |
| PIPOX | SNV | Missense_Mutation | novel | c.20N>C | p.Leu7Pro | p.L7P | Q9P0Z9 | protein_coding | deleterious(0.03) | possibly_damaging(0.564) | TCGA-AA-3845-01 | Colorectum | colon adenocarcinoma | Female | >=65 | I/II | Unknown | Unknown | PD |
| PIPOX | SNV | Missense_Mutation | c.624N>T | p.Gln208His | p.Q208H | Q9P0Z9 | protein_coding | deleterious(0.01) | possibly_damaging(0.571) | TCGA-AA-3977-01 | Colorectum | colon adenocarcinoma | Male | >=65 | I/II | Unknown | Unknown | SD | |
| PIPOX | SNV | Missense_Mutation | c.954C>A | p.Ser318Arg | p.S318R | Q9P0Z9 | protein_coding | tolerated(0.73) | benign(0.001) | TCGA-AA-A010-01 | Colorectum | colon adenocarcinoma | Female | <65 | I/II | Chemotherapy | folinic | CR | |
| PIPOX | SNV | Missense_Mutation | novel | c.1012N>T | p.Asp338Tyr | p.D338Y | Q9P0Z9 | protein_coding | deleterious(0.03) | possibly_damaging(0.49) | TCGA-AZ-4315-01 | Colorectum | colon adenocarcinoma | Male | <65 | I/II | Unknown | Unknown | SD |
| PIPOX | SNV | Missense_Mutation | c.1061N>T | p.Ala354Val | p.A354V | Q9P0Z9 | protein_coding | deleterious(0) | probably_damaging(0.943) | TCGA-AZ-6606-01 | Colorectum | colon adenocarcinoma | Male | >=65 | III/IV | Chemotherapy | folfiri | PD | |
| PIPOX | SNV | Missense_Mutation | rs763783220 | c.167N>A | p.Arg56Gln | p.R56Q | Q9P0Z9 | protein_coding | deleterious(0) | possibly_damaging(0.879) | TCGA-F4-6808-01 | Colorectum | colon adenocarcinoma | Female | <65 | I/II | Unknown | Unknown | SD |
| Page: 1 2 3 4 |
Top |
Related drugs of malignant transformation related genes |
| Identification of chemicals and drugs interact with genes involved in malignant transfromation |
| (DGIdb 4.0) |
| Entrez ID | Symbol | Category | Interaction Types | Drug Claim Name | Drug Name | PMIDs |
| Page: 1 |

Copyright 2023-Present -The University of Texas Health Science Center at Houston |