
|
|||||
|
 | |
| |
| |
| |
| |
| |
|
Gene: PIP5K1B |
Gene summary for PIP5K1B |
| Gene information | Species | Human | Gene symbol | PIP5K1B | Gene ID | 8395 |
| Gene name | phosphatidylinositol-4-phosphate 5-kinase type 1 beta | |
| Gene Alias | MSS4 | |
| Cytomap | 9q21.11 | |
| Gene Type | protein-coding | GO ID | GO:0006629 | UniProtAcc | O14986 |
Top |
Malignant transformation analysis |
| Identification of the aberrant gene expression in precancerous and cancerous lesions by comparing the gene expression of stem-like cells in diseased tissues with normal stem cells |
| Entrez ID | Symbol | Replicates | Species | Organ | Tissue | Adj P-value | Log2FC | Malignancy |
| 8395 | PIP5K1B | HTA11_3410_2000001011 | Human | Colorectum | AD | 1.72e-06 | -4.02e-01 | 0.0155 |
| 8395 | PIP5K1B | HTA11_347_2000001011 | Human | Colorectum | AD | 6.96e-18 | 9.48e-01 | -0.1954 |
| 8395 | PIP5K1B | HTA11_411_2000001011 | Human | Colorectum | SER | 2.68e-10 | 1.09e+00 | -0.2602 |
| 8395 | PIP5K1B | HTA11_1391_2000001011 | Human | Colorectum | AD | 1.17e-03 | 6.31e-01 | -0.059 |
| 8395 | PIP5K1B | HTA11_7862_2000001011 | Human | Colorectum | AD | 1.08e-03 | -5.24e-01 | -0.0179 |
| 8395 | PIP5K1B | HTA11_866_3004761011 | Human | Colorectum | AD | 6.65e-05 | -4.78e-01 | 0.096 |
| 8395 | PIP5K1B | HTA11_99999970781_79442 | Human | Colorectum | MSS | 1.09e-03 | -3.24e-01 | 0.294 |
| 8395 | PIP5K1B | HTA11_99999965104_69814 | Human | Colorectum | MSS | 6.07e-11 | 9.40e-01 | 0.281 |
| 8395 | PIP5K1B | HTA11_99999974143_84620 | Human | Colorectum | MSS | 1.00e-18 | -5.80e-01 | 0.3005 |
| 8395 | PIP5K1B | F007 | Human | Colorectum | FAP | 1.72e-02 | 1.77e-03 | 0.1176 |
| 8395 | PIP5K1B | A001-C-207 | Human | Colorectum | FAP | 1.27e-02 | -2.80e-01 | 0.1278 |
| 8395 | PIP5K1B | A015-C-203 | Human | Colorectum | FAP | 2.22e-33 | -6.17e-01 | -0.1294 |
| 8395 | PIP5K1B | A015-C-204 | Human | Colorectum | FAP | 6.86e-09 | -4.67e-01 | -0.0228 |
| 8395 | PIP5K1B | A014-C-040 | Human | Colorectum | FAP | 3.04e-06 | -4.82e-01 | -0.1184 |
| 8395 | PIP5K1B | A002-C-201 | Human | Colorectum | FAP | 1.45e-16 | -4.34e-01 | 0.0324 |
| 8395 | PIP5K1B | A001-C-119 | Human | Colorectum | FAP | 2.97e-16 | -7.78e-01 | -0.1557 |
| 8395 | PIP5K1B | A001-C-108 | Human | Colorectum | FAP | 4.50e-19 | -4.97e-01 | -0.0272 |
| 8395 | PIP5K1B | A002-C-205 | Human | Colorectum | FAP | 3.16e-35 | -8.16e-01 | -0.1236 |
| 8395 | PIP5K1B | A001-C-104 | Human | Colorectum | FAP | 7.87e-03 | -3.23e-01 | 0.0184 |
| 8395 | PIP5K1B | A015-C-005 | Human | Colorectum | FAP | 3.85e-02 | -1.20e-01 | -0.0336 |
| Page: 1 2 3 4 |
| Tissue | Expression Dynamics | Abbreviation |
| Colorectum (GSE201348) |  | FAP: Familial adenomatous polyposis |
| CRC: Colorectal cancer | ||
| Colorectum (HTA11) |  | AD: Adenomas |
| SER: Sessile serrated lesions | ||
| MSI-H: Microsatellite-high colorectal cancer | ||
| MSS: Microsatellite stable colorectal cancer | ||
| GC | 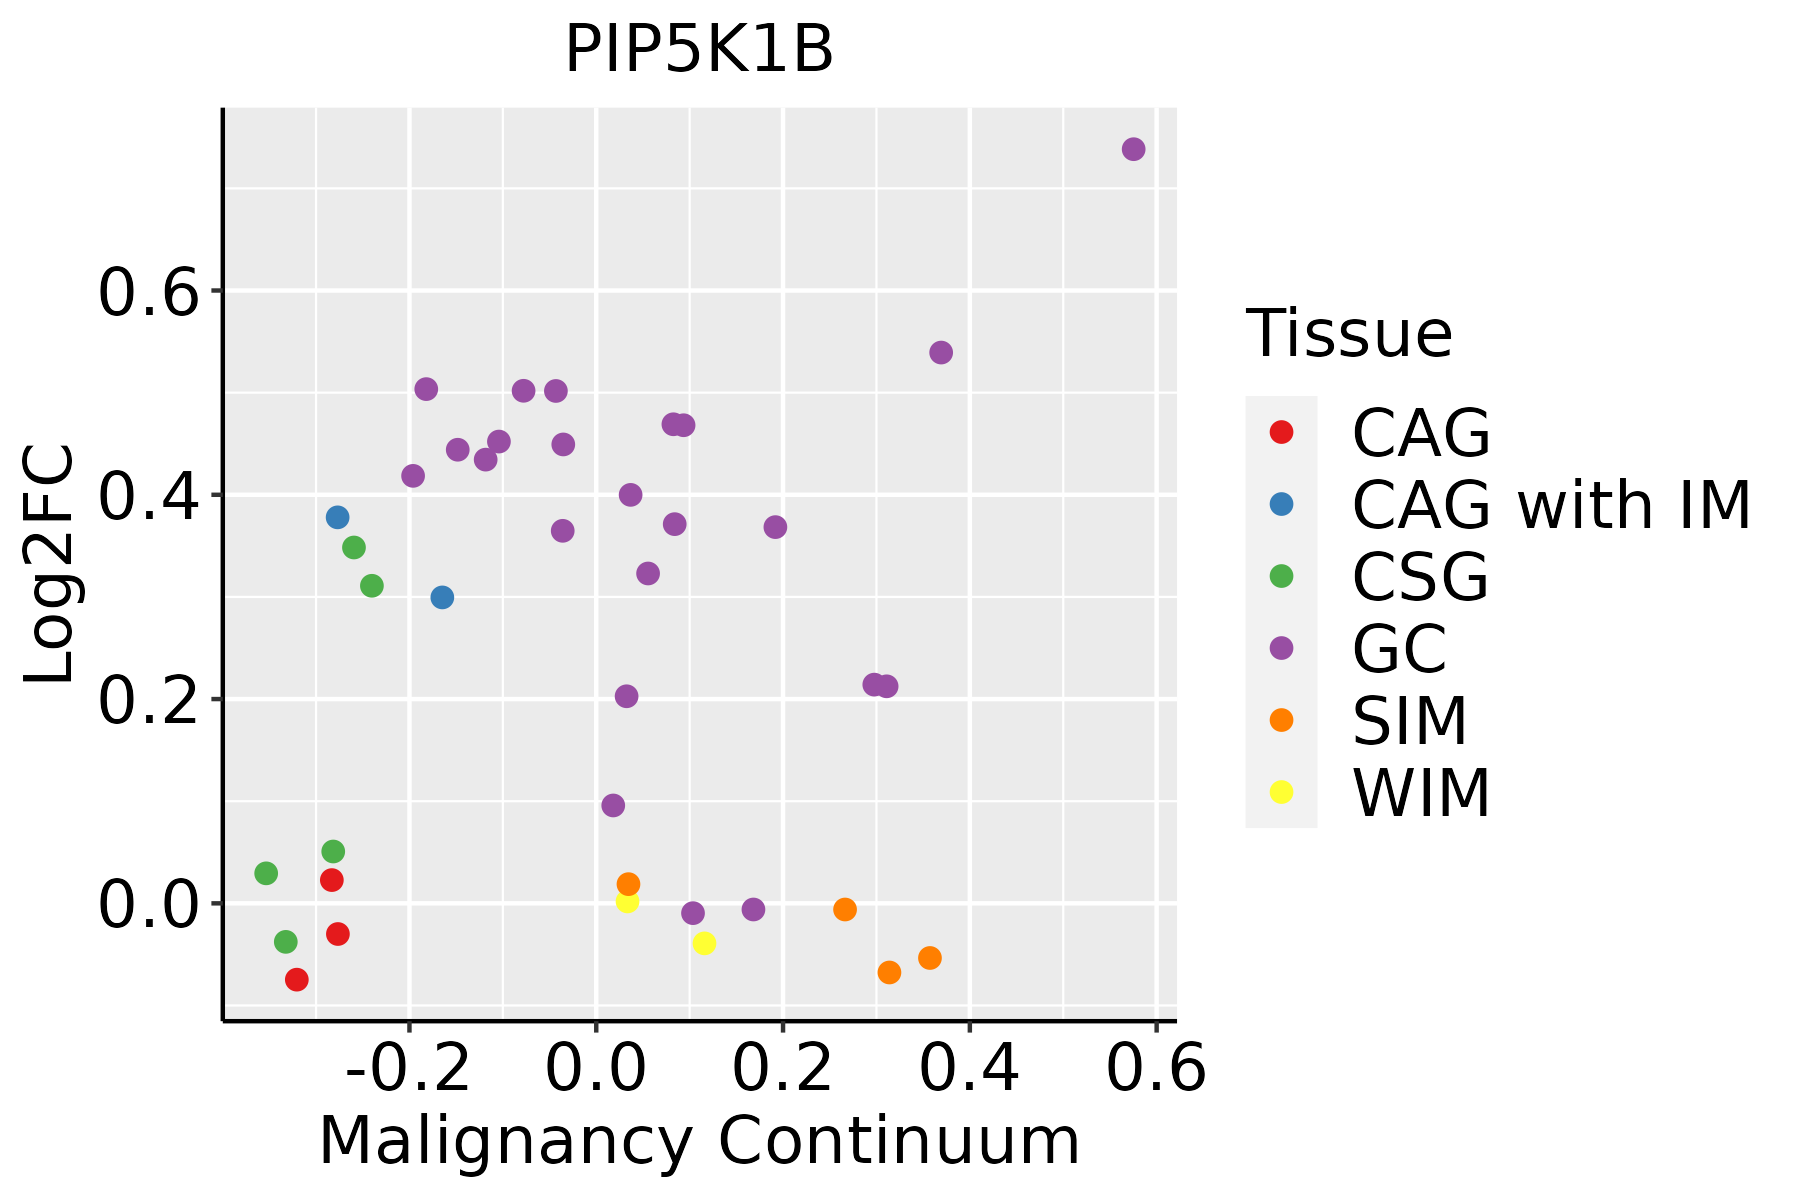 | CAG: Chronic atrophic gastritis |
| CAG with IM: Chronic atrophic gastritis with intestinal metaplasia | ||
| CSG: Chronic superficial gastritis | ||
| GC: Gastric cancer | ||
| SIM: Severe intestinal metaplasia | ||
| WIM: Wild intestinal metaplasia | ||
| Lung |  | AAH: Atypical adenomatous hyperplasia |
| AIS: Adenocarcinoma in situ | ||
| IAC: Invasive lung adenocarcinoma | ||
| MIA: Minimally invasive adenocarcinoma |
| ∗log2FC in expression of this searched gene in stem-like cells from each diseased tissue sample relative to stem-like cells in normal samples in each tissue plotted against the malignancy continuum. Samples are colored based on if they are from different disease stage. |
Top |
Malignant transformation related pathway analysis |
| Find out the enriched GO biological processes and KEGG pathways involved in transition from healthy to precancer to cancer |
| Tissue | Disease Stage | Enriched GO biological Processes |
| Colorectum | AD |  |
| Colorectum | SER |  |
| Colorectum | MSS |  |
| Colorectum | MSI-H |  |
| Colorectum | FAP |  |
| ∗Top 15 enriched GO BP terms are showed in the bar plot of each disease state in each tissue. Each row represents a significant GO biological process which is colored according to the -log10(p.adjust). |
| Page: 1 2 3 4 5 6 7 8 9 |
| GO ID | Tissue | Disease Stage | Description | Gene Ratio | Bg Ratio | pvalue | p.adjust | Count |
| GO:0048017 | Colorectum | AD | inositol lipid-mediated signaling | 53/3918 | 182/18723 | 5.35e-03 | 3.52e-02 | 53 |
| GO:0048015 | Colorectum | AD | phosphatidylinositol-mediated signaling | 52/3918 | 178/18723 | 5.37e-03 | 3.54e-02 | 52 |
| GO:0006650 | Colorectum | AD | glycerophospholipid metabolic process | 83/3918 | 306/18723 | 5.40e-03 | 3.55e-02 | 83 |
| GO:0006644 | Colorectum | AD | phospholipid metabolic process | 101/3918 | 383/18723 | 5.80e-03 | 3.67e-02 | 101 |
| GO:0045017 | Colorectum | AD | glycerolipid biosynthetic process | 69/3918 | 252/18723 | 8.33e-03 | 4.88e-02 | 69 |
| GO:0046486 | Colorectum | SER | glycerolipid metabolic process | 82/2897 | 392/18723 | 2.26e-03 | 2.17e-02 | 82 |
| GO:00066441 | Colorectum | SER | phospholipid metabolic process | 79/2897 | 383/18723 | 3.94e-03 | 3.24e-02 | 79 |
| GO:00480171 | Colorectum | SER | inositol lipid-mediated signaling | 42/2897 | 182/18723 | 4.36e-03 | 3.49e-02 | 42 |
| GO:00450171 | Colorectum | SER | glycerolipid biosynthetic process | 55/2897 | 252/18723 | 4.47e-03 | 3.56e-02 | 55 |
| GO:00480151 | Colorectum | SER | phosphatidylinositol-mediated signaling | 41/2897 | 178/18723 | 4.97e-03 | 3.86e-02 | 41 |
| GO:00066501 | Colorectum | SER | glycerophospholipid metabolic process | 64/2897 | 306/18723 | 6.41e-03 | 4.60e-02 | 64 |
| GO:0008654 | Colorectum | FAP | phospholipid biosynthetic process | 54/2622 | 253/18723 | 8.88e-04 | 9.08e-03 | 54 |
| GO:00066502 | Colorectum | FAP | glycerophospholipid metabolic process | 62/2622 | 306/18723 | 1.54e-03 | 1.38e-02 | 62 |
| GO:00066442 | Colorectum | FAP | phospholipid metabolic process | 74/2622 | 383/18723 | 2.24e-03 | 1.83e-02 | 74 |
| GO:0046474 | Colorectum | FAP | glycerophospholipid biosynthetic process | 44/2622 | 211/18723 | 3.98e-03 | 2.76e-02 | 44 |
| GO:00450172 | Colorectum | FAP | glycerolipid biosynthetic process | 50/2622 | 252/18723 | 6.32e-03 | 3.95e-02 | 50 |
| GO:00086541 | Colorectum | CRC | phospholipid biosynthetic process | 49/2078 | 253/18723 | 7.07e-05 | 1.51e-03 | 49 |
| GO:00066503 | Colorectum | CRC | glycerophospholipid metabolic process | 55/2078 | 306/18723 | 2.10e-04 | 3.55e-03 | 55 |
| GO:00450173 | Colorectum | CRC | glycerolipid biosynthetic process | 47/2078 | 252/18723 | 2.47e-04 | 4.06e-03 | 47 |
| GO:00066443 | Colorectum | CRC | phospholipid metabolic process | 65/2078 | 383/18723 | 3.21e-04 | 4.95e-03 | 65 |
| Page: 1 2 |
| Pathway ID | Tissue | Disease Stage | Description | Gene Ratio | Bg Ratio | pvalue | p.adjust | qvalue | Count |
| hsa04144 | Colorectum | AD | Endocytosis | 111/2092 | 251/8465 | 5.95e-12 | 1.42e-10 | 9.08e-11 | 111 |
| hsa04666 | Colorectum | AD | Fc gamma R-mediated phagocytosis | 46/2092 | 97/8465 | 9.10e-07 | 1.22e-05 | 7.77e-06 | 46 |
| hsa05135 | Colorectum | AD | Yersinia infection | 58/2092 | 137/8465 | 3.90e-06 | 4.35e-05 | 2.78e-05 | 58 |
| hsa04810 | Colorectum | AD | Regulation of actin cytoskeleton | 75/2092 | 229/8465 | 3.36e-03 | 1.76e-02 | 1.12e-02 | 75 |
| hsa04510 | Colorectum | AD | Focal adhesion | 67/2092 | 203/8465 | 4.40e-03 | 2.17e-02 | 1.38e-02 | 67 |
| hsa041441 | Colorectum | AD | Endocytosis | 111/2092 | 251/8465 | 5.95e-12 | 1.42e-10 | 9.08e-11 | 111 |
| hsa046661 | Colorectum | AD | Fc gamma R-mediated phagocytosis | 46/2092 | 97/8465 | 9.10e-07 | 1.22e-05 | 7.77e-06 | 46 |
| hsa051351 | Colorectum | AD | Yersinia infection | 58/2092 | 137/8465 | 3.90e-06 | 4.35e-05 | 2.78e-05 | 58 |
| hsa048101 | Colorectum | AD | Regulation of actin cytoskeleton | 75/2092 | 229/8465 | 3.36e-03 | 1.76e-02 | 1.12e-02 | 75 |
| hsa045101 | Colorectum | AD | Focal adhesion | 67/2092 | 203/8465 | 4.40e-03 | 2.17e-02 | 1.38e-02 | 67 |
| hsa041442 | Colorectum | SER | Endocytosis | 81/1580 | 251/8465 | 1.14e-07 | 2.36e-06 | 1.71e-06 | 81 |
| hsa046662 | Colorectum | SER | Fc gamma R-mediated phagocytosis | 39/1580 | 97/8465 | 5.84e-07 | 9.70e-06 | 7.04e-06 | 39 |
| hsa051352 | Colorectum | SER | Yersinia infection | 43/1580 | 137/8465 | 2.15e-04 | 2.10e-03 | 1.52e-03 | 43 |
| hsa048102 | Colorectum | SER | Regulation of actin cytoskeleton | 60/1580 | 229/8465 | 2.74e-03 | 2.02e-02 | 1.47e-02 | 60 |
| hsa041443 | Colorectum | SER | Endocytosis | 81/1580 | 251/8465 | 1.14e-07 | 2.36e-06 | 1.71e-06 | 81 |
| hsa046663 | Colorectum | SER | Fc gamma R-mediated phagocytosis | 39/1580 | 97/8465 | 5.84e-07 | 9.70e-06 | 7.04e-06 | 39 |
| hsa051353 | Colorectum | SER | Yersinia infection | 43/1580 | 137/8465 | 2.15e-04 | 2.10e-03 | 1.52e-03 | 43 |
| hsa048103 | Colorectum | SER | Regulation of actin cytoskeleton | 60/1580 | 229/8465 | 2.74e-03 | 2.02e-02 | 1.47e-02 | 60 |
| hsa041444 | Colorectum | MSS | Endocytosis | 102/1875 | 251/8465 | 1.85e-11 | 4.43e-10 | 2.71e-10 | 102 |
| hsa046664 | Colorectum | MSS | Fc gamma R-mediated phagocytosis | 45/1875 | 97/8465 | 9.30e-08 | 1.56e-06 | 9.55e-07 | 45 |
| Page: 1 2 3 4 |
Top |
Cell-cell communication analysis |
| Identification of potential cell-cell interactions between two cell types and their ligand-receptor pairs for different disease states |
| Ligand | Receptor | LRpair | Pathway | Tissue | Disease Stage |
| Page: 1 |
Top |
Single-cell gene regulatory network inference analysis |
| Find out the significant the regulons (TFs) and the target genes of each regulon across cell types for different disease states |
| TF | Cell Type | Tissue | Disease Stage | Target Gene | RSS | Regulon Activity |
| ∗The dot plots of a searched regulon are shown for all cell subpopulations in each disease state of each tissue based on the regulon specific score inferred using pySCENIC and by calculating the average expression. |
| Page: 1 |
Top |
Somatic mutation of malignant transformation related genes |
| Annotation of somatic variants for genes involved in malignant transformation |
| Hugo Symbol | Variant Class | Variant Classification | dbSNP RS | HGVSc | HGVSp | HGVSp Short | SWISSPROT | BIOTYPE | SIFT | PolyPhen | Tumor Sample Barcode | Tissue | Histology | Sex | Age | Stage | Therapy Types | Drugs | Outcome |
| PIP5K1B | SNV | Missense_Mutation | rs781715849 | c.644G>A | p.Arg215His | p.R215H | O14986 | protein_coding | deleterious(0) | possibly_damaging(0.879) | TCGA-A8-A09Z-01 | Breast | breast invasive carcinoma | Female | >=65 | I/II | Unknown | Unknown | SD |
| PIP5K1B | SNV | Missense_Mutation | rs766949478 | c.623C>T | p.Thr208Met | p.T208M | O14986 | protein_coding | deleterious(0.01) | probably_damaging(0.989) | TCGA-E9-A245-01 | Breast | breast invasive carcinoma | Female | <65 | I/II | Hormone Therapy | tamoxiphen | SD |
| PIP5K1B | SNV | Missense_Mutation | novel | c.622N>G | p.Thr208Ala | p.T208A | O14986 | protein_coding | deleterious(0) | probably_damaging(0.916) | TCGA-PL-A8LV-01 | Breast | breast invasive carcinoma | Female | <65 | III/IV | Unknown | Unknown | SD |
| PIP5K1B | deletion | Frame_Shift_Del | novel | c.646delN | p.Glu217ArgfsTer12 | p.E217Rfs*12 | O14986 | protein_coding | TCGA-D8-A27V-01 | Breast | breast invasive carcinoma | Female | <65 | I/II | Hormone Therapy | tamoxiphen | SD | ||
| PIP5K1B | SNV | Missense_Mutation | rs775224955 | c.1612N>A | p.Val538Ile | p.V538I | O14986 | protein_coding | tolerated_low_confidence(0.23) | benign(0.003) | TCGA-2W-A8YY-01 | Cervix | cervical & endocervical cancer | Female | <65 | I/II | Chemotherapy | cisplatin | CR |
| PIP5K1B | SNV | Missense_Mutation | c.778N>C | p.Glu260Gln | p.E260Q | O14986 | protein_coding | tolerated(0.34) | benign(0.145) | TCGA-IR-A3LH-01 | Cervix | cervical & endocervical cancer | Female | <65 | I/II | Chemotherapy | cisplatin | CR | |
| PIP5K1B | SNV | Missense_Mutation | novel | c.953N>A | p.Gly318Glu | p.G318E | O14986 | protein_coding | tolerated(0.08) | benign(0.062) | TCGA-MA-AA42-01 | Cervix | cervical & endocervical cancer | Female | >=65 | I/II | Unknown | Unknown | SD |
| PIP5K1B | SNV | Missense_Mutation | c.739G>A | p.Ala247Thr | p.A247T | O14986 | protein_coding | deleterious(0.01) | benign(0.298) | TCGA-A6-A565-01 | Colorectum | colon adenocarcinoma | Female | <65 | III/IV | Unspecific | 5FU | PD | |
| PIP5K1B | SNV | Missense_Mutation | c.157N>A | p.Leu53Ile | p.L53I | O14986 | protein_coding | deleterious(0) | probably_damaging(0.986) | TCGA-AA-3510-01 | Colorectum | colon adenocarcinoma | Male | >=65 | I/II | Unknown | Unknown | SD | |
| PIP5K1B | SNV | Missense_Mutation | rs746948673 | c.706G>A | p.Glu236Lys | p.E236K | O14986 | protein_coding | tolerated(0.08) | benign(0.063) | TCGA-AA-A00N-01 | Colorectum | colon adenocarcinoma | Male | >=65 | I/II | Unknown | Unknown | PD |
| Page: 1 2 3 4 5 6 |
Top |
Related drugs of malignant transformation related genes |
| Identification of chemicals and drugs interact with genes involved in malignant transfromation |
| (DGIdb 4.0) |
| Entrez ID | Symbol | Category | Interaction Types | Drug Claim Name | Drug Name | PMIDs |
| Page: 1 |

Copyright 2023-Present -The University of Texas Health Science Center at Houston |