
|
|||||
|
 | |
| |
| |
| |
| |
| |
|
Gene: PIP5K1A |
Gene summary for PIP5K1A |
| Gene information | Species | Human | Gene symbol | PIP5K1A | Gene ID | 8394 |
| Gene name | phosphatidylinositol-4-phosphate 5-kinase type 1 alpha | |
| Gene Alias | PIP5K1A | |
| Cytomap | 1q21.3 | |
| Gene Type | protein-coding | GO ID | GO:0001667 | UniProtAcc | Q99755 |
Top |
Malignant transformation analysis |
| Identification of the aberrant gene expression in precancerous and cancerous lesions by comparing the gene expression of stem-like cells in diseased tissues with normal stem cells |
| Entrez ID | Symbol | Replicates | Species | Organ | Tissue | Adj P-value | Log2FC | Malignancy |
| 8394 | PIP5K1A | CCI_1 | Human | Cervix | CC | 4.19e-16 | 1.30e+00 | 0.528 |
| 8394 | PIP5K1A | CCI_2 | Human | Cervix | CC | 1.22e-10 | 9.96e-01 | 0.5249 |
| 8394 | PIP5K1A | CCI_3 | Human | Cervix | CC | 5.90e-26 | 1.20e+00 | 0.516 |
| 8394 | PIP5K1A | AEH-subject1 | Human | Endometrium | AEH | 1.96e-11 | 4.84e-01 | -0.3059 |
| 8394 | PIP5K1A | AEH-subject2 | Human | Endometrium | AEH | 1.07e-03 | 2.20e-01 | -0.2525 |
| 8394 | PIP5K1A | AEH-subject3 | Human | Endometrium | AEH | 1.70e-06 | 2.97e-01 | -0.2576 |
| 8394 | PIP5K1A | AEH-subject4 | Human | Endometrium | AEH | 2.02e-17 | 5.78e-01 | -0.2657 |
| 8394 | PIP5K1A | AEH-subject5 | Human | Endometrium | AEH | 1.02e-15 | 5.56e-01 | -0.2953 |
| 8394 | PIP5K1A | EEC-subject1 | Human | Endometrium | EEC | 2.96e-16 | 5.29e-01 | -0.2682 |
| 8394 | PIP5K1A | EEC-subject2 | Human | Endometrium | EEC | 2.58e-09 | 4.10e-01 | -0.2607 |
| 8394 | PIP5K1A | EEC-subject3 | Human | Endometrium | EEC | 1.46e-17 | 4.36e-01 | -0.2525 |
| 8394 | PIP5K1A | EEC-subject5 | Human | Endometrium | EEC | 3.16e-10 | 4.65e-01 | -0.249 |
| 8394 | PIP5K1A | GSM6177620_NYU_UCEC1_lib1_lib1 | Human | Endometrium | EEC | 2.61e-04 | 9.14e-02 | -0.1869 |
| 8394 | PIP5K1A | GSM6177620_NYU_UCEC1_lib2_lib2 | Human | Endometrium | EEC | 3.08e-04 | 6.68e-02 | -0.1875 |
| 8394 | PIP5K1A | GSM6177620_NYU_UCEC1_lib3_lib3 | Human | Endometrium | EEC | 3.29e-03 | 3.77e-02 | -0.1883 |
| 8394 | PIP5K1A | GSM6177621_NYU_UCEC2_lib1_lib1 | Human | Endometrium | EEC | 1.69e-07 | 2.94e-01 | -0.1934 |
| 8394 | PIP5K1A | GSM6177622_NYU_UCEC3_lib1_lib1 | Human | Endometrium | EEC | 3.77e-11 | 7.27e-02 | -0.1917 |
| 8394 | PIP5K1A | GSM6177622_NYU_UCEC3_lib2_lib2 | Human | Endometrium | EEC | 8.32e-09 | 1.41e-01 | -0.1916 |
| 8394 | PIP5K1A | LZE2T | Human | Esophagus | ESCC | 1.10e-04 | 2.54e-01 | 0.082 |
| 8394 | PIP5K1A | LZE4T | Human | Esophagus | ESCC | 4.16e-11 | 2.05e-01 | 0.0811 |
| Page: 1 2 3 4 5 6 7 8 |
| Tissue | Expression Dynamics | Abbreviation |
| Cervix | 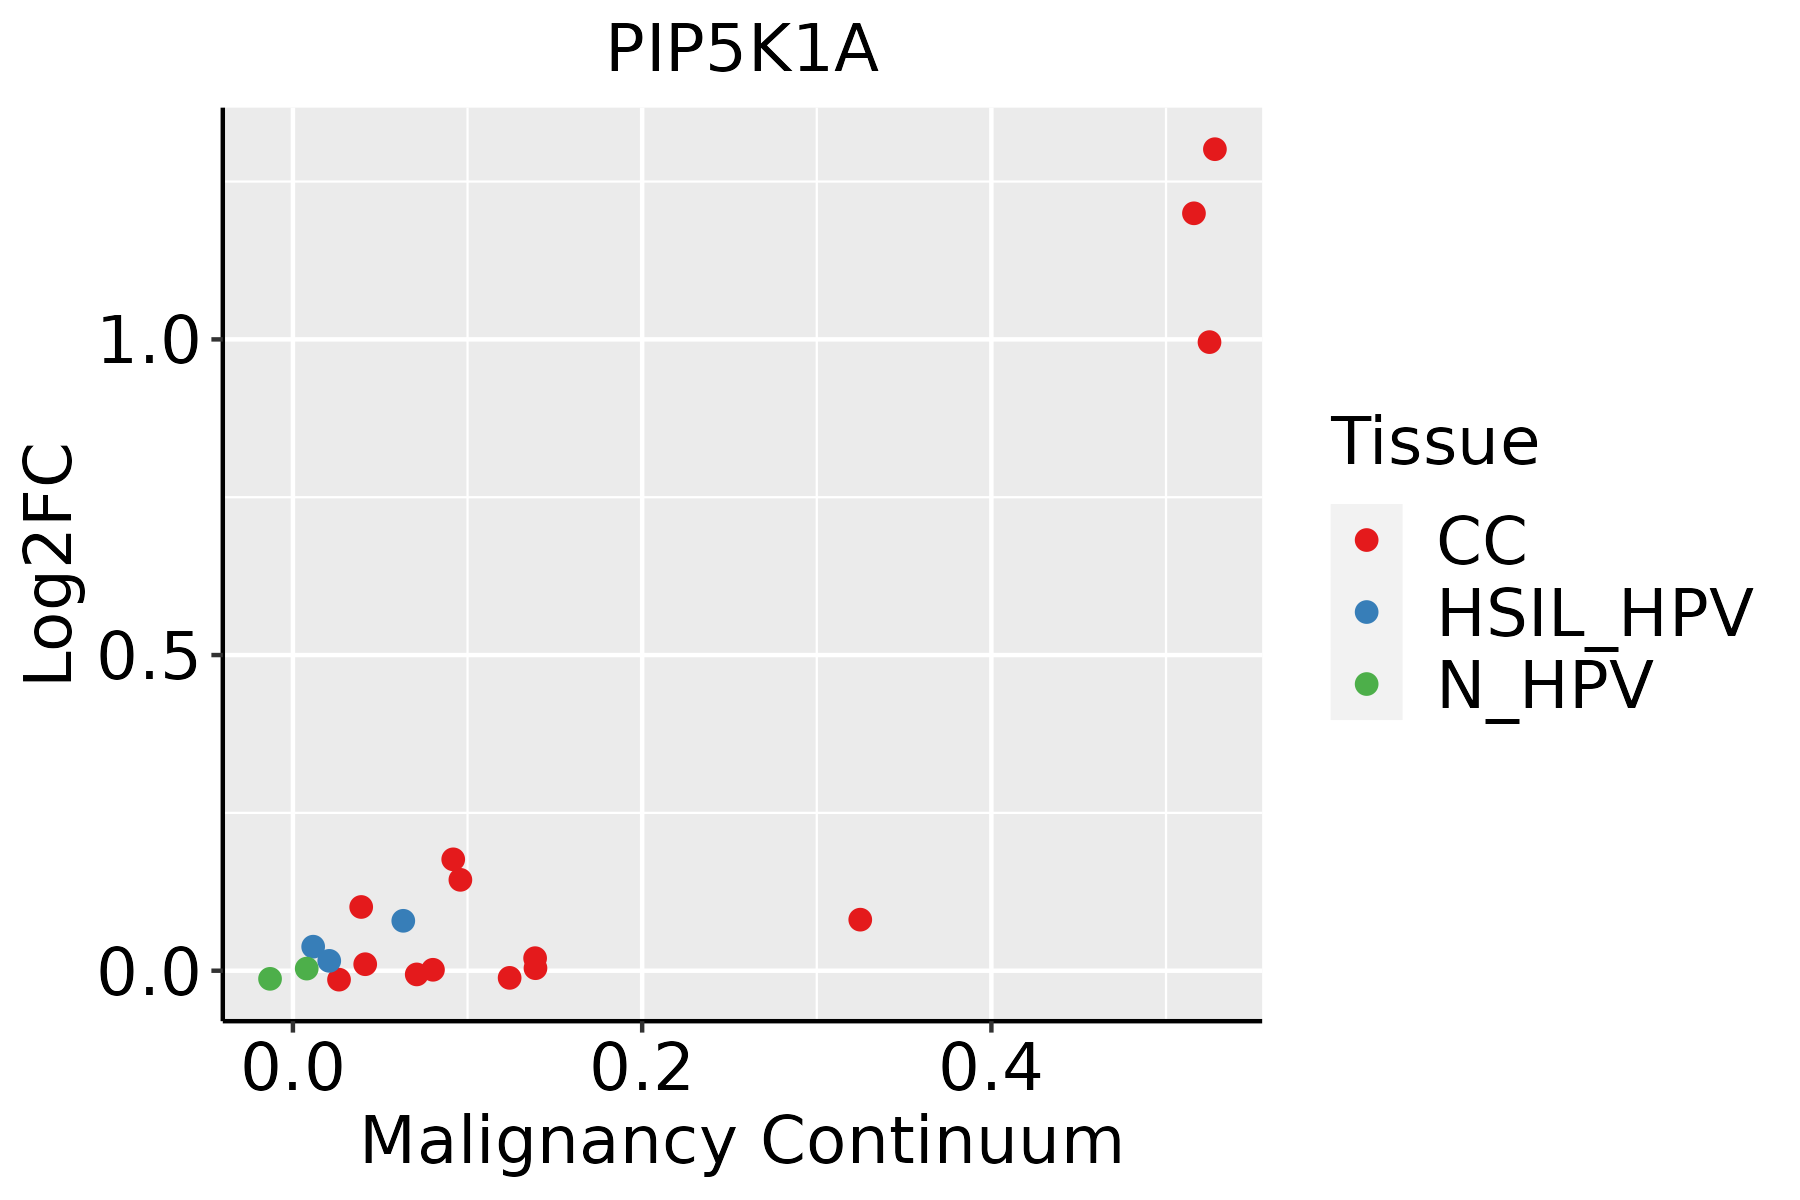 | CC: Cervix cancer |
| HSIL_HPV: HPV-infected high-grade squamous intraepithelial lesions | ||
| N_HPV: HPV-infected normal cervix | ||
| Endometrium | 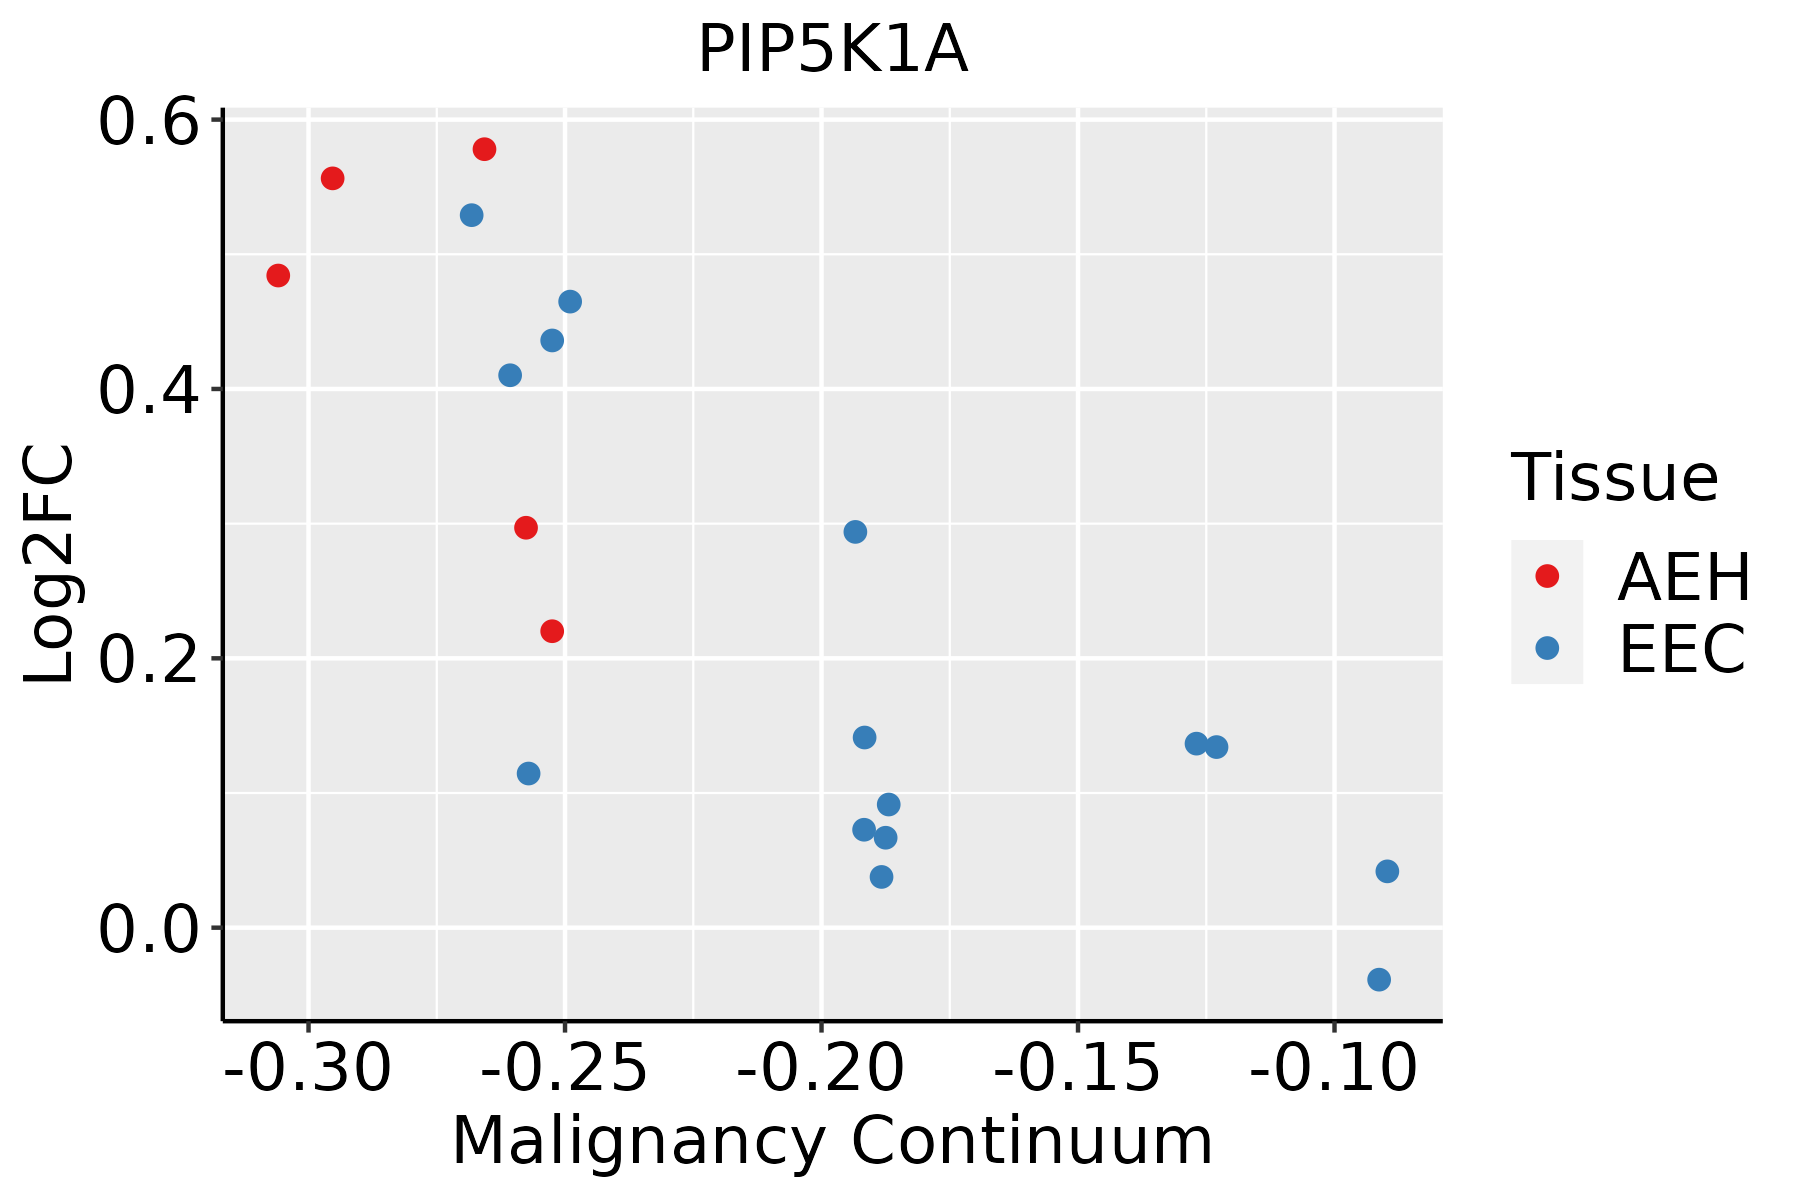 | AEH: Atypical endometrial hyperplasia |
| EEC: Endometrioid Cancer | ||
| Esophagus | 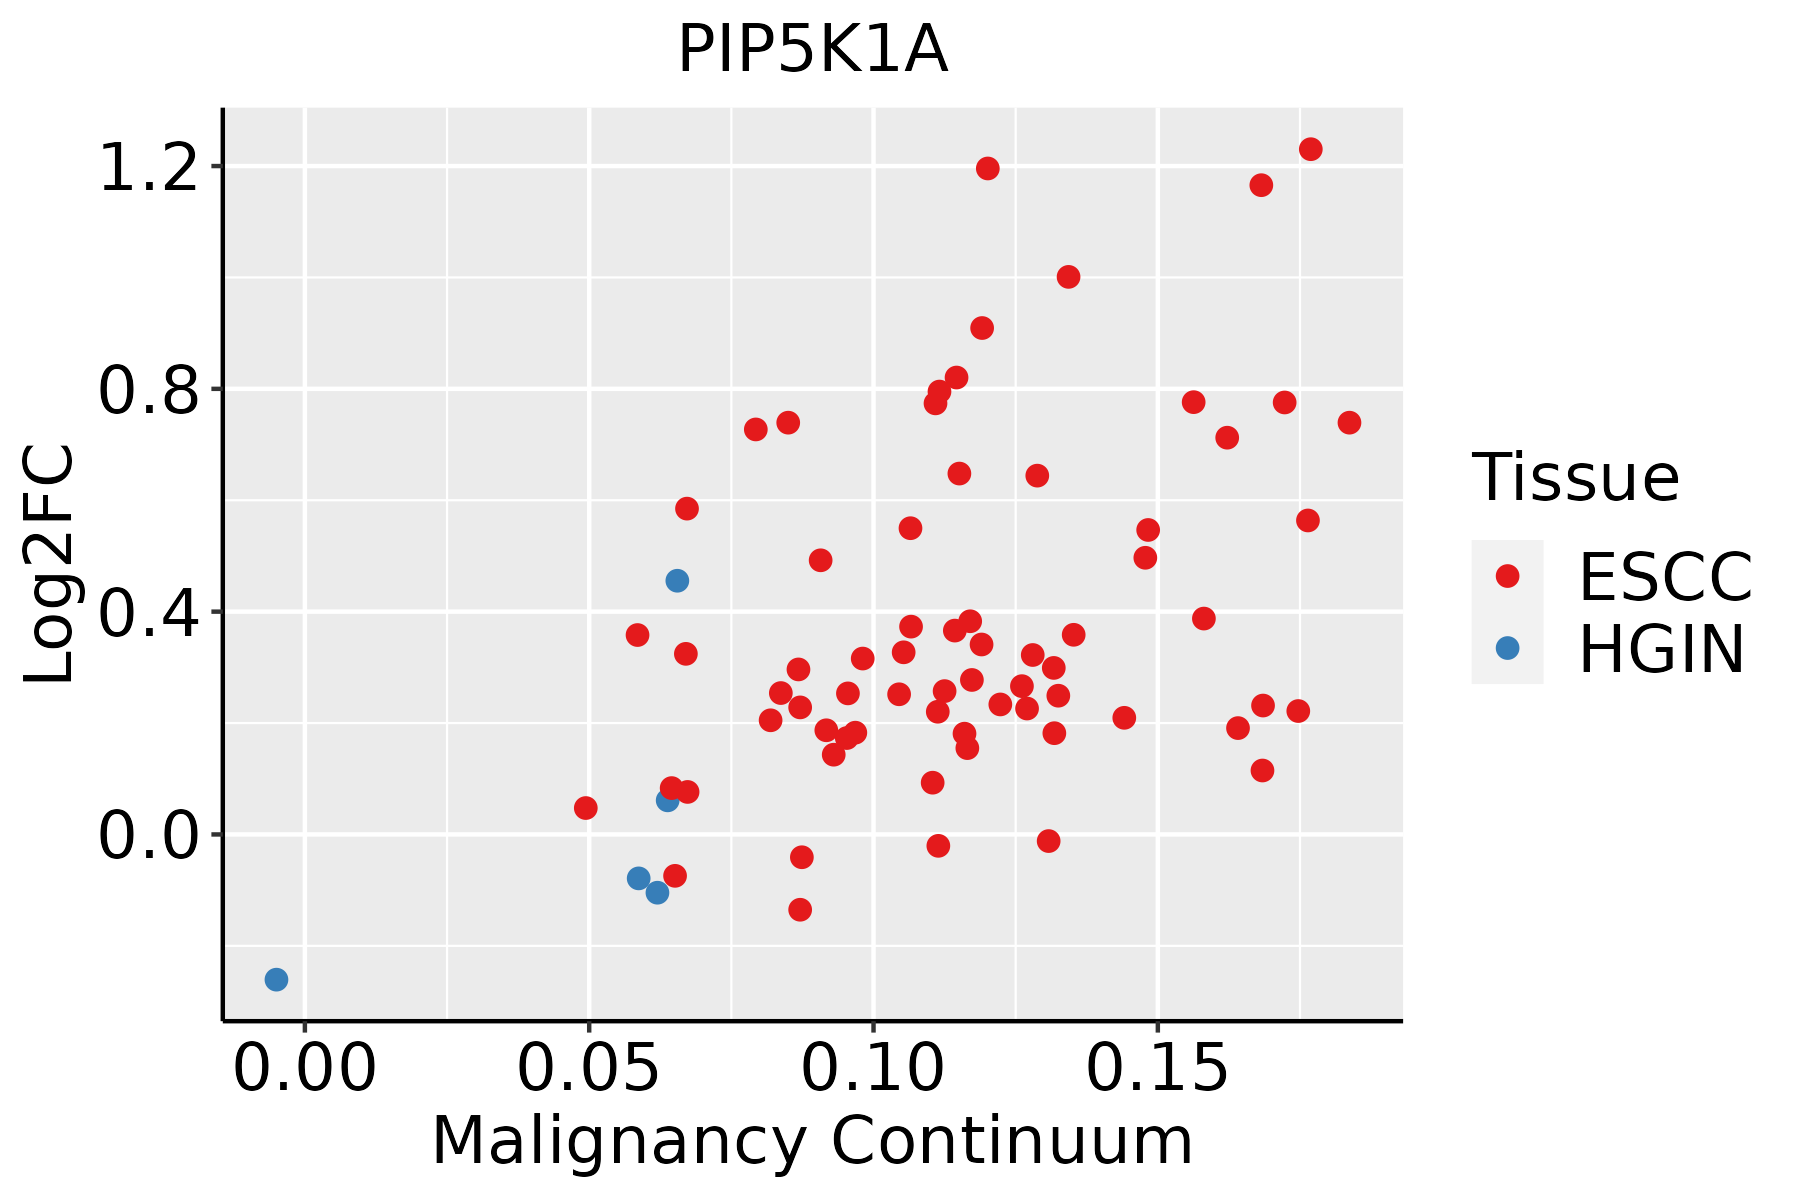 | ESCC: Esophageal squamous cell carcinoma |
| HGIN: High-grade intraepithelial neoplasias | ||
| LGIN: Low-grade intraepithelial neoplasias | ||
| Liver | 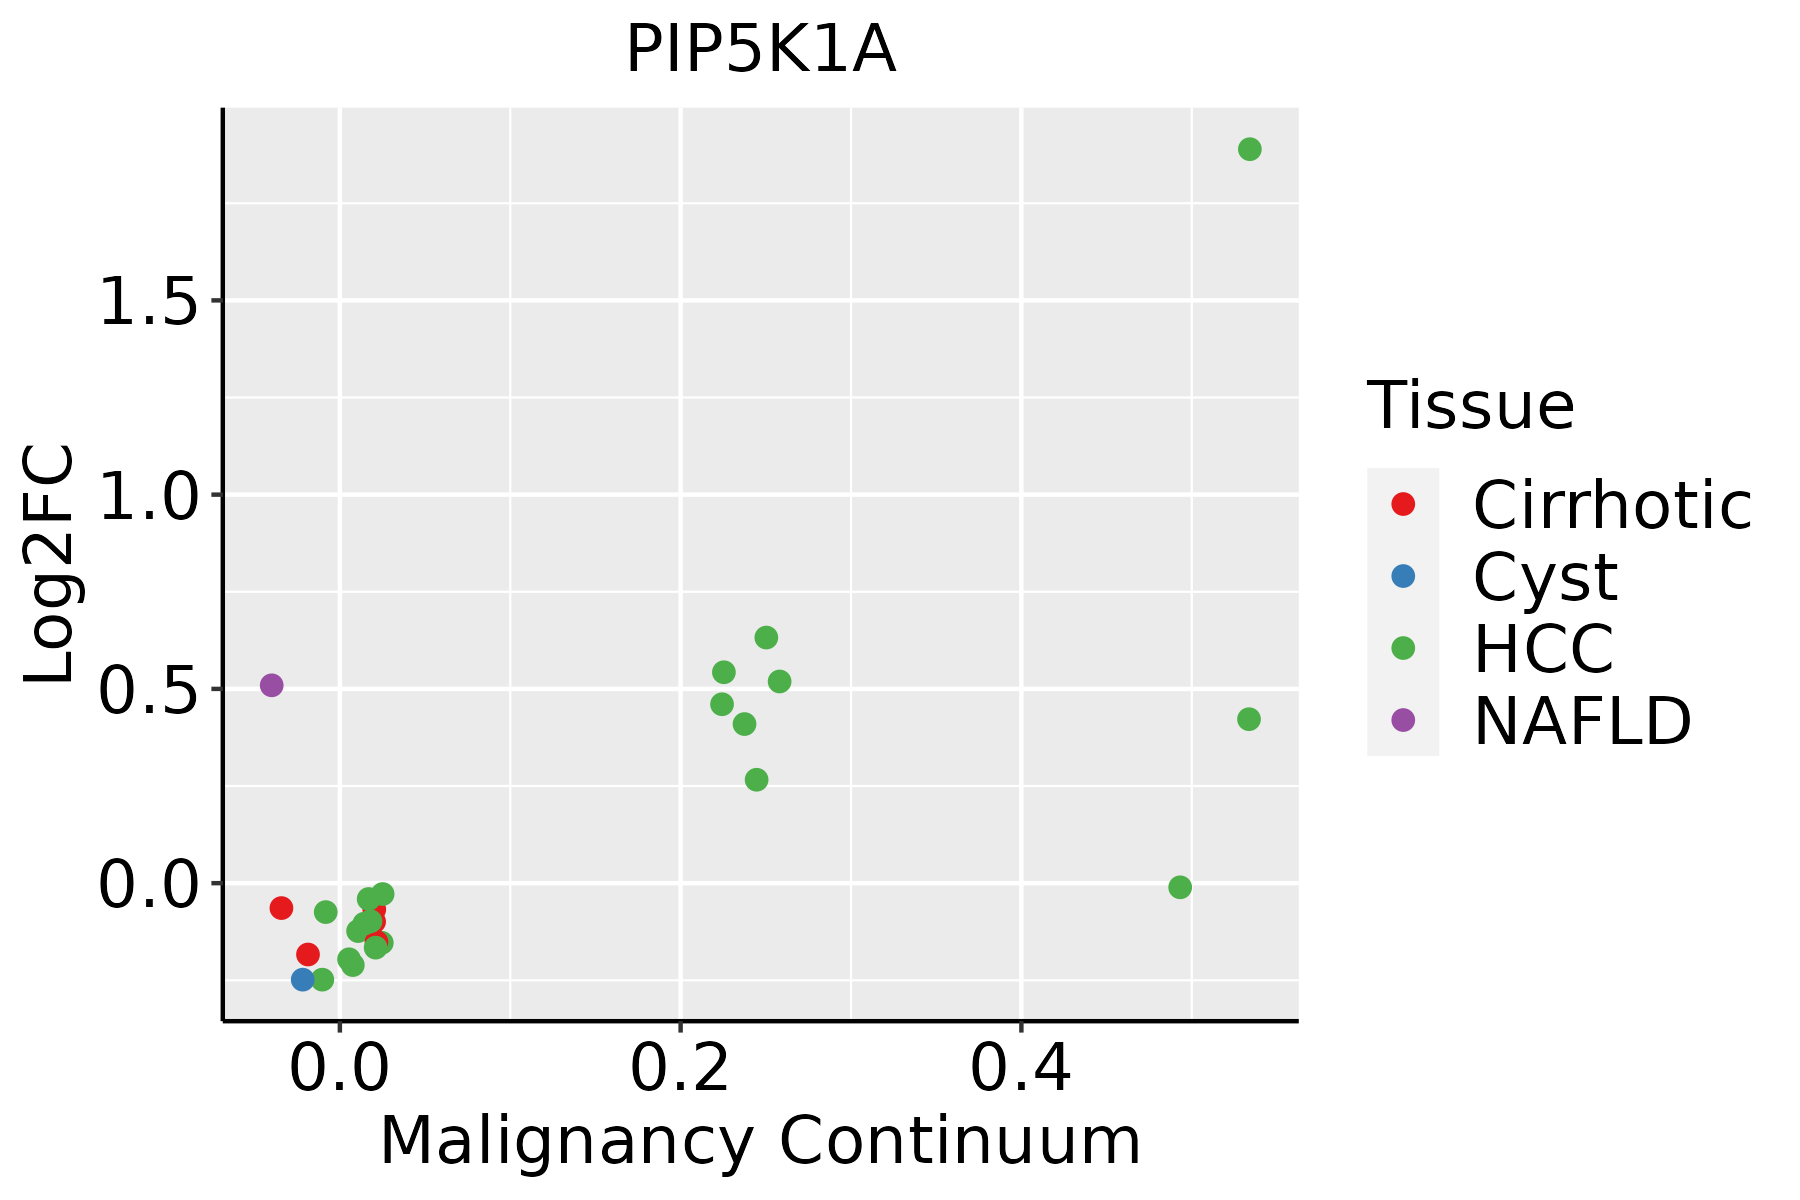 | HCC: Hepatocellular carcinoma |
| NAFLD: Non-alcoholic fatty liver disease | ||
| Lung | 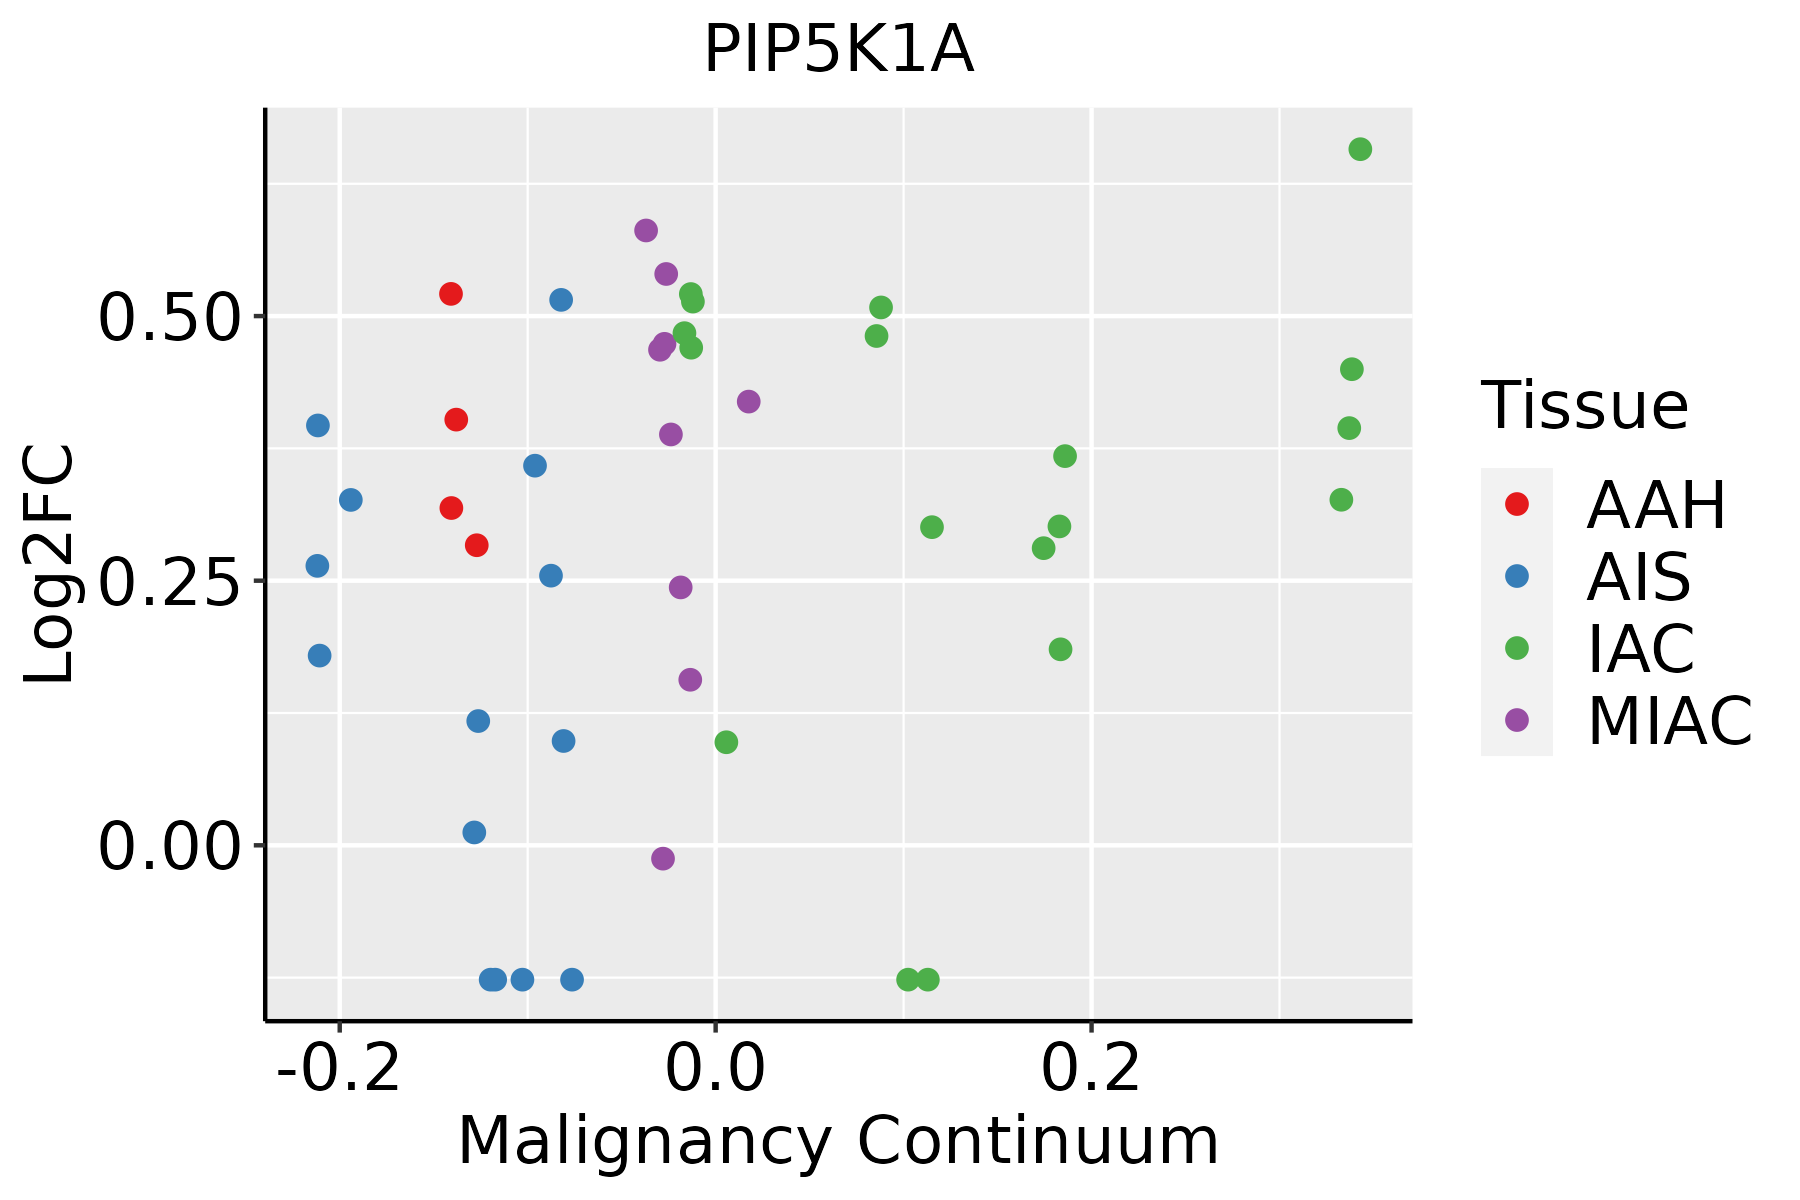 | AAH: Atypical adenomatous hyperplasia |
| AIS: Adenocarcinoma in situ | ||
| IAC: Invasive lung adenocarcinoma | ||
| MIA: Minimally invasive adenocarcinoma | ||
| Oral Cavity | 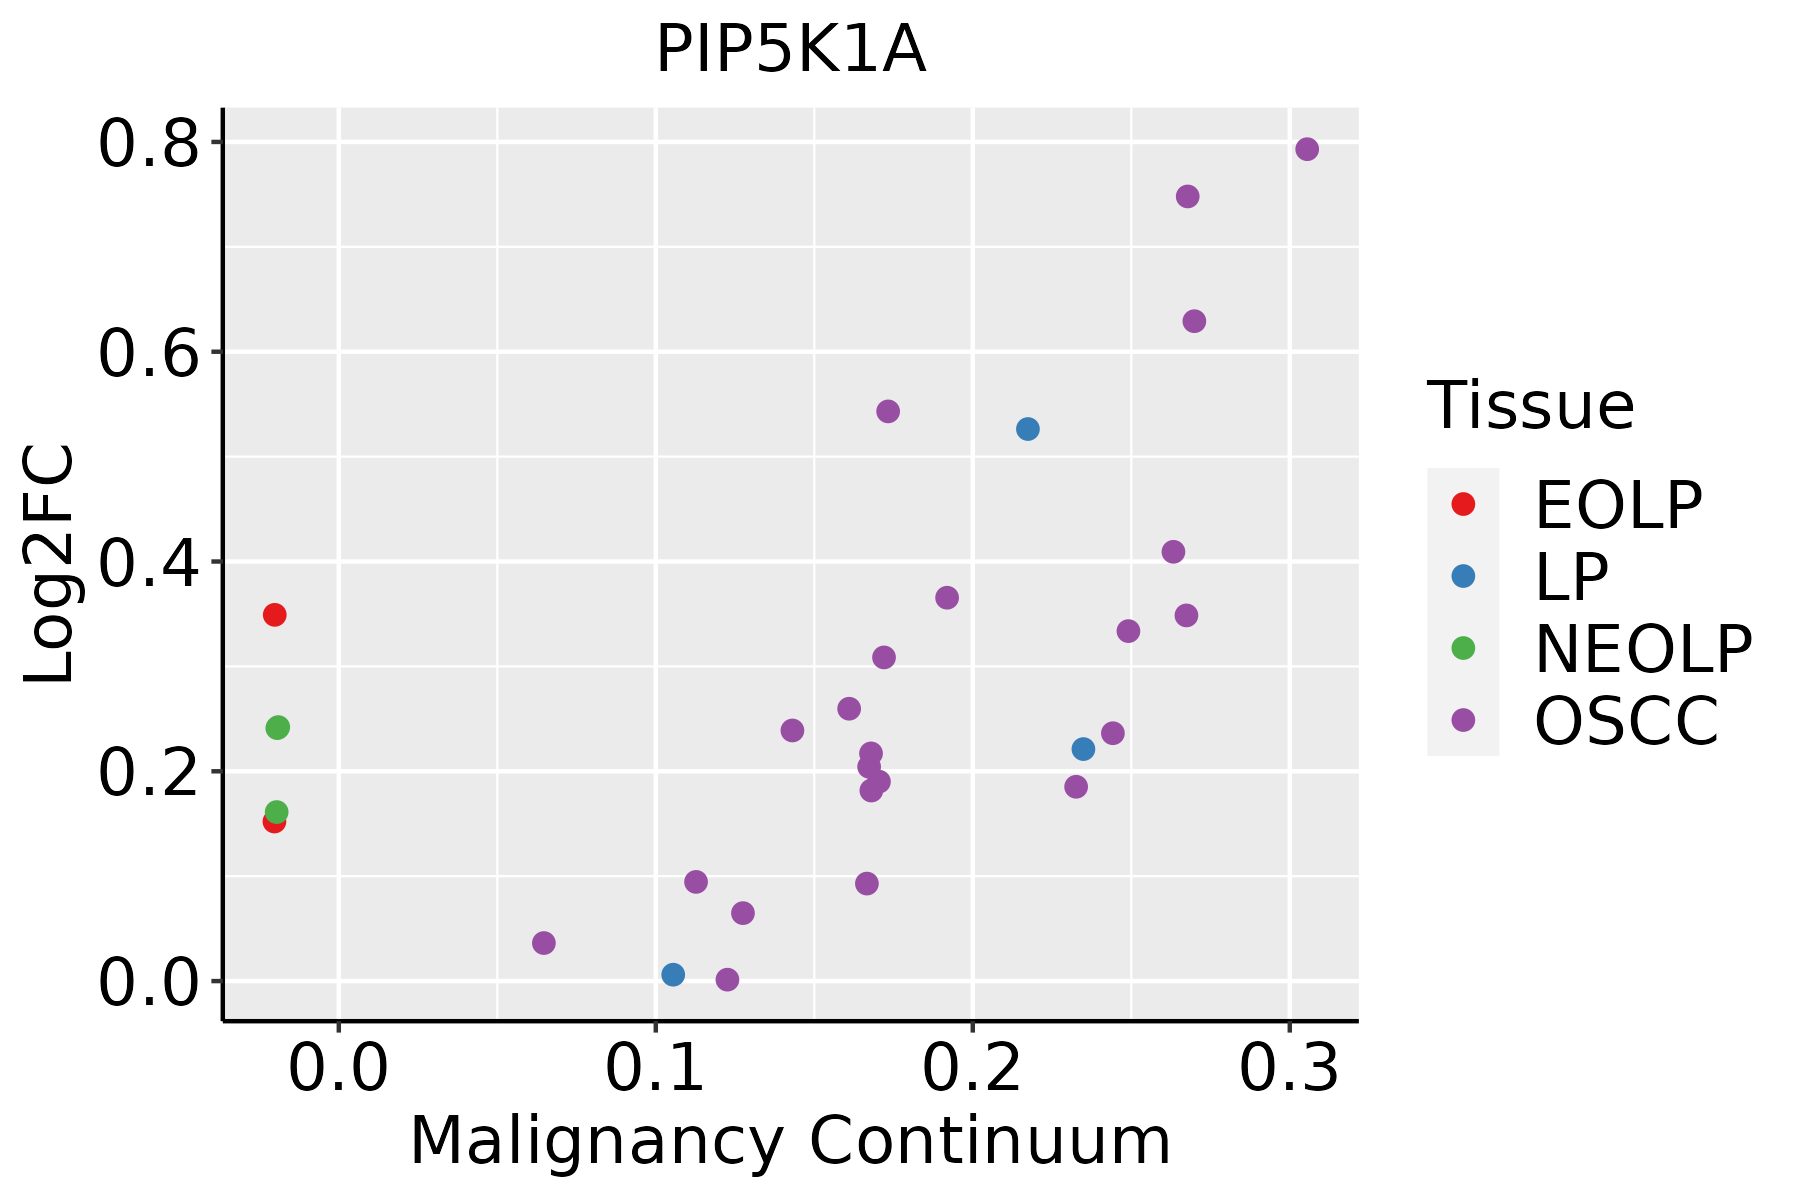 | EOLP: Erosive Oral lichen planus |
| LP: leukoplakia | ||
| NEOLP: Non-erosive oral lichen planus | ||
| OSCC: Oral squamous cell carcinoma | ||
| Prostate | 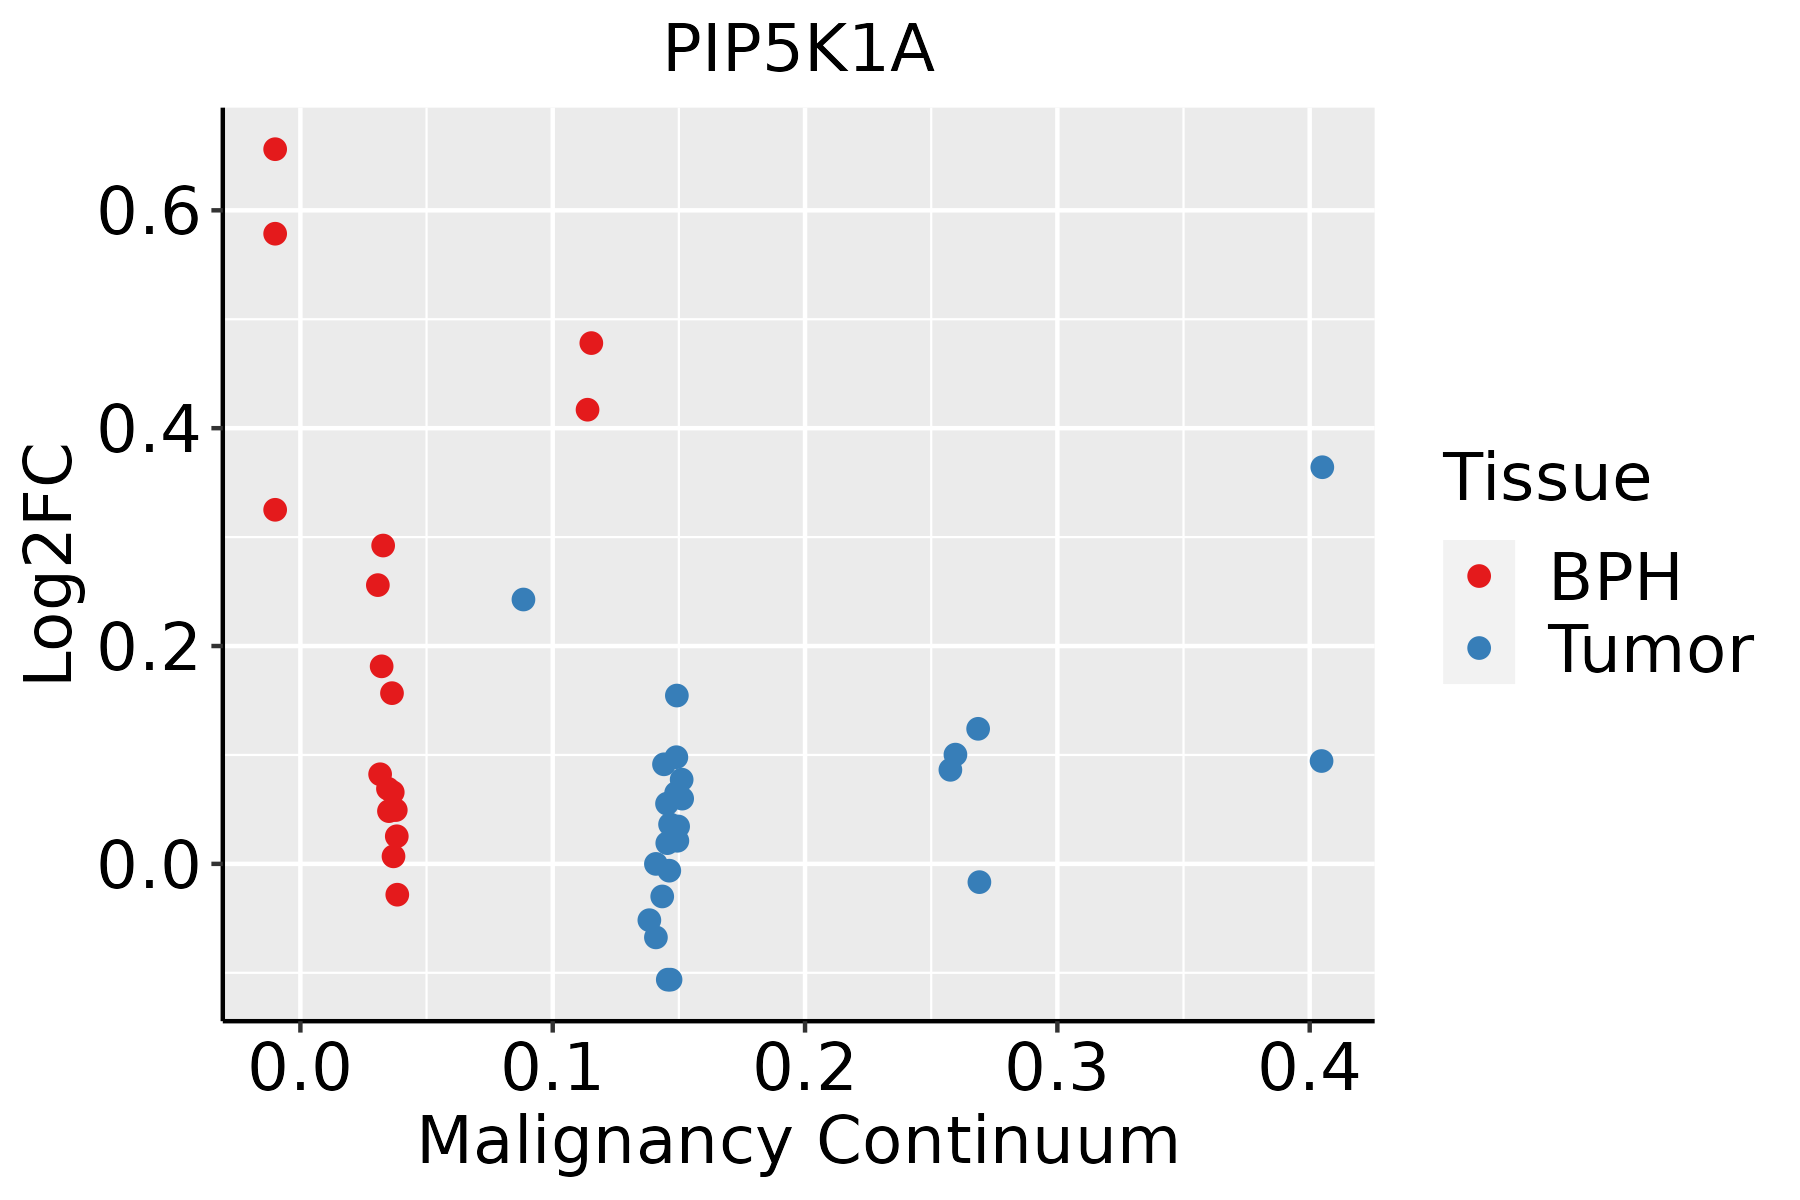 | BPH: Benign Prostatic Hyperplasia |
| Thyroid |  | ATC: Anaplastic thyroid cancer |
| HT: Hashimoto's thyroiditis | ||
| PTC: Papillary thyroid cancer |
| ∗log2FC in expression of this searched gene in stem-like cells from each diseased tissue sample relative to stem-like cells in normal samples in each tissue plotted against the malignancy continuum. Samples are colored based on if they are from different disease stage. |
Top |
Malignant transformation related pathway analysis |
| Find out the enriched GO biological processes and KEGG pathways involved in transition from healthy to precancer to cancer |
| Tissue | Disease Stage | Enriched GO biological Processes |
| Colorectum | AD |  |
| Colorectum | SER |  |
| Colorectum | MSS |  |
| Colorectum | MSI-H |  |
| Colorectum | FAP |  |
| ∗Top 15 enriched GO BP terms are showed in the bar plot of each disease state in each tissue. Each row represents a significant GO biological process which is colored according to the -log10(p.adjust). |
| Page: 1 2 3 4 5 6 7 8 9 |
| GO ID | Tissue | Disease Stage | Description | Gene Ratio | Bg Ratio | pvalue | p.adjust | Count |
| GO:00315898 | Cervix | CC | cell-substrate adhesion | 96/2311 | 363/18723 | 1.48e-13 | 8.85e-11 | 96 |
| GO:00016679 | Cervix | CC | ameboidal-type cell migration | 110/2311 | 475/18723 | 2.66e-11 | 6.36e-09 | 110 |
| GO:00085446 | Cervix | CC | epidermis development | 83/2311 | 324/18723 | 3.91e-11 | 8.54e-09 | 83 |
| GO:00435884 | Cervix | CC | skin development | 71/2311 | 263/18723 | 8.04e-11 | 1.46e-08 | 71 |
| GO:01501159 | Cervix | CC | cell-substrate junction organization | 37/2311 | 101/18723 | 3.20e-10 | 4.46e-08 | 37 |
| GO:007265910 | Cervix | CC | protein localization to plasma membrane | 73/2311 | 284/18723 | 4.95e-10 | 6.73e-08 | 73 |
| GO:00070448 | Cervix | CC | cell-substrate junction assembly | 34/2311 | 95/18723 | 3.35e-09 | 3.45e-07 | 34 |
| GO:19907788 | Cervix | CC | protein localization to cell periphery | 78/2311 | 333/18723 | 1.22e-08 | 9.73e-07 | 78 |
| GO:00071608 | Cervix | CC | cell-matrix adhesion | 60/2311 | 233/18723 | 1.58e-08 | 1.23e-06 | 60 |
| GO:00302164 | Cervix | CC | keratinocyte differentiation | 42/2311 | 139/18723 | 1.74e-08 | 1.28e-06 | 42 |
| GO:00603267 | Cervix | CC | cell chemotaxis | 73/2311 | 310/18723 | 2.82e-08 | 1.96e-06 | 73 |
| GO:00430877 | Cervix | CC | regulation of GTPase activity | 79/2311 | 348/18723 | 4.21e-08 | 2.60e-06 | 79 |
| GO:00099137 | Cervix | CC | epidermal cell differentiation | 53/2311 | 202/18723 | 5.48e-08 | 3.25e-06 | 53 |
| GO:00343298 | Cervix | CC | cell junction assembly | 88/2311 | 420/18723 | 3.42e-07 | 1.38e-05 | 88 |
| GO:00480417 | Cervix | CC | focal adhesion assembly | 28/2311 | 87/18723 | 9.86e-07 | 3.45e-05 | 28 |
| GO:00315328 | Cervix | CC | actin cytoskeleton reorganization | 31/2311 | 107/18723 | 3.34e-06 | 8.99e-05 | 31 |
| GO:00435476 | Cervix | CC | positive regulation of GTPase activity | 53/2311 | 255/18723 | 8.72e-05 | 1.16e-03 | 53 |
| GO:00107615 | Cervix | CC | fibroblast migration | 13/2311 | 47/18723 | 3.62e-03 | 2.31e-02 | 13 |
| GO:0006909 | Cervix | CC | phagocytosis | 53/2311 | 308/18723 | 7.49e-03 | 4.01e-02 | 53 |
| GO:0014065 | Cervix | CC | phosphatidylinositol 3-kinase signaling | 28/2311 | 144/18723 | 9.50e-03 | 4.72e-02 | 28 |
| Page: 1 2 3 4 5 6 7 8 9 10 11 12 13 14 15 |
| Pathway ID | Tissue | Disease Stage | Description | Gene Ratio | Bg Ratio | pvalue | p.adjust | qvalue | Count |
| hsa0451010 | Cervix | CC | Focal adhesion | 59/1267 | 203/8465 | 1.53e-07 | 1.84e-06 | 1.09e-06 | 59 |
| hsa0481016 | Cervix | CC | Regulation of actin cytoskeleton | 64/1267 | 229/8465 | 2.24e-07 | 2.59e-06 | 1.53e-06 | 64 |
| hsa0414418 | Cervix | CC | Endocytosis | 64/1267 | 251/8465 | 6.97e-06 | 6.10e-05 | 3.61e-05 | 64 |
| hsa0466612 | Cervix | CC | Fc gamma R-mediated phagocytosis | 31/1267 | 97/8465 | 1.78e-05 | 1.42e-04 | 8.40e-05 | 31 |
| hsa0513516 | Cervix | CC | Yersinia infection | 39/1267 | 137/8465 | 3.27e-05 | 2.41e-04 | 1.42e-04 | 39 |
| hsa0451014 | Cervix | CC | Focal adhesion | 59/1267 | 203/8465 | 1.53e-07 | 1.84e-06 | 1.09e-06 | 59 |
| hsa0481017 | Cervix | CC | Regulation of actin cytoskeleton | 64/1267 | 229/8465 | 2.24e-07 | 2.59e-06 | 1.53e-06 | 64 |
| hsa0414419 | Cervix | CC | Endocytosis | 64/1267 | 251/8465 | 6.97e-06 | 6.10e-05 | 3.61e-05 | 64 |
| hsa0466613 | Cervix | CC | Fc gamma R-mediated phagocytosis | 31/1267 | 97/8465 | 1.78e-05 | 1.42e-04 | 8.40e-05 | 31 |
| hsa0513517 | Cervix | CC | Yersinia infection | 39/1267 | 137/8465 | 3.27e-05 | 2.41e-04 | 1.42e-04 | 39 |
| hsa0451015 | Endometrium | AEH | Focal adhesion | 58/1197 | 203/8465 | 4.99e-08 | 7.37e-07 | 5.39e-07 | 58 |
| hsa0414420 | Endometrium | AEH | Endocytosis | 56/1197 | 251/8465 | 2.58e-04 | 2.15e-03 | 1.57e-03 | 56 |
| hsa0466614 | Endometrium | AEH | Fc gamma R-mediated phagocytosis | 27/1197 | 97/8465 | 3.02e-04 | 2.39e-03 | 1.75e-03 | 27 |
| hsa0481018 | Endometrium | AEH | Regulation of actin cytoskeleton | 50/1197 | 229/8465 | 9.08e-04 | 5.78e-03 | 4.23e-03 | 50 |
| hsa0451016 | Endometrium | AEH | Focal adhesion | 58/1197 | 203/8465 | 4.99e-08 | 7.37e-07 | 5.39e-07 | 58 |
| hsa04144110 | Endometrium | AEH | Endocytosis | 56/1197 | 251/8465 | 2.58e-04 | 2.15e-03 | 1.57e-03 | 56 |
| hsa0466615 | Endometrium | AEH | Fc gamma R-mediated phagocytosis | 27/1197 | 97/8465 | 3.02e-04 | 2.39e-03 | 1.75e-03 | 27 |
| hsa0481019 | Endometrium | AEH | Regulation of actin cytoskeleton | 50/1197 | 229/8465 | 9.08e-04 | 5.78e-03 | 4.23e-03 | 50 |
| hsa0451024 | Endometrium | EEC | Focal adhesion | 58/1237 | 203/8465 | 1.61e-07 | 2.30e-06 | 1.71e-06 | 58 |
| hsa0414424 | Endometrium | EEC | Endocytosis | 57/1237 | 251/8465 | 3.34e-04 | 2.82e-03 | 2.10e-03 | 57 |
| Page: 1 2 3 4 5 6 7 8 |
Top |
Cell-cell communication analysis |
| Identification of potential cell-cell interactions between two cell types and their ligand-receptor pairs for different disease states |
| Ligand | Receptor | LRpair | Pathway | Tissue | Disease Stage |
| Page: 1 |
Top |
Single-cell gene regulatory network inference analysis |
| Find out the significant the regulons (TFs) and the target genes of each regulon across cell types for different disease states |
| TF | Cell Type | Tissue | Disease Stage | Target Gene | RSS | Regulon Activity |
| ∗The dot plots of a searched regulon are shown for all cell subpopulations in each disease state of each tissue based on the regulon specific score inferred using pySCENIC and by calculating the average expression. |
| Page: 1 |
Top |
Somatic mutation of malignant transformation related genes |
| Annotation of somatic variants for genes involved in malignant transformation |
| Hugo Symbol | Variant Class | Variant Classification | dbSNP RS | HGVSc | HGVSp | HGVSp Short | SWISSPROT | BIOTYPE | SIFT | PolyPhen | Tumor Sample Barcode | Tissue | Histology | Sex | Age | Stage | Therapy Types | Drugs | Outcome |
| PIP5K1A | SNV | Missense_Mutation | c.83C>T | p.Ser28Leu | p.S28L | Q99755 | protein_coding | deleterious_low_confidence(0.01) | benign(0.011) | TCGA-AC-A23H-01 | Breast | breast invasive carcinoma | Female | >=65 | I/II | Unknown | Unknown | PD | |
| PIP5K1A | SNV | Missense_Mutation | novel | c.680N>G | p.Tyr227Cys | p.Y227C | Q99755 | protein_coding | deleterious(0) | possibly_damaging(0.745) | TCGA-AO-A0JC-01 | Breast | breast invasive carcinoma | Female | <65 | I/II | Chemotherapy | fluorouracil | SD |
| PIP5K1A | SNV | Missense_Mutation | c.1673C>T | p.Ser558Leu | p.S558L | Q99755 | protein_coding | deleterious_low_confidence(0) | benign(0) | TCGA-BH-A209-01 | Breast | breast invasive carcinoma | Female | >=65 | I/II | Unknown | Unknown | SD | |
| PIP5K1A | SNV | Missense_Mutation | rs763944215 | c.1390C>T | p.Arg464Trp | p.R464W | Q99755 | protein_coding | deleterious(0.01) | benign(0.049) | TCGA-C8-A26Y-01 | Breast | breast invasive carcinoma | Female | >=65 | I/II | Unknown | Unknown | SD |
| PIP5K1A | SNV | Missense_Mutation | c.1163N>T | p.Ala388Val | p.A388V | Q99755 | protein_coding | deleterious(0.01) | possibly_damaging(0.641) | TCGA-D8-A27G-01 | Breast | breast invasive carcinoma | Female | >=65 | I/II | Unknown | Unknown | SD | |
| PIP5K1A | SNV | Missense_Mutation | novel | c.118G>A | p.Glu40Lys | p.E40K | Q99755 | protein_coding | deleterious_low_confidence(0.02) | benign(0.05) | TCGA-PE-A5DE-01 | Breast | breast invasive carcinoma | Female | <65 | I/II | Chemotherapy | taxotere | CR |
| PIP5K1A | insertion | In_Frame_Ins | novel | c.594_595insCAG | p.His198_Lys199insGln | p.H198_K199insQ | Q99755 | protein_coding | TCGA-E9-A243-01 | Breast | breast invasive carcinoma | Female | <65 | I/II | Chemotherapy | 5-fluorouracil | PD | ||
| PIP5K1A | insertion | Frame_Shift_Ins | novel | c.596_597insGGGGCAGGGGGAGCATGATGGAGACAAGATCGTGGGAC | p.Glu200GlyfsTer27 | p.E200Gfs*27 | Q99755 | protein_coding | TCGA-E9-A243-01 | Breast | breast invasive carcinoma | Female | <65 | I/II | Chemotherapy | 5-fluorouracil | PD | ||
| PIP5K1A | deletion | Frame_Shift_Del | novel | c.1260delA | p.Ala421ProfsTer35 | p.A421Pfs*35 | Q99755 | protein_coding | TCGA-EW-A2FV-01 | Breast | breast invasive carcinoma | Female | <65 | III/IV | Chemotherapy | docetaxel | SD | ||
| PIP5K1A | SNV | Missense_Mutation | novel | c.835C>T | p.Pro279Ser | p.P279S | Q99755 | protein_coding | deleterious(0) | possibly_damaging(0.766) | TCGA-GH-A9DA-01 | Cervix | cervical & endocervical cancer | Female | <65 | I/II | Unknown | Unknown | SD |
| Page: 1 2 3 4 5 6 |
Top |
Related drugs of malignant transformation related genes |
| Identification of chemicals and drugs interact with genes involved in malignant transfromation |
| (DGIdb 4.0) |
| Entrez ID | Symbol | Category | Interaction Types | Drug Claim Name | Drug Name | PMIDs |
| 8394 | PIP5K1A | KINASE, DRUGGABLE GENOME, ENZYME | inhibitor | 252166654 |
| Page: 1 |

Copyright 2023-Present -The University of Texas Health Science Center at Houston |