
|
|||||
|
 | |
| |
| |
| |
| |
| |
|
Gene: PIP4K2B |
Gene summary for PIP4K2B |
| Gene information | Species | Human | Gene symbol | PIP4K2B | Gene ID | 8396 |
| Gene name | phosphatidylinositol-5-phosphate 4-kinase type 2 beta | |
| Gene Alias | PI5P4KB | |
| Cytomap | 17q12 | |
| Gene Type | protein-coding | GO ID | GO:0000045 | UniProtAcc | P78356 |
Top |
Malignant transformation analysis |
| Identification of the aberrant gene expression in precancerous and cancerous lesions by comparing the gene expression of stem-like cells in diseased tissues with normal stem cells |
| Entrez ID | Symbol | Replicates | Species | Organ | Tissue | Adj P-value | Log2FC | Malignancy |
| 8396 | PIP4K2B | GSM4909290 | Human | Breast | IDC | 2.89e-32 | 6.94e-01 | 0.2096 |
| 8396 | PIP4K2B | GSM4909292 | Human | Breast | IDC | 2.21e-05 | 6.67e-01 | 0.1236 |
| 8396 | PIP4K2B | GSM4909293 | Human | Breast | IDC | 1.22e-11 | 2.88e-01 | 0.1581 |
| 8396 | PIP4K2B | DCIS2 | Human | Breast | DCIS | 3.79e-13 | 5.48e-02 | 0.0085 |
| 8396 | PIP4K2B | HCC1_Meng | Human | Liver | HCC | 1.33e-15 | 2.27e-02 | 0.0246 |
| 8396 | PIP4K2B | HCC2_Meng | Human | Liver | HCC | 1.39e-03 | 8.36e-02 | 0.0107 |
| 8396 | PIP4K2B | HCC1 | Human | Liver | HCC | 1.40e-09 | 2.14e+00 | 0.5336 |
| 8396 | PIP4K2B | HCC2 | Human | Liver | HCC | 1.72e-10 | 2.85e+00 | 0.5341 |
| 8396 | PIP4K2B | S014 | Human | Liver | HCC | 7.09e-17 | 4.59e-01 | 0.2254 |
| 8396 | PIP4K2B | S015 | Human | Liver | HCC | 5.47e-19 | 5.76e-01 | 0.2375 |
| 8396 | PIP4K2B | S016 | Human | Liver | HCC | 9.30e-20 | 5.15e-01 | 0.2243 |
| 8396 | PIP4K2B | S027 | Human | Liver | HCC | 6.56e-04 | 3.01e-01 | 0.2446 |
| 8396 | PIP4K2B | S028 | Human | Liver | HCC | 3.17e-13 | 4.62e-01 | 0.2503 |
| 8396 | PIP4K2B | S029 | Human | Liver | HCC | 1.46e-14 | 4.49e-01 | 0.2581 |
| 8396 | PIP4K2B | Dong_P1 | Human | Prostate | Tumor | 6.46e-06 | 6.96e-02 | 0.035 |
| 8396 | PIP4K2B | Dong_P3 | Human | Prostate | Tumor | 2.14e-06 | 1.44e-01 | 0.0278 |
| 8396 | PIP4K2B | Dong_P5 | Human | Prostate | Tumor | 1.16e-03 | 5.32e-02 | 0.053 |
| 8396 | PIP4K2B | GSM5353217_PA_PB1A_Pool_2_S107_L004 | Human | Prostate | Tumor | 2.43e-02 | 6.97e-01 | 0.156 |
| 8396 | PIP4K2B | GSM5353221_PA_PB2A_Pool_1_3_S25_L001 | Human | Prostate | Tumor | 1.84e-04 | 3.00e-01 | 0.1633 |
| 8396 | PIP4K2B | GSM5353222_PA_PB2B_Pool_1_3_S52_L002 | Human | Prostate | Tumor | 5.32e-09 | 4.02e-01 | 0.1608 |
| Page: 1 2 |
| Tissue | Expression Dynamics | Abbreviation |
| Breast | 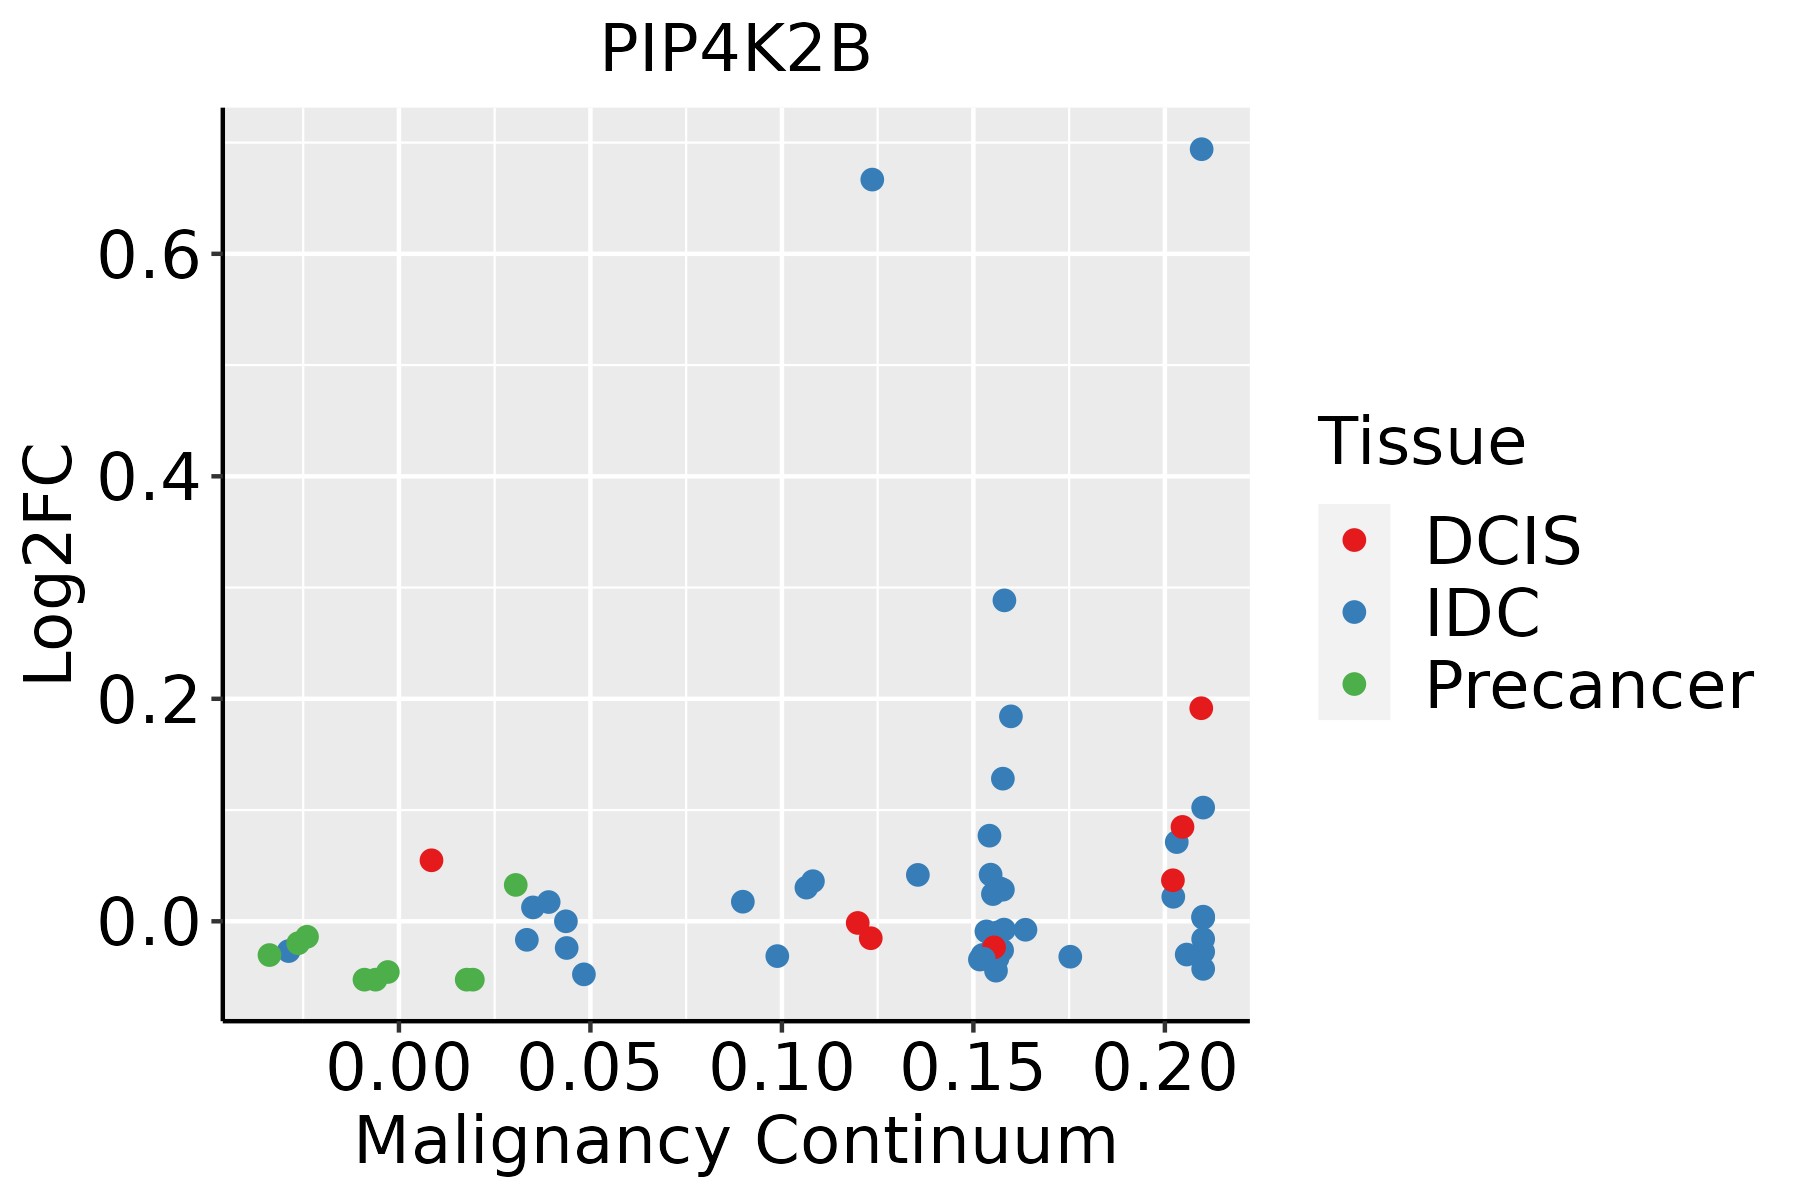 | IDC: Invasive ductal carcinoma |
| DCIS: Ductal carcinoma in situ | ||
| Precancer(BRCA1-mut): Precancerous lesion from BRCA1 mutation carriers | ||
| Liver |  | HCC: Hepatocellular carcinoma |
| NAFLD: Non-alcoholic fatty liver disease | ||
| Prostate | 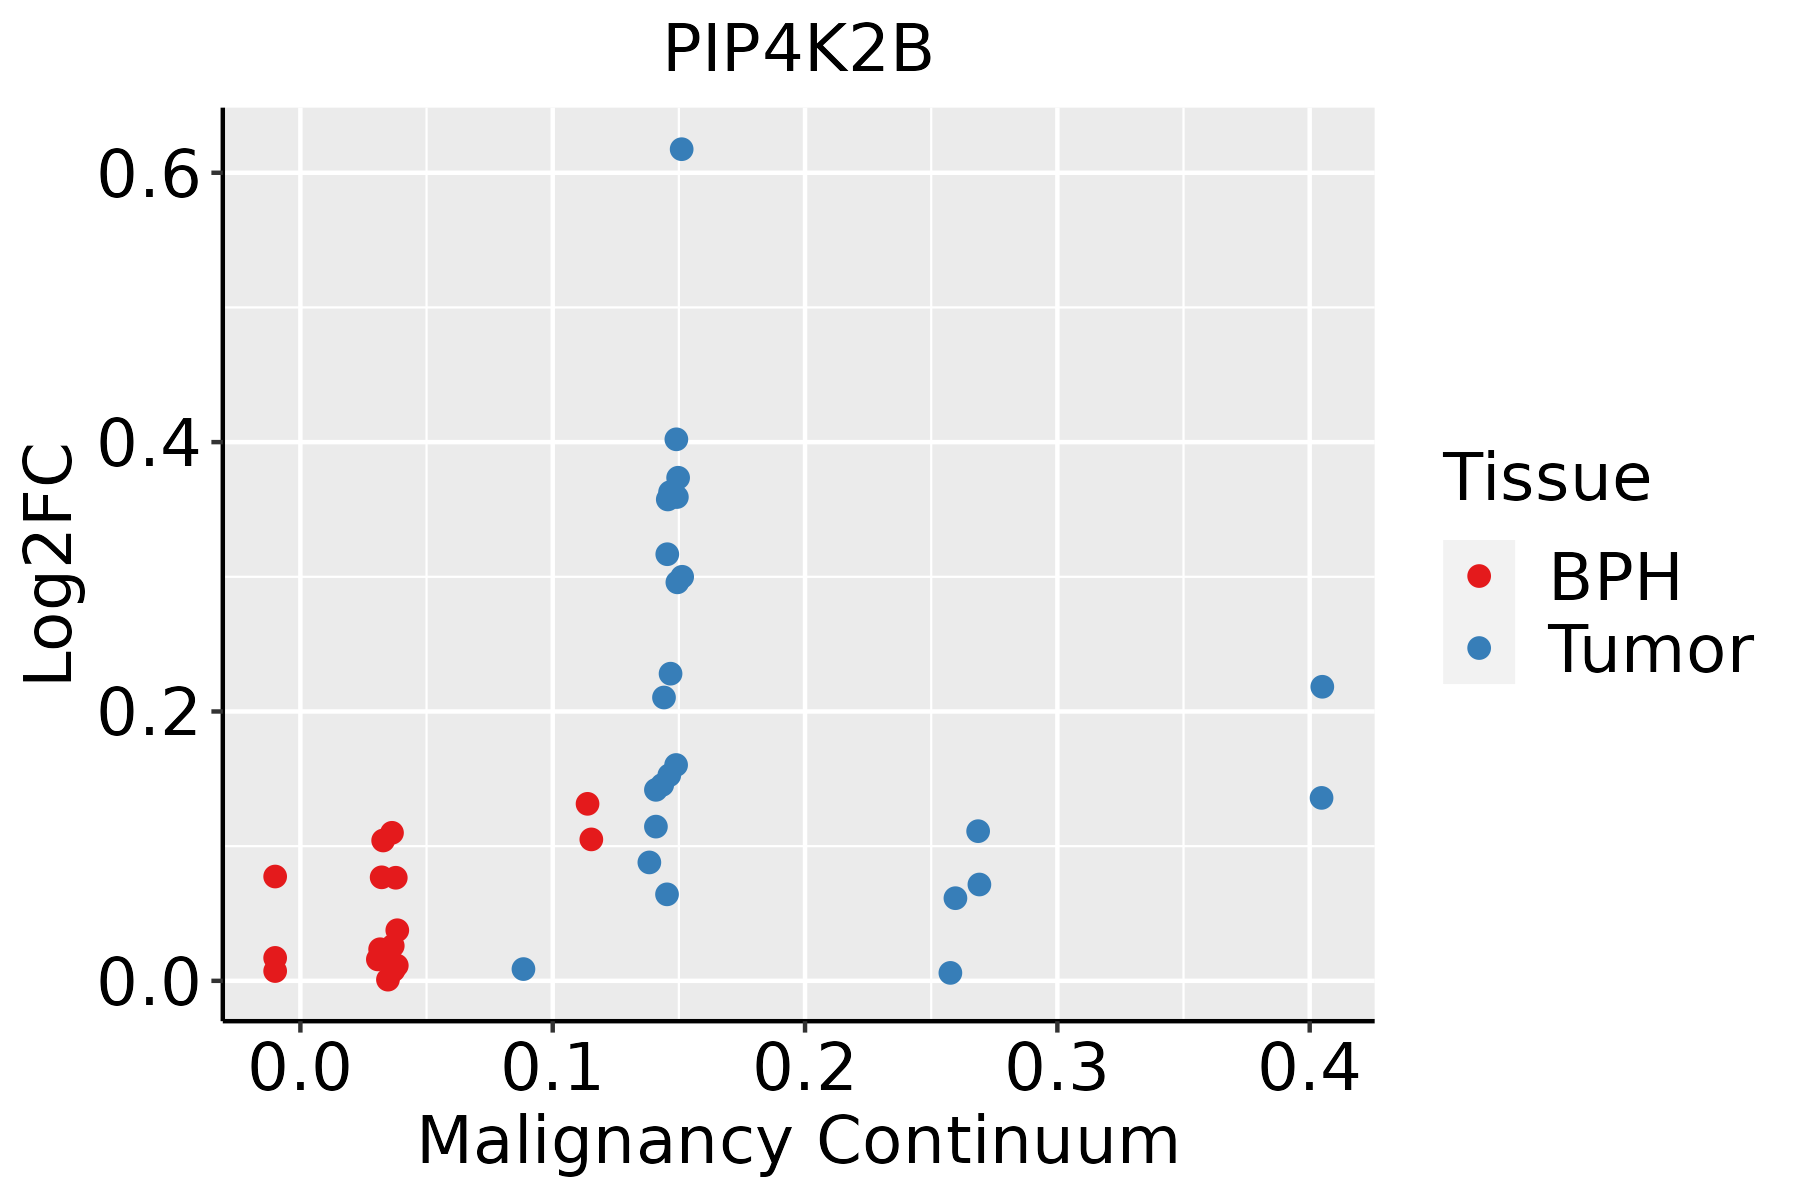 | BPH: Benign Prostatic Hyperplasia |
| ∗log2FC in expression of this searched gene in stem-like cells from each diseased tissue sample relative to stem-like cells in normal samples in each tissue plotted against the malignancy continuum. Samples are colored based on if they are from different disease stage. |
Top |
Malignant transformation related pathway analysis |
| Find out the enriched GO biological processes and KEGG pathways involved in transition from healthy to precancer to cancer |
| Tissue | Disease Stage | Enriched GO biological Processes |
| Colorectum | AD |  |
| Colorectum | SER |  |
| Colorectum | MSS |  |
| Colorectum | MSI-H |  |
| Colorectum | FAP |  |
| ∗Top 15 enriched GO BP terms are showed in the bar plot of each disease state in each tissue. Each row represents a significant GO biological process which is colored according to the -log10(p.adjust). |
| Page: 1 2 3 4 5 6 7 8 9 |
| GO ID | Tissue | Disease Stage | Description | Gene Ratio | Bg Ratio | pvalue | p.adjust | Count |
| GO:000989614 | Breast | IDC | positive regulation of catabolic process | 62/1434 | 492/18723 | 7.06e-05 | 1.42e-03 | 62 |
| GO:005134814 | Breast | IDC | negative regulation of transferase activity | 39/1434 | 268/18723 | 7.89e-05 | 1.56e-03 | 39 |
| GO:00434348 | Breast | IDC | response to peptide hormone | 54/1434 | 414/18723 | 8.25e-05 | 1.61e-03 | 54 |
| GO:001921612 | Breast | IDC | regulation of lipid metabolic process | 45/1434 | 331/18723 | 1.21e-04 | 2.24e-03 | 45 |
| GO:003133114 | Breast | IDC | positive regulation of cellular catabolic process | 54/1434 | 427/18723 | 1.85e-04 | 3.07e-03 | 54 |
| GO:00459369 | Breast | IDC | negative regulation of phosphate metabolic process | 53/1434 | 441/18723 | 7.21e-04 | 8.79e-03 | 53 |
| GO:00105639 | Breast | IDC | negative regulation of phosphorus metabolic process | 53/1434 | 442/18723 | 7.60e-04 | 9.25e-03 | 53 |
| GO:00328687 | Breast | IDC | response to insulin | 32/1434 | 264/18723 | 6.61e-03 | 4.62e-02 | 32 |
| GO:00328697 | Breast | IDC | cellular response to insulin stimulus | 26/1434 | 203/18723 | 6.74e-03 | 4.68e-02 | 26 |
| GO:005134824 | Breast | DCIS | negative regulation of transferase activity | 39/1390 | 268/18723 | 4.02e-05 | 8.60e-04 | 39 |
| GO:000989624 | Breast | DCIS | positive regulation of catabolic process | 61/1390 | 492/18723 | 5.32e-05 | 1.09e-03 | 61 |
| GO:003133124 | Breast | DCIS | positive regulation of cellular catabolic process | 54/1390 | 427/18723 | 8.34e-05 | 1.58e-03 | 54 |
| GO:004343414 | Breast | DCIS | response to peptide hormone | 52/1390 | 414/18723 | 1.33e-04 | 2.28e-03 | 52 |
| GO:001921621 | Breast | DCIS | regulation of lipid metabolic process | 43/1390 | 331/18723 | 2.37e-04 | 3.71e-03 | 43 |
| GO:004593614 | Breast | DCIS | negative regulation of phosphate metabolic process | 53/1390 | 441/18723 | 3.48e-04 | 4.96e-03 | 53 |
| GO:001056314 | Breast | DCIS | negative regulation of phosphorus metabolic process | 53/1390 | 442/18723 | 3.68e-04 | 5.18e-03 | 53 |
| GO:003286813 | Breast | DCIS | response to insulin | 32/1390 | 264/18723 | 4.20e-03 | 3.31e-02 | 32 |
| GO:003286913 | Breast | DCIS | cellular response to insulin stimulus | 26/1390 | 203/18723 | 4.53e-03 | 3.47e-02 | 26 |
| GO:00423269 | Breast | DCIS | negative regulation of phosphorylation | 43/1390 | 385/18723 | 4.78e-03 | 3.62e-02 | 43 |
| GO:00336738 | Breast | DCIS | negative regulation of kinase activity | 29/1390 | 237/18723 | 5.44e-03 | 3.99e-02 | 29 |
| Page: 1 2 3 4 5 |
| Pathway ID | Tissue | Disease Stage | Description | Gene Ratio | Bg Ratio | pvalue | p.adjust | qvalue | Count |
| hsa0481014 | Breast | IDC | Regulation of actin cytoskeleton | 36/867 | 229/8465 | 5.79e-03 | 3.13e-02 | 2.34e-02 | 36 |
| hsa0481015 | Breast | IDC | Regulation of actin cytoskeleton | 36/867 | 229/8465 | 5.79e-03 | 3.13e-02 | 2.34e-02 | 36 |
| hsa0481023 | Breast | DCIS | Regulation of actin cytoskeleton | 35/846 | 229/8465 | 6.89e-03 | 3.37e-02 | 2.48e-02 | 35 |
| hsa0481033 | Breast | DCIS | Regulation of actin cytoskeleton | 35/846 | 229/8465 | 6.89e-03 | 3.37e-02 | 2.48e-02 | 35 |
| hsa0481041 | Liver | HCC | Regulation of actin cytoskeleton | 134/4020 | 229/8465 | 4.48e-04 | 1.94e-03 | 1.08e-03 | 134 |
| hsa0481051 | Liver | HCC | Regulation of actin cytoskeleton | 134/4020 | 229/8465 | 4.48e-04 | 1.94e-03 | 1.08e-03 | 134 |
| hsa0481025 | Prostate | Tumor | Regulation of actin cytoskeleton | 84/1791 | 229/8465 | 3.40e-08 | 4.17e-07 | 2.58e-07 | 84 |
| hsa0481035 | Prostate | Tumor | Regulation of actin cytoskeleton | 84/1791 | 229/8465 | 3.40e-08 | 4.17e-07 | 2.58e-07 | 84 |
| Page: 1 |
Top |
Cell-cell communication analysis |
| Identification of potential cell-cell interactions between two cell types and their ligand-receptor pairs for different disease states |
| Ligand | Receptor | LRpair | Pathway | Tissue | Disease Stage |
| Page: 1 |
Top |
Single-cell gene regulatory network inference analysis |
| Find out the significant the regulons (TFs) and the target genes of each regulon across cell types for different disease states |
| TF | Cell Type | Tissue | Disease Stage | Target Gene | RSS | Regulon Activity |
| ∗The dot plots of a searched regulon are shown for all cell subpopulations in each disease state of each tissue based on the regulon specific score inferred using pySCENIC and by calculating the average expression. |
| Page: 1 |
Top |
Somatic mutation of malignant transformation related genes |
| Annotation of somatic variants for genes involved in malignant transformation |
| Hugo Symbol | Variant Class | Variant Classification | dbSNP RS | HGVSc | HGVSp | HGVSp Short | SWISSPROT | BIOTYPE | SIFT | PolyPhen | Tumor Sample Barcode | Tissue | Histology | Sex | Age | Stage | Therapy Types | Drugs | Outcome |
| PIP4K2B | insertion | Frame_Shift_Ins | novel | c.630_631insTTAGCATCCATCAGGCCCCCATGGACTGCCAGCACAA | p.Val211LeufsTer18 | p.V211Lfs*18 | P78356 | protein_coding | TCGA-BH-A0B3-01 | Breast | breast invasive carcinoma | Female | <65 | I/II | Chemotherapy | cyclophosphamide | SD | ||
| PIP4K2B | SNV | Missense_Mutation | novel | c.373N>A | p.Ala125Thr | p.A125T | P78356 | protein_coding | tolerated(0.17) | benign(0.227) | TCGA-2W-A8YY-01 | Cervix | cervical & endocervical cancer | Female | <65 | I/II | Chemotherapy | cisplatin | CR |
| PIP4K2B | SNV | Missense_Mutation | novel | c.1053N>A | p.Met351Ile | p.M351I | P78356 | protein_coding | tolerated(1) | benign(0) | TCGA-VS-A952-01 | Cervix | cervical & endocervical cancer | Female | >=65 | I/II | Unknown | Unknown | SD |
| PIP4K2B | SNV | Missense_Mutation | rs746600285 | c.913G>A | p.Glu305Lys | p.E305K | P78356 | protein_coding | tolerated(0.11) | benign(0.23) | TCGA-VS-A959-01 | Cervix | cervical & endocervical cancer | Female | >=65 | I/II | Unknown | Unknown | SD |
| PIP4K2B | SNV | Missense_Mutation | novel | c.610N>A | p.Val204Met | p.V204M | P78356 | protein_coding | tolerated(0.32) | benign(0.297) | TCGA-A6-2672-01 | Colorectum | colon adenocarcinoma | Female | >=65 | III/IV | Unknown | Unknown | SD |
| PIP4K2B | SNV | Missense_Mutation | novel | c.515T>C | p.Val172Ala | p.V172A | P78356 | protein_coding | deleterious(0) | probably_damaging(0.988) | TCGA-AA-3831-01 | Colorectum | colon adenocarcinoma | Male | >=65 | I/II | Unknown | Unknown | SD |
| PIP4K2B | SNV | Missense_Mutation | novel | c.1157N>T | p.Thr386Met | p.T386M | P78356 | protein_coding | deleterious(0) | probably_damaging(0.994) | TCGA-AA-3852-01 | Colorectum | colon adenocarcinoma | Male | >=65 | I/II | Unknown | Unknown | PD |
| PIP4K2B | SNV | Missense_Mutation | novel | c.437N>A | p.Arg146His | p.R146H | P78356 | protein_coding | tolerated(0.59) | probably_damaging(0.932) | TCGA-AA-3864-01 | Colorectum | colon adenocarcinoma | Male | >=65 | I/II | Unknown | Unknown | SD |
| PIP4K2B | SNV | Missense_Mutation | novel | c.437N>A | p.Arg146His | p.R146H | P78356 | protein_coding | tolerated(0.59) | probably_damaging(0.932) | TCGA-AZ-4315-01 | Colorectum | colon adenocarcinoma | Male | <65 | I/II | Unknown | Unknown | SD |
| PIP4K2B | SNV | Missense_Mutation | novel | c.527G>A | p.Gly176Asp | p.G176D | P78356 | protein_coding | deleterious(0.02) | possibly_damaging(0.903) | TCGA-CM-5861-01 | Colorectum | colon adenocarcinoma | Female | <65 | I/II | Unknown | Unknown | PD |
| Page: 1 2 3 4 5 |
Top |
Related drugs of malignant transformation related genes |
| Identification of chemicals and drugs interact with genes involved in malignant transfromation |
| (DGIdb 4.0) |
| Entrez ID | Symbol | Category | Interaction Types | Drug Claim Name | Drug Name | PMIDs |
| Page: 1 |

Copyright 2023-Present -The University of Texas Health Science Center at Houston |