
|
|||||
|
 | |
| |
| |
| |
| |
| |
|
Gene: PIP |
Gene summary for PIP |
| Gene information | Species | Human | Gene symbol | PIP | Gene ID | 5304 |
| Gene name | prolactin induced protein | |
| Gene Alias | GCDFP-15 | |
| Cytomap | 7q34 | |
| Gene Type | protein-coding | GO ID | GO:0001580 | UniProtAcc | P12273 |
Top |
Malignant transformation analysis |
| Identification of the aberrant gene expression in precancerous and cancerous lesions by comparing the gene expression of stem-like cells in diseased tissues with normal stem cells |
| Entrez ID | Symbol | Replicates | Species | Organ | Tissue | Adj P-value | Log2FC | Malignancy |
| 5304 | PIP | GSM4909281 | Human | Breast | IDC | 3.69e-10 | -2.84e-01 | 0.21 |
| 5304 | PIP | GSM4909282 | Human | Breast | IDC | 1.75e-09 | -2.77e-01 | -0.0288 |
| 5304 | PIP | GSM4909285 | Human | Breast | IDC | 5.79e-09 | -2.80e-01 | 0.21 |
| 5304 | PIP | GSM4909286 | Human | Breast | IDC | 8.04e-10 | -2.84e-01 | 0.1081 |
| 5304 | PIP | GSM4909287 | Human | Breast | IDC | 1.48e-06 | -2.04e-01 | 0.2057 |
| 5304 | PIP | GSM4909291 | Human | Breast | IDC | 7.33e-08 | -2.84e-01 | 0.1753 |
| 5304 | PIP | GSM4909293 | Human | Breast | IDC | 2.04e-25 | 7.59e-01 | 0.1581 |
| 5304 | PIP | GSM4909294 | Human | Breast | IDC | 3.22e-27 | 9.22e-01 | 0.2022 |
| 5304 | PIP | GSM4909295 | Human | Breast | IDC | 6.18e-04 | -2.52e-01 | 0.0898 |
| 5304 | PIP | GSM4909296 | Human | Breast | IDC | 6.85e-57 | 1.50e+00 | 0.1524 |
| 5304 | PIP | GSM4909297 | Human | Breast | IDC | 2.23e-05 | -2.13e-01 | 0.1517 |
| 5304 | PIP | GSM4909299 | Human | Breast | IDC | 2.21e-03 | 2.52e-01 | 0.035 |
| 5304 | PIP | GSM4909302 | Human | Breast | IDC | 3.69e-10 | 7.59e-01 | 0.1545 |
| 5304 | PIP | GSM4909303 | Human | Breast | IDC | 8.97e-03 | 7.52e-01 | 0.0438 |
| 5304 | PIP | GSM4909306 | Human | Breast | IDC | 4.31e-07 | -2.75e-01 | 0.1564 |
| 5304 | PIP | GSM4909307 | Human | Breast | IDC | 4.65e-65 | 1.42e+00 | 0.1569 |
| 5304 | PIP | GSM4909308 | Human | Breast | IDC | 1.04e-112 | 1.84e+00 | 0.158 |
| 5304 | PIP | GSM4909309 | Human | Breast | IDC | 1.48e-07 | -2.56e-01 | 0.0483 |
| 5304 | PIP | GSM4909311 | Human | Breast | IDC | 8.49e-08 | -2.33e-01 | 0.1534 |
| 5304 | PIP | GSM4909312 | Human | Breast | IDC | 1.12e-04 | 4.62e-01 | 0.1552 |
| Page: 1 2 |
| Tissue | Expression Dynamics | Abbreviation |
| Breast | 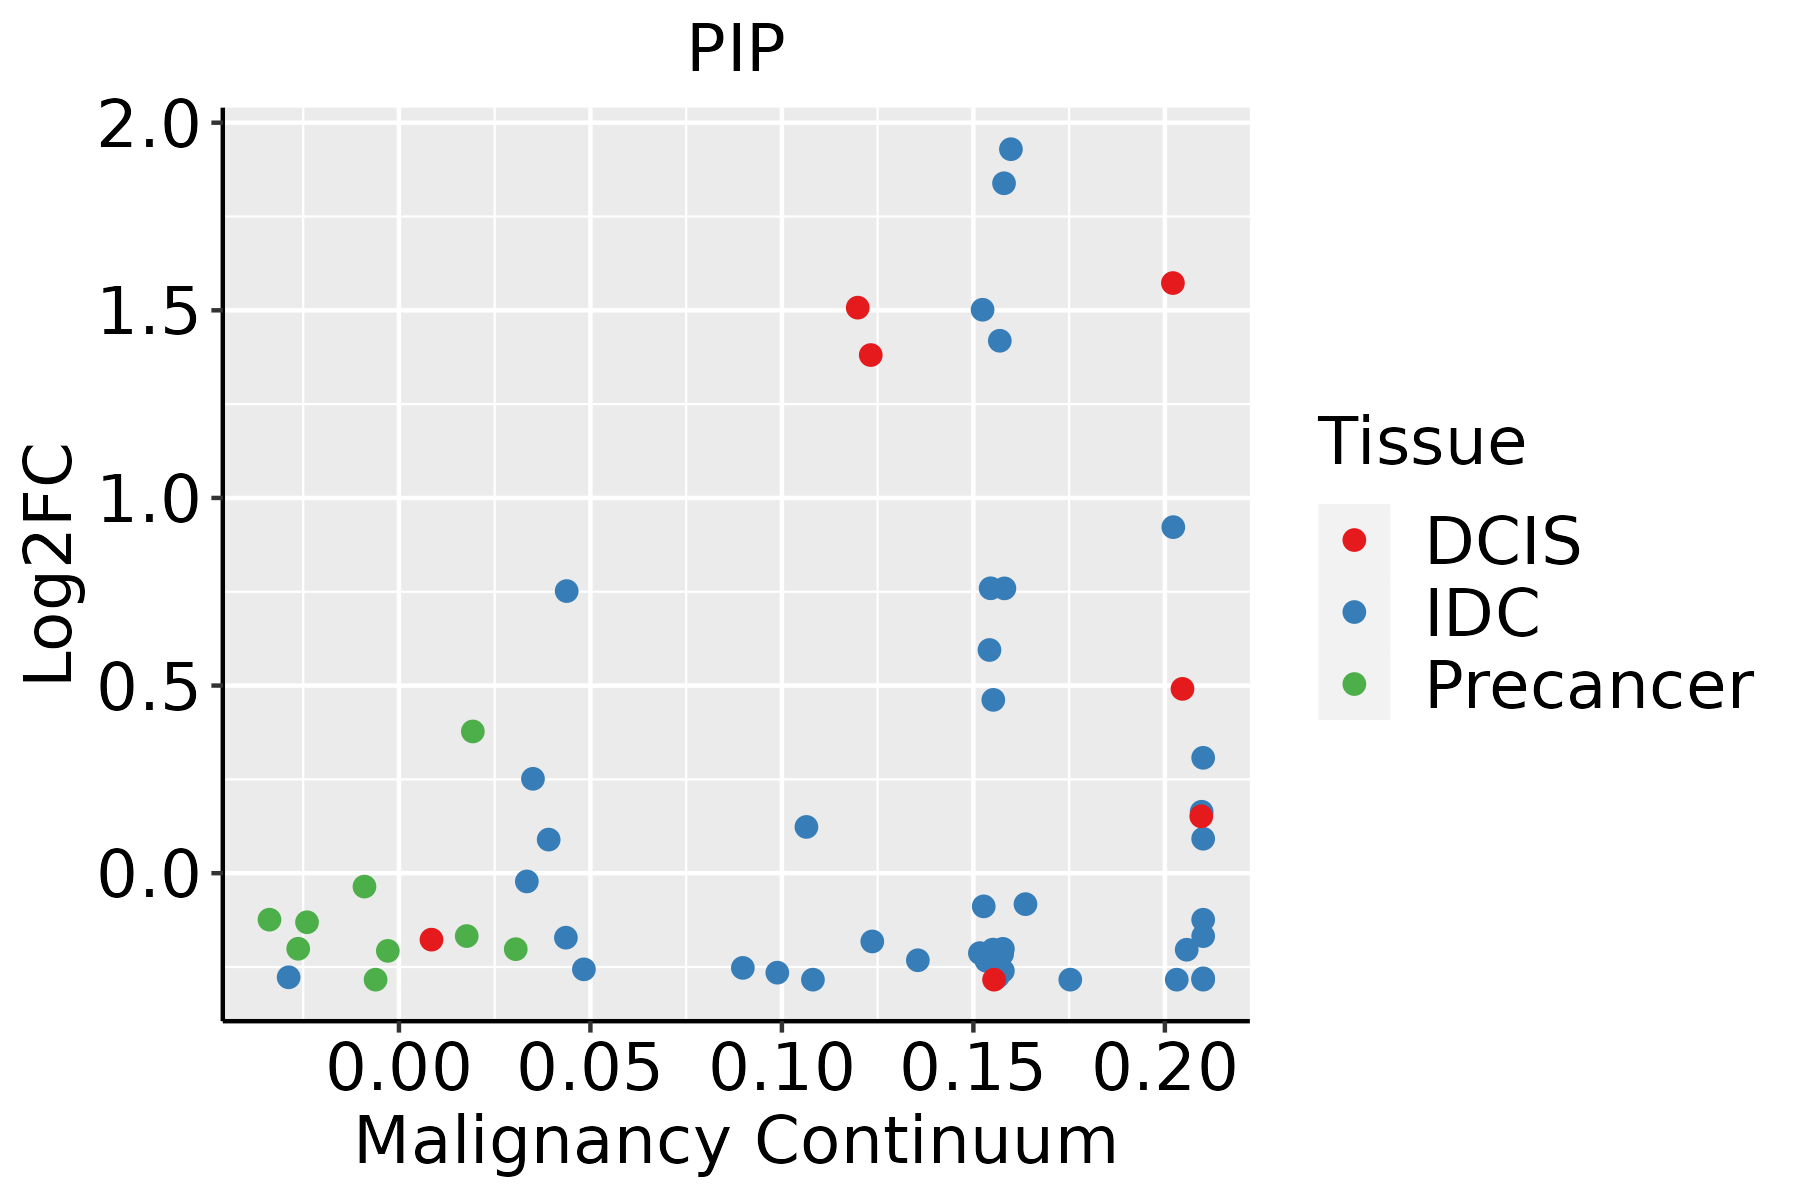 | IDC: Invasive ductal carcinoma |
| DCIS: Ductal carcinoma in situ | ||
| Precancer(BRCA1-mut): Precancerous lesion from BRCA1 mutation carriers |
| ∗log2FC in expression of this searched gene in stem-like cells from each diseased tissue sample relative to stem-like cells in normal samples in each tissue plotted against the malignancy continuum. Samples are colored based on if they are from different disease stage. |
Top |
Malignant transformation related pathway analysis |
| Find out the enriched GO biological processes and KEGG pathways involved in transition from healthy to precancer to cancer |
| Tissue | Disease Stage | Enriched GO biological Processes |
| Colorectum | AD |  |
| Colorectum | SER |  |
| Colorectum | MSS |  |
| Colorectum | MSI-H |  |
| Colorectum | FAP |  |
| ∗Top 15 enriched GO BP terms are showed in the bar plot of each disease state in each tissue. Each row represents a significant GO biological process which is colored according to the -log10(p.adjust). |
| Page: 1 2 3 4 5 6 7 8 9 |
| GO ID | Tissue | Disease Stage | Description | Gene Ratio | Bg Ratio | pvalue | p.adjust | Count |
| GO:00018956 | Breast | Precancer | retina homeostasis | 12/1080 | 79/18723 | 1.82e-03 | 1.79e-02 | 12 |
| GO:00018948 | Breast | Precancer | tissue homeostasis | 27/1080 | 268/18723 | 3.49e-03 | 2.90e-02 | 27 |
| GO:2000106 | Breast | Precancer | regulation of leukocyte apoptotic process | 11/1080 | 81/18723 | 6.65e-03 | 4.57e-02 | 11 |
| GO:000989614 | Breast | IDC | positive regulation of catabolic process | 62/1434 | 492/18723 | 7.06e-05 | 1.42e-03 | 62 |
| GO:005134814 | Breast | IDC | negative regulation of transferase activity | 39/1434 | 268/18723 | 7.89e-05 | 1.56e-03 | 39 |
| GO:00434348 | Breast | IDC | response to peptide hormone | 54/1434 | 414/18723 | 8.25e-05 | 1.61e-03 | 54 |
| GO:001921612 | Breast | IDC | regulation of lipid metabolic process | 45/1434 | 331/18723 | 1.21e-04 | 2.24e-03 | 45 |
| GO:003133114 | Breast | IDC | positive regulation of cellular catabolic process | 54/1434 | 427/18723 | 1.85e-04 | 3.07e-03 | 54 |
| GO:00459369 | Breast | IDC | negative regulation of phosphate metabolic process | 53/1434 | 441/18723 | 7.21e-04 | 8.79e-03 | 53 |
| GO:00105639 | Breast | IDC | negative regulation of phosphorus metabolic process | 53/1434 | 442/18723 | 7.60e-04 | 9.25e-03 | 53 |
| GO:000189511 | Breast | IDC | retina homeostasis | 15/1434 | 79/18723 | 8.62e-04 | 1.00e-02 | 15 |
| GO:000189413 | Breast | IDC | tissue homeostasis | 34/1434 | 268/18723 | 2.54e-03 | 2.28e-02 | 34 |
| GO:0070229 | Breast | IDC | negative regulation of lymphocyte apoptotic process | 7/1434 | 30/18723 | 6.48e-03 | 4.56e-02 | 7 |
| GO:00328687 | Breast | IDC | response to insulin | 32/1434 | 264/18723 | 6.61e-03 | 4.62e-02 | 32 |
| GO:00328697 | Breast | IDC | cellular response to insulin stimulus | 26/1434 | 203/18723 | 6.74e-03 | 4.68e-02 | 26 |
| GO:005134824 | Breast | DCIS | negative regulation of transferase activity | 39/1390 | 268/18723 | 4.02e-05 | 8.60e-04 | 39 |
| GO:000989624 | Breast | DCIS | positive regulation of catabolic process | 61/1390 | 492/18723 | 5.32e-05 | 1.09e-03 | 61 |
| GO:003133124 | Breast | DCIS | positive regulation of cellular catabolic process | 54/1390 | 427/18723 | 8.34e-05 | 1.58e-03 | 54 |
| GO:004343414 | Breast | DCIS | response to peptide hormone | 52/1390 | 414/18723 | 1.33e-04 | 2.28e-03 | 52 |
| GO:001921621 | Breast | DCIS | regulation of lipid metabolic process | 43/1390 | 331/18723 | 2.37e-04 | 3.71e-03 | 43 |
| Page: 1 2 3 4 5 6 7 8 9 10 11 12 13 14 15 16 17 18 19 20 21 22 23 24 25 26 27 28 29 30 31 32 33 34 35 36 37 38 39 40 41 42 43 44 45 |
| Pathway ID | Tissue | Disease Stage | Description | Gene Ratio | Bg Ratio | pvalue | p.adjust | qvalue | Count |
| Page: 1 |
Top |
Cell-cell communication analysis |
| Identification of potential cell-cell interactions between two cell types and their ligand-receptor pairs for different disease states |
| Ligand | Receptor | LRpair | Pathway | Tissue | Disease Stage |
| Page: 1 |
Top |
Single-cell gene regulatory network inference analysis |
| Find out the significant the regulons (TFs) and the target genes of each regulon across cell types for different disease states |
| TF | Cell Type | Tissue | Disease Stage | Target Gene | RSS | Regulon Activity |
| ∗The dot plots of a searched regulon are shown for all cell subpopulations in each disease state of each tissue based on the regulon specific score inferred using pySCENIC and by calculating the average expression. |
| Page: 1 |
Top |
Somatic mutation of malignant transformation related genes |
| Annotation of somatic variants for genes involved in malignant transformation |
| Hugo Symbol | Variant Class | Variant Classification | dbSNP RS | HGVSc | HGVSp | HGVSp Short | SWISSPROT | BIOTYPE | SIFT | PolyPhen | Tumor Sample Barcode | Tissue | Histology | Sex | Age | Stage | Therapy Types | Drugs | Outcome |
| PIP | SNV | Missense_Mutation | c.396N>G | p.Ile132Met | p.I132M | P12273 | protein_coding | tolerated(0.07) | benign(0.093) | TCGA-E2-A152-01 | Breast | breast invasive carcinoma | Female | <65 | I/II | Targeted Molecular therapy | trastuzumab | PD | |
| PIP | SNV | Missense_Mutation | rs750884957 | c.151G>A | p.Glu51Lys | p.E51K | P12273 | protein_coding | deleterious(0) | probably_damaging(0.943) | TCGA-AA-3710-01 | Colorectum | colon adenocarcinoma | Female | >=65 | I/II | Unknown | Unknown | SD |
| PIP | SNV | Missense_Mutation | novel | c.74N>T | p.Ala25Val | p.A25V | P12273 | protein_coding | tolerated(1) | benign(0.009) | TCGA-AA-A00N-01 | Colorectum | colon adenocarcinoma | Male | >=65 | I/II | Unknown | Unknown | PD |
| PIP | SNV | Missense_Mutation | c.389N>A | p.Ile130Asn | p.I130N | P12273 | protein_coding | deleterious(0) | benign(0.294) | TCGA-CK-4951-01 | Colorectum | colon adenocarcinoma | Female | >=65 | I/II | Unknown | Unknown | PD | |
| PIP | SNV | Missense_Mutation | c.64N>A | p.Gln22Lys | p.Q22K | P12273 | protein_coding | deleterious(0.03) | possibly_damaging(0.759) | TCGA-D5-6535-01 | Colorectum | colon adenocarcinoma | Female | >=65 | III/IV | Unknown | Unknown | SD | |
| PIP | SNV | Missense_Mutation | rs780595639 | c.380N>A | p.Ala127Asp | p.A127D | P12273 | protein_coding | tolerated(0.63) | benign(0) | TCGA-G4-6628-01 | Colorectum | colon adenocarcinoma | Male | >=65 | I/II | Unknown | Unknown | SD |
| PIP | SNV | Missense_Mutation | rs376369577 | c.97N>T | p.Arg33Trp | p.R33W | P12273 | protein_coding | tolerated(0.1) | benign(0.034) | TCGA-EI-6917-01 | Colorectum | rectum adenocarcinoma | Male | <65 | III/IV | Chemotherapy | 5fluorouracil+oxaciplatina+l-folinian | SD |
| PIP | SNV | Missense_Mutation | c.69G>T | p.Leu23Phe | p.L23F | P12273 | protein_coding | deleterious(0.04) | benign(0.441) | TCGA-AP-A056-01 | Endometrium | uterine corpus endometrioid carcinoma | Female | <65 | I/II | Unknown | Unknown | SD | |
| PIP | SNV | Missense_Mutation | c.320N>A | p.Thr107Asn | p.T107N | P12273 | protein_coding | deleterious(0.03) | benign(0.358) | TCGA-AP-A059-01 | Endometrium | uterine corpus endometrioid carcinoma | Female | >=65 | I/II | Unknown | Unknown | SD | |
| PIP | SNV | Missense_Mutation | novel | c.16N>T | p.Leu6Phe | p.L6F | P12273 | protein_coding | tolerated(0.14) | benign(0.019) | TCGA-AP-A1DK-01 | Endometrium | uterine corpus endometrioid carcinoma | Female | <65 | I/II | Unknown | Unknown | SD |
| Page: 1 2 3 |
Top |
Related drugs of malignant transformation related genes |
| Identification of chemicals and drugs interact with genes involved in malignant transfromation |
| (DGIdb 4.0) |
| Entrez ID | Symbol | Category | Interaction Types | Drug Claim Name | Drug Name | PMIDs |
| 5304 | PIP | DRUGGABLE GENOME | HORMONES | 7558422 | ||
| 5304 | PIP | DRUGGABLE GENOME | TAMOXIFEN | TAMOXIFEN | 1930624 |
| Page: 1 |

Copyright 2023-Present -The University of Texas Health Science Center at Houston |