
|
|||||
|
 | |
| |
| |
| |
| |
| |
|
Gene: PINX1 |
Gene summary for PINX1 |
| Gene information | Species | Human | Gene symbol | PINX1 | Gene ID | 54984 |
| Gene name | PIN2 (TERF1) interacting telomerase inhibitor 1 | |
| Gene Alias | Gno1 | |
| Cytomap | 8p23.1 | |
| Gene Type | protein-coding | GO ID | GO:0000070 | UniProtAcc | Q96BK5 |
Top |
Malignant transformation analysis |
| Identification of the aberrant gene expression in precancerous and cancerous lesions by comparing the gene expression of stem-like cells in diseased tissues with normal stem cells |
| Entrez ID | Symbol | Replicates | Species | Organ | Tissue | Adj P-value | Log2FC | Malignancy |
| 54984 | PINX1 | LZE4T | Human | Esophagus | ESCC | 5.64e-03 | 7.86e-02 | 0.0811 |
| 54984 | PINX1 | LZE24T | Human | Esophagus | ESCC | 7.17e-09 | 5.97e-02 | 0.0596 |
| 54984 | PINX1 | P2T-E | Human | Esophagus | ESCC | 3.59e-18 | 4.14e-01 | 0.1177 |
| 54984 | PINX1 | P4T-E | Human | Esophagus | ESCC | 8.22e-06 | 1.84e-02 | 0.1323 |
| 54984 | PINX1 | P5T-E | Human | Esophagus | ESCC | 6.43e-13 | 5.83e-02 | 0.1327 |
| 54984 | PINX1 | P8T-E | Human | Esophagus | ESCC | 1.60e-02 | -1.63e-02 | 0.0889 |
| 54984 | PINX1 | P9T-E | Human | Esophagus | ESCC | 8.31e-05 | 3.14e-02 | 0.1131 |
| 54984 | PINX1 | P10T-E | Human | Esophagus | ESCC | 1.08e-17 | 1.71e-01 | 0.116 |
| 54984 | PINX1 | P12T-E | Human | Esophagus | ESCC | 8.03e-13 | 1.09e-01 | 0.1122 |
| 54984 | PINX1 | P15T-E | Human | Esophagus | ESCC | 1.08e-05 | -2.30e-02 | 0.1149 |
| 54984 | PINX1 | P16T-E | Human | Esophagus | ESCC | 5.72e-17 | 1.52e-01 | 0.1153 |
| 54984 | PINX1 | P20T-E | Human | Esophagus | ESCC | 2.11e-08 | 2.59e-01 | 0.1124 |
| 54984 | PINX1 | P21T-E | Human | Esophagus | ESCC | 4.04e-17 | 1.77e-01 | 0.1617 |
| 54984 | PINX1 | P22T-E | Human | Esophagus | ESCC | 9.09e-10 | 1.14e-01 | 0.1236 |
| 54984 | PINX1 | P23T-E | Human | Esophagus | ESCC | 8.81e-14 | 2.00e-01 | 0.108 |
| 54984 | PINX1 | P24T-E | Human | Esophagus | ESCC | 2.81e-06 | 2.31e-01 | 0.1287 |
| 54984 | PINX1 | P26T-E | Human | Esophagus | ESCC | 1.17e-12 | 5.69e-02 | 0.1276 |
| 54984 | PINX1 | P27T-E | Human | Esophagus | ESCC | 2.15e-12 | 9.82e-02 | 0.1055 |
| 54984 | PINX1 | P28T-E | Human | Esophagus | ESCC | 2.49e-18 | 2.70e-01 | 0.1149 |
| 54984 | PINX1 | P30T-E | Human | Esophagus | ESCC | 7.90e-08 | 2.27e-01 | 0.137 |
| Page: 1 2 3 |
| Tissue | Expression Dynamics | Abbreviation |
| Esophagus | 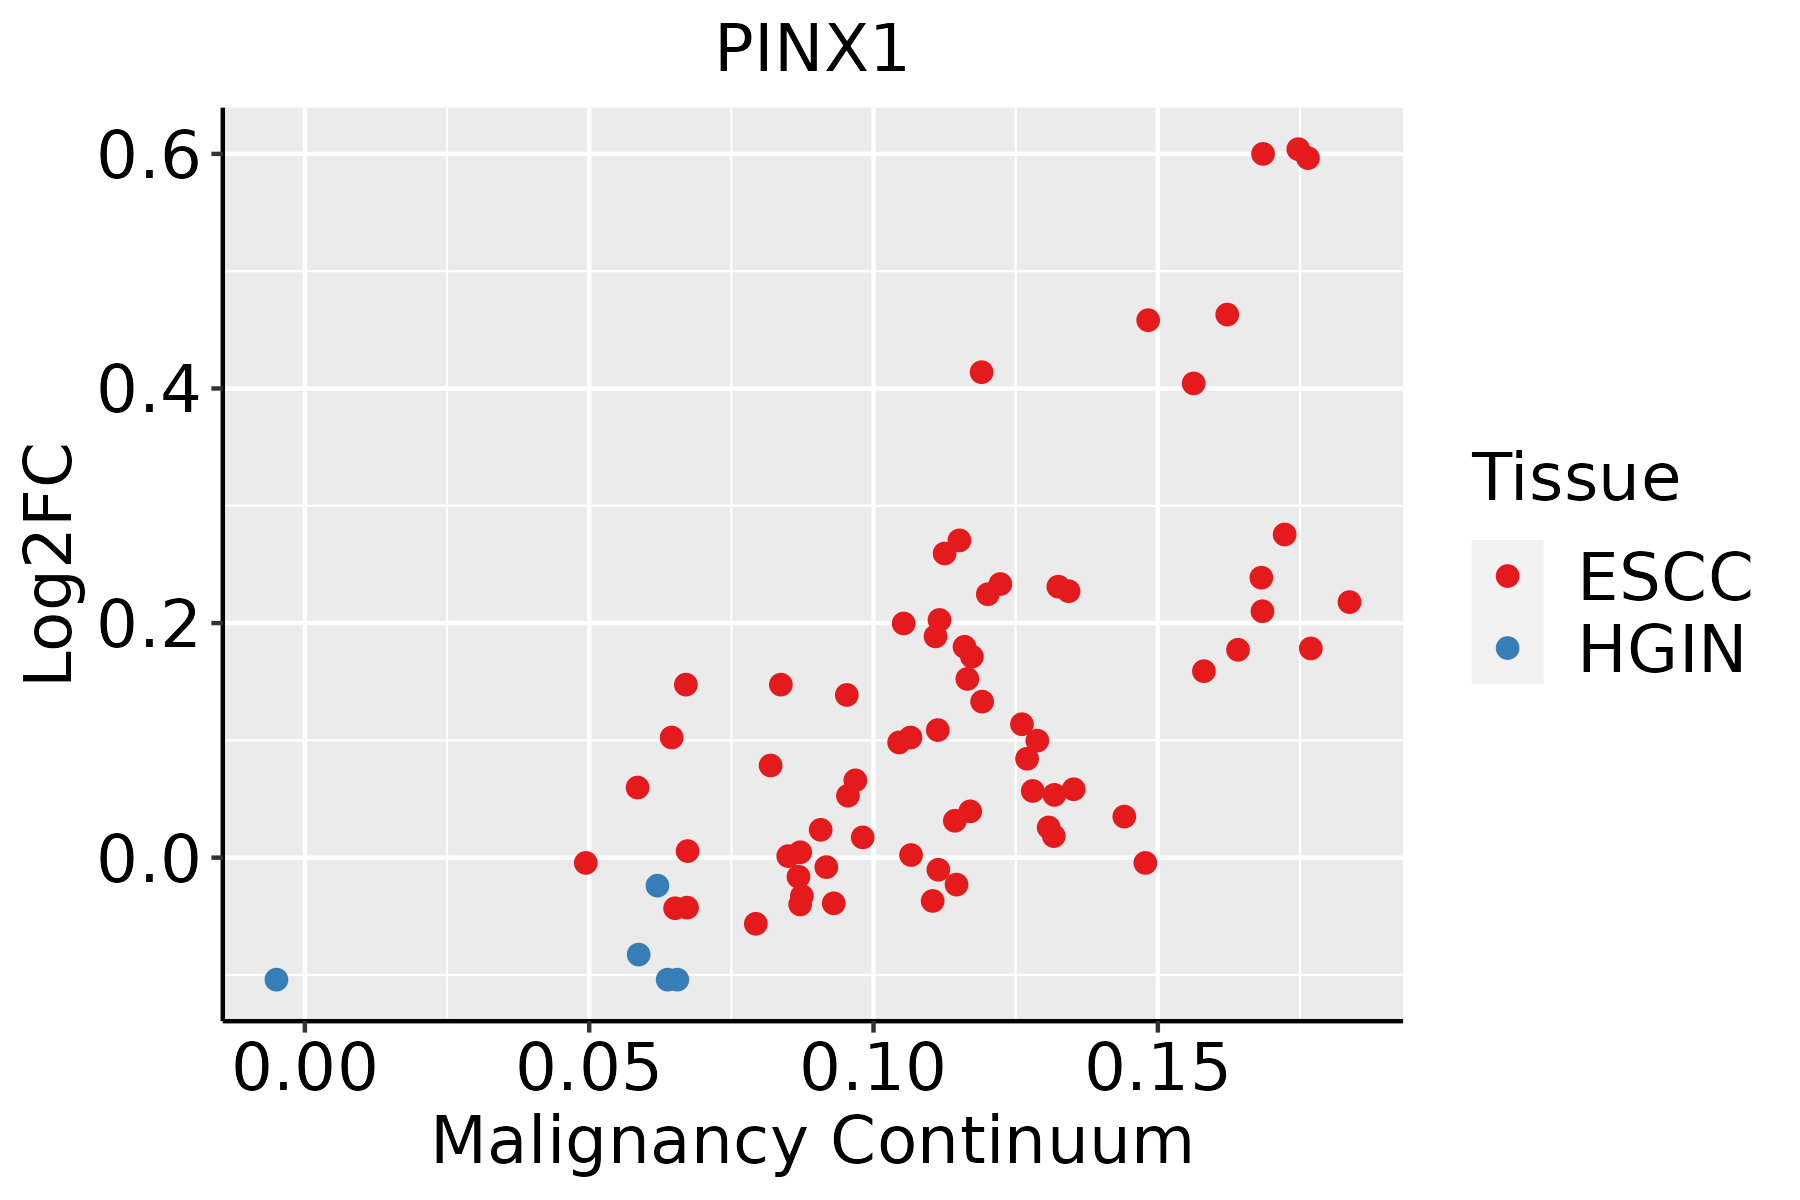 | ESCC: Esophageal squamous cell carcinoma |
| HGIN: High-grade intraepithelial neoplasias | ||
| LGIN: Low-grade intraepithelial neoplasias | ||
| Oral Cavity | 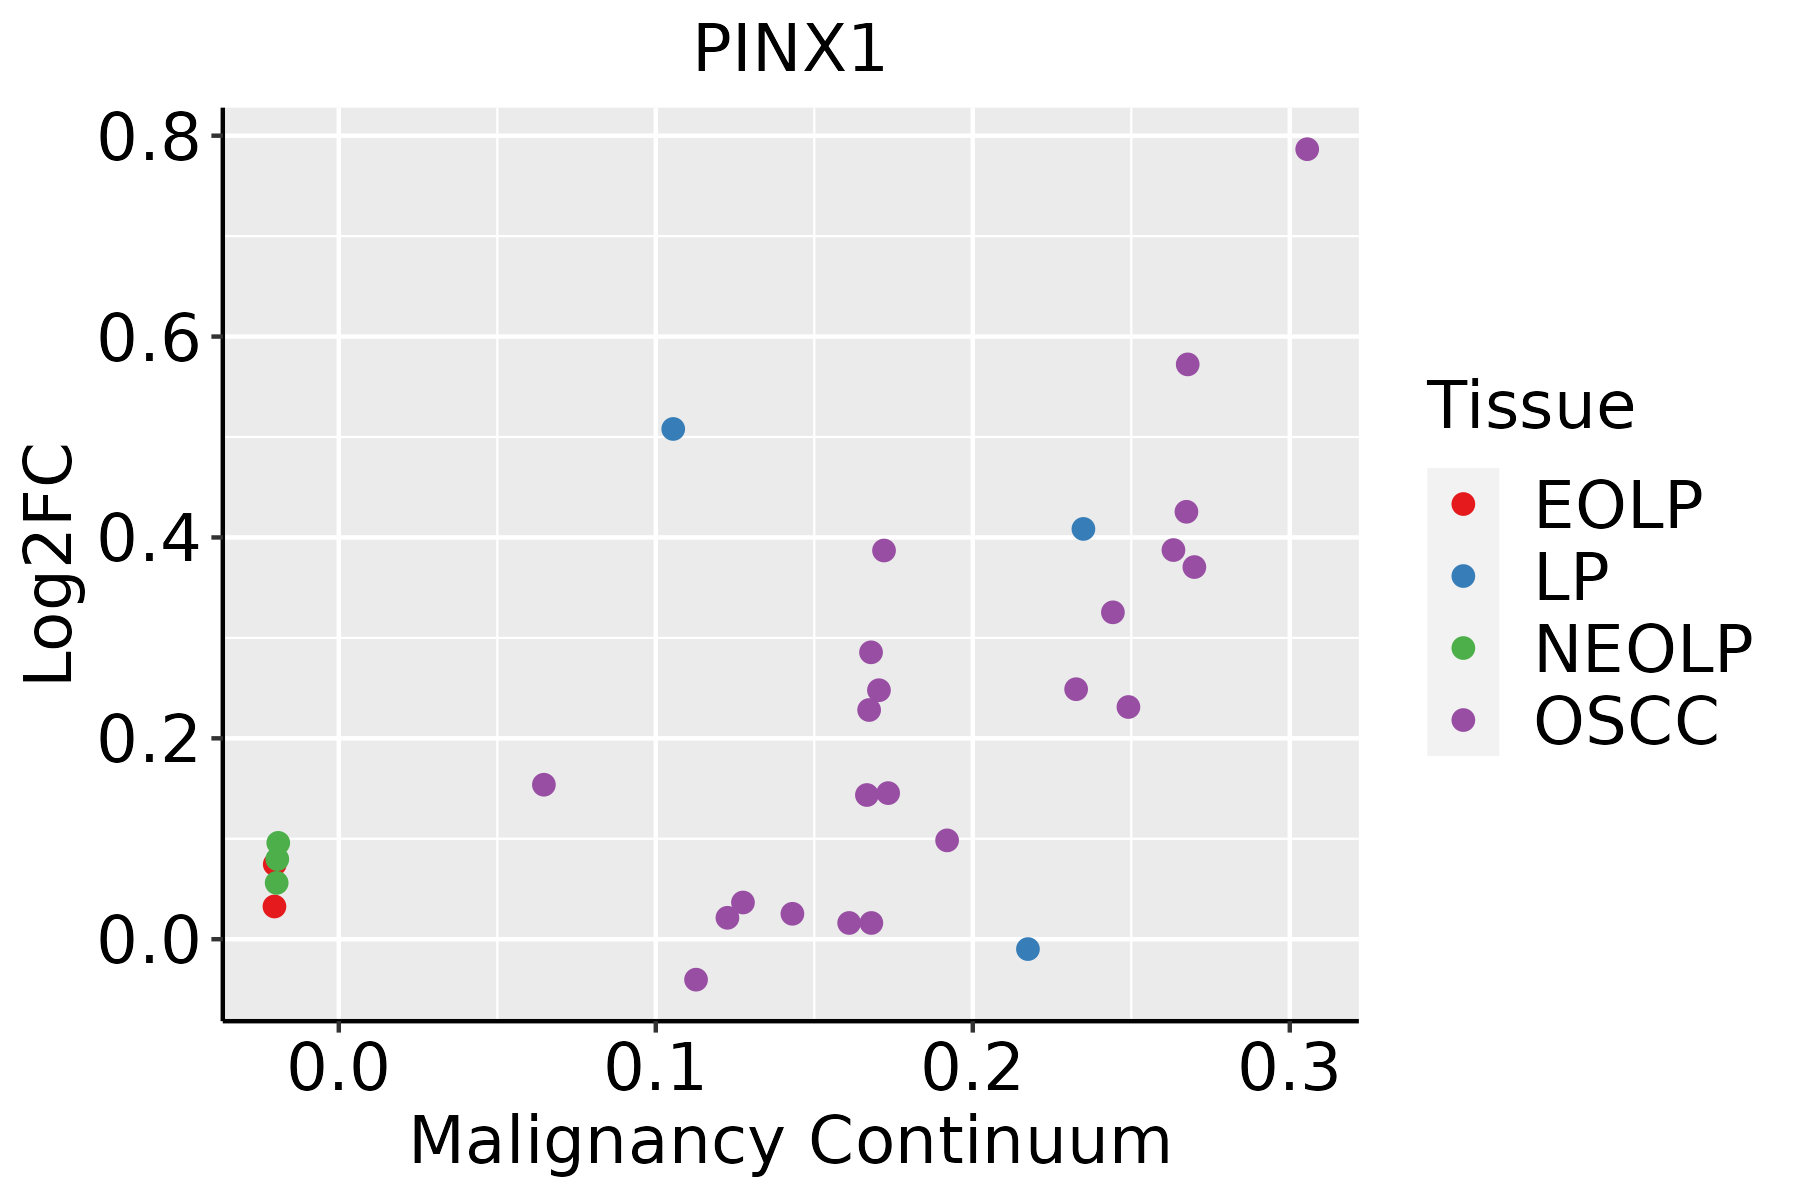 | EOLP: Erosive Oral lichen planus |
| LP: leukoplakia | ||
| NEOLP: Non-erosive oral lichen planus | ||
| OSCC: Oral squamous cell carcinoma | ||
| Skin | 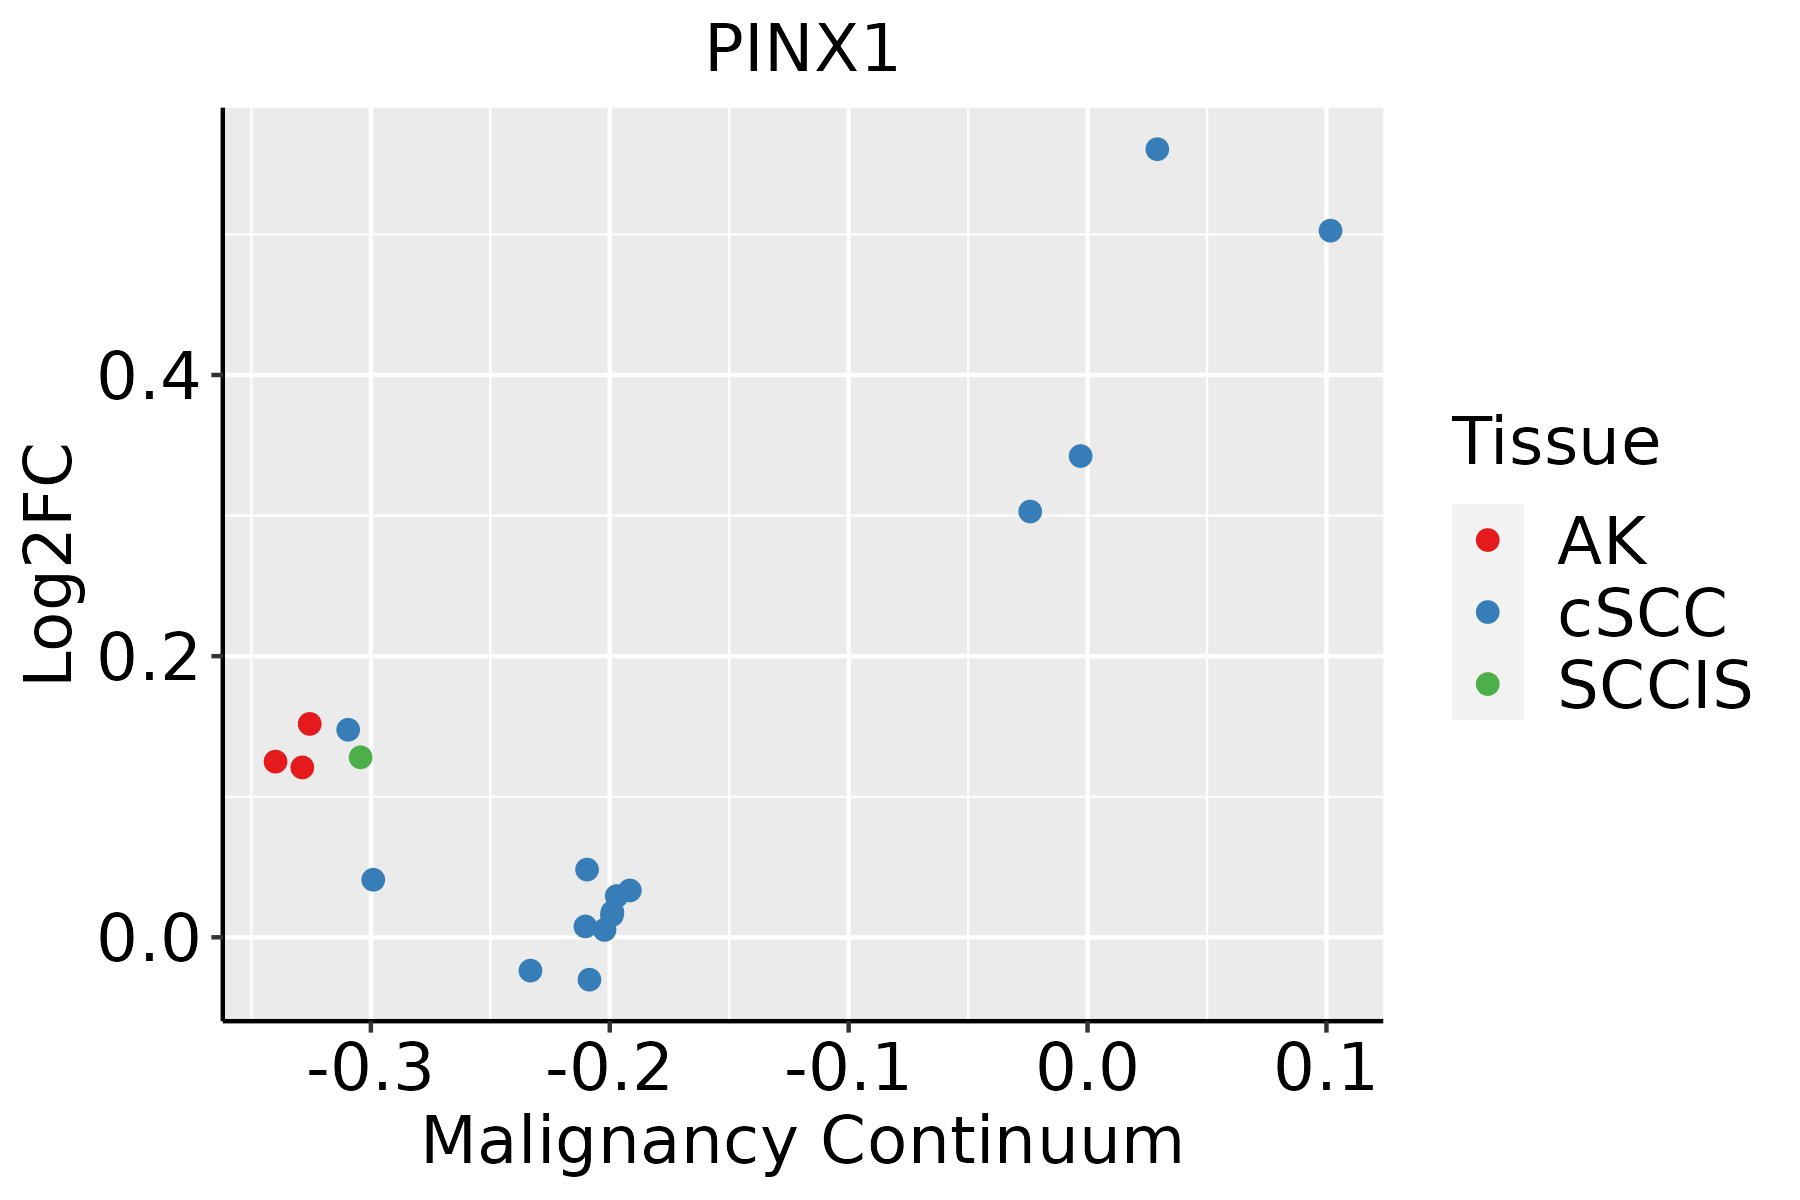 | AK: Actinic keratosis |
| cSCC: Cutaneous squamous cell carcinoma | ||
| SCCIS:squamous cell carcinoma in situ |
| ∗log2FC in expression of this searched gene in stem-like cells from each diseased tissue sample relative to stem-like cells in normal samples in each tissue plotted against the malignancy continuum. Samples are colored based on if they are from different disease stage. |
Top |
Malignant transformation related pathway analysis |
| Find out the enriched GO biological processes and KEGG pathways involved in transition from healthy to precancer to cancer |
| Tissue | Disease Stage | Enriched GO biological Processes |
| Colorectum | AD |  |
| Colorectum | SER |  |
| Colorectum | MSS |  |
| Colorectum | MSI-H |  |
| Colorectum | FAP |  |
| ∗Top 15 enriched GO BP terms are showed in the bar plot of each disease state in each tissue. Each row represents a significant GO biological process which is colored according to the -log10(p.adjust). |
| Page: 1 2 3 4 5 6 7 8 9 |
| GO ID | Tissue | Disease Stage | Description | Gene Ratio | Bg Ratio | pvalue | p.adjust | Count |
| GO:014001414 | Esophagus | ESCC | mitotic nuclear division | 218/8552 | 287/18723 | 6.17e-26 | 1.78e-23 | 218 |
| GO:0031647111 | Esophagus | ESCC | regulation of protein stability | 223/8552 | 298/18723 | 5.76e-25 | 1.52e-22 | 223 |
| GO:005165617 | Esophagus | ESCC | establishment of organelle localization | 273/8552 | 390/18723 | 9.13e-23 | 1.81e-20 | 273 |
| GO:000007011 | Esophagus | ESCC | mitotic sister chromatid segregation | 138/8552 | 168/18723 | 1.37e-22 | 2.63e-20 | 138 |
| GO:003450418 | Esophagus | ESCC | protein localization to nucleus | 211/8552 | 290/18723 | 4.06e-21 | 6.60e-19 | 211 |
| GO:00008194 | Esophagus | ESCC | sister chromatid segregation | 157/8552 | 202/18723 | 8.41e-21 | 1.33e-18 | 157 |
| GO:1903320111 | Esophagus | ESCC | regulation of protein modification by small protein conjugation or removal | 181/8552 | 242/18723 | 1.80e-20 | 2.60e-18 | 181 |
| GO:0051098111 | Esophagus | ESCC | regulation of binding | 251/8552 | 363/18723 | 6.73e-20 | 8.46e-18 | 251 |
| GO:1903829111 | Esophagus | ESCC | positive regulation of cellular protein localization | 199/8552 | 276/18723 | 2.99e-19 | 3.45e-17 | 199 |
| GO:003304416 | Esophagus | ESCC | regulation of chromosome organization | 145/8552 | 187/18723 | 3.80e-19 | 4.31e-17 | 145 |
| GO:000705911 | Esophagus | ESCC | chromosome segregation | 238/8552 | 346/18723 | 1.72e-18 | 1.82e-16 | 238 |
| GO:004477216 | Esophagus | ESCC | mitotic cell cycle phase transition | 281/8552 | 424/18723 | 4.63e-18 | 4.45e-16 | 281 |
| GO:0031396111 | Esophagus | ESCC | regulation of protein ubiquitination | 154/8552 | 210/18723 | 2.70e-16 | 2.04e-14 | 154 |
| GO:000734615 | Esophagus | ESCC | regulation of mitotic cell cycle | 293/8552 | 457/18723 | 8.00e-16 | 5.64e-14 | 293 |
| GO:005131011 | Esophagus | ESCC | metaphase plate congression | 58/8552 | 65/18723 | 1.81e-13 | 8.63e-12 | 58 |
| GO:005105215 | Esophagus | ESCC | regulation of DNA metabolic process | 232/8552 | 359/18723 | 2.40e-13 | 1.13e-11 | 232 |
| GO:000708011 | Esophagus | ESCC | mitotic metaphase plate congression | 47/8552 | 50/18723 | 3.15e-13 | 1.47e-11 | 47 |
| GO:00482853 | Esophagus | ESCC | organelle fission | 301/8552 | 488/18723 | 4.64e-13 | 2.12e-11 | 301 |
| GO:00988133 | Esophagus | ESCC | nuclear chromosome segregation | 187/8552 | 281/18723 | 1.00e-12 | 4.36e-11 | 187 |
| GO:005130311 | Esophagus | ESCC | establishment of chromosome localization | 67/8552 | 80/18723 | 1.92e-12 | 8.09e-11 | 67 |
| Page: 1 2 3 4 5 6 7 8 9 10 11 12 |
| Pathway ID | Tissue | Disease Stage | Description | Gene Ratio | Bg Ratio | pvalue | p.adjust | qvalue | Count |
| Page: 1 |
Top |
Cell-cell communication analysis |
| Identification of potential cell-cell interactions between two cell types and their ligand-receptor pairs for different disease states |
| Ligand | Receptor | LRpair | Pathway | Tissue | Disease Stage |
| Page: 1 |
Top |
Single-cell gene regulatory network inference analysis |
| Find out the significant the regulons (TFs) and the target genes of each regulon across cell types for different disease states |
| TF | Cell Type | Tissue | Disease Stage | Target Gene | RSS | Regulon Activity |
| ∗The dot plots of a searched regulon are shown for all cell subpopulations in each disease state of each tissue based on the regulon specific score inferred using pySCENIC and by calculating the average expression. |
| Page: 1 |
Top |
Somatic mutation of malignant transformation related genes |
| Annotation of somatic variants for genes involved in malignant transformation |
| Hugo Symbol | Variant Class | Variant Classification | dbSNP RS | HGVSc | HGVSp | HGVSp Short | SWISSPROT | BIOTYPE | SIFT | PolyPhen | Tumor Sample Barcode | Tissue | Histology | Sex | Age | Stage | Therapy Types | Drugs | Outcome |
| PINX1 | SNV | Missense_Mutation | novel | c.581N>G | p.Gln194Arg | p.Q194R | Q96BK5 | protein_coding | tolerated(0.06) | benign(0.092) | TCGA-A8-A09Z-01 | Breast | breast invasive carcinoma | Female | >=65 | I/II | Unknown | Unknown | SD |
| PINX1 | SNV | Missense_Mutation | c.857N>A | p.Gly286Asp | p.G286D | Q96BK5 | protein_coding | tolerated(1) | benign(0) | TCGA-BH-A1EY-01 | Breast | breast invasive carcinoma | Female | >=65 | I/II | Unknown | Unknown | PD | |
| PINX1 | insertion | Nonsense_Mutation | novel | c.561_562insTCACCTAATACTGATTTATCTGTCACATGGCTGTAAATAGTGAC | p.Ala188SerfsTer12 | p.A188Sfs*12 | Q96BK5 | protein_coding | TCGA-A2-A04Y-01 | Breast | breast invasive carcinoma | Female | <65 | I/II | Chemotherapy | cytoxan | SD | ||
| PINX1 | insertion | Nonsense_Mutation | novel | c.737_738insATCATTACAAATACATGCATTCATGTAAGTGTGCACAC | p.Glu247SerfsTer9 | p.E247Sfs*9 | Q96BK5 | protein_coding | TCGA-A8-A07J-01 | Breast | breast invasive carcinoma | Female | <65 | I/II | Chemotherapy | 5-fluorouracil | CR | ||
| PINX1 | insertion | Frame_Shift_Ins | novel | c.441dupT | p.Gly148TrpfsTer6 | p.G148Wfs*6 | Q96BK5 | protein_coding | TCGA-AN-A0AK-01 | Breast | breast invasive carcinoma | Female | >=65 | I/II | Unknown | Unknown | SD | ||
| PINX1 | insertion | Frame_Shift_Ins | novel | c.541_542insGTGCGCATCTGTGTGTGTGTGTGTGTGTCACTATCTCC | p.Tyr181CysfsTer22 | p.Y181Cfs*22 | Q96BK5 | protein_coding | TCGA-B6-A0IA-01 | Breast | breast invasive carcinoma | Female | <65 | I/II | Unknown | Unknown | SD | ||
| PINX1 | SNV | Missense_Mutation | c.538G>A | p.Glu180Lys | p.E180K | Q96BK5 | protein_coding | deleterious(0) | possibly_damaging(0.898) | TCGA-EK-A2R7-01 | Cervix | cervical & endocervical cancer | Female | <65 | I/II | Unknown | Unknown | SD | |
| PINX1 | SNV | Missense_Mutation | c.853N>A | p.Glu285Lys | p.E285K | Q96BK5 | protein_coding | deleterious(0.05) | benign(0.006) | TCGA-FU-A2QG-01 | Cervix | cervical & endocervical cancer | Female | <65 | I/II | Unknown | Unknown | SD | |
| PINX1 | SNV | Missense_Mutation | c.324G>T | p.Lys108Asn | p.K108N | Q96BK5 | protein_coding | deleterious(0.03) | possibly_damaging(0.635) | TCGA-A6-6141-01 | Colorectum | colon adenocarcinoma | Male | <65 | I/II | Chemotherapy | 5-fu | SD | |
| PINX1 | SNV | Missense_Mutation | c.551N>C | p.Lys184Thr | p.K184T | Q96BK5 | protein_coding | deleterious(0.03) | benign(0.426) | TCGA-AA-3851-01 | Colorectum | colon adenocarcinoma | Male | >=65 | I/II | Unknown | Unknown | SD |
| Page: 1 2 3 4 |
Top |
Related drugs of malignant transformation related genes |
| Identification of chemicals and drugs interact with genes involved in malignant transfromation |
| (DGIdb 4.0) |
| Entrez ID | Symbol | Category | Interaction Types | Drug Claim Name | Drug Name | PMIDs |
| Page: 1 |

Copyright 2023-Present -The University of Texas Health Science Center at Houston |