
|
|||||
|
 | |
| |
| |
| |
| |
| |
|
Gene: PINLYP |
Gene summary for PINLYP |
| Gene information | Species | Human | Gene symbol | PINLYP | Gene ID | 390940 |
| Gene name | phospholipase A2 inhibitor and LY6/PLAUR domain containing | |
| Gene Alias | PINLYP | |
| Cytomap | 19q13.31 | |
| Gene Type | protein-coding | GO ID | GO:0008150 | UniProtAcc | A6NC86 |
Top |
Malignant transformation analysis |
| Identification of the aberrant gene expression in precancerous and cancerous lesions by comparing the gene expression of stem-like cells in diseased tissues with normal stem cells |
| Entrez ID | Symbol | Replicates | Species | Organ | Tissue | Adj P-value | Log2FC | Malignancy |
| 390940 | PINLYP | LZE24T | Human | Esophagus | ESCC | 3.08e-02 | 1.76e-01 | 0.0596 |
| 390940 | PINLYP | P2T-E | Human | Esophagus | ESCC | 7.95e-07 | 1.23e-01 | 0.1177 |
| 390940 | PINLYP | P4T-E | Human | Esophagus | ESCC | 1.35e-17 | 5.25e-01 | 0.1323 |
| 390940 | PINLYP | P5T-E | Human | Esophagus | ESCC | 9.35e-08 | 2.04e-02 | 0.1327 |
| 390940 | PINLYP | P9T-E | Human | Esophagus | ESCC | 4.05e-07 | 1.72e-01 | 0.1131 |
| 390940 | PINLYP | P10T-E | Human | Esophagus | ESCC | 1.41e-46 | 8.43e-01 | 0.116 |
| 390940 | PINLYP | P12T-E | Human | Esophagus | ESCC | 9.72e-44 | 1.01e+00 | 0.1122 |
| 390940 | PINLYP | P15T-E | Human | Esophagus | ESCC | 9.79e-18 | 4.90e-01 | 0.1149 |
| 390940 | PINLYP | P19T-E | Human | Esophagus | ESCC | 3.60e-04 | 2.96e-01 | 0.1662 |
| 390940 | PINLYP | P20T-E | Human | Esophagus | ESCC | 1.76e-07 | 1.41e-01 | 0.1124 |
| 390940 | PINLYP | P21T-E | Human | Esophagus | ESCC | 2.29e-23 | 4.44e-01 | 0.1617 |
| 390940 | PINLYP | P22T-E | Human | Esophagus | ESCC | 1.47e-29 | 5.70e-01 | 0.1236 |
| 390940 | PINLYP | P24T-E | Human | Esophagus | ESCC | 2.65e-02 | 3.24e-02 | 0.1287 |
| 390940 | PINLYP | P26T-E | Human | Esophagus | ESCC | 7.17e-38 | 7.19e-01 | 0.1276 |
| 390940 | PINLYP | P27T-E | Human | Esophagus | ESCC | 1.16e-28 | 5.59e-01 | 0.1055 |
| 390940 | PINLYP | P28T-E | Human | Esophagus | ESCC | 1.45e-12 | 1.70e-01 | 0.1149 |
| 390940 | PINLYP | P31T-E | Human | Esophagus | ESCC | 2.25e-12 | 2.57e-01 | 0.1251 |
| 390940 | PINLYP | P37T-E | Human | Esophagus | ESCC | 4.09e-04 | 3.23e-02 | 0.1371 |
| 390940 | PINLYP | P40T-E | Human | Esophagus | ESCC | 6.94e-09 | 2.59e-01 | 0.109 |
| 390940 | PINLYP | P42T-E | Human | Esophagus | ESCC | 4.07e-02 | 1.19e-01 | 0.1175 |
| Page: 1 2 3 |
| Tissue | Expression Dynamics | Abbreviation |
| Esophagus | 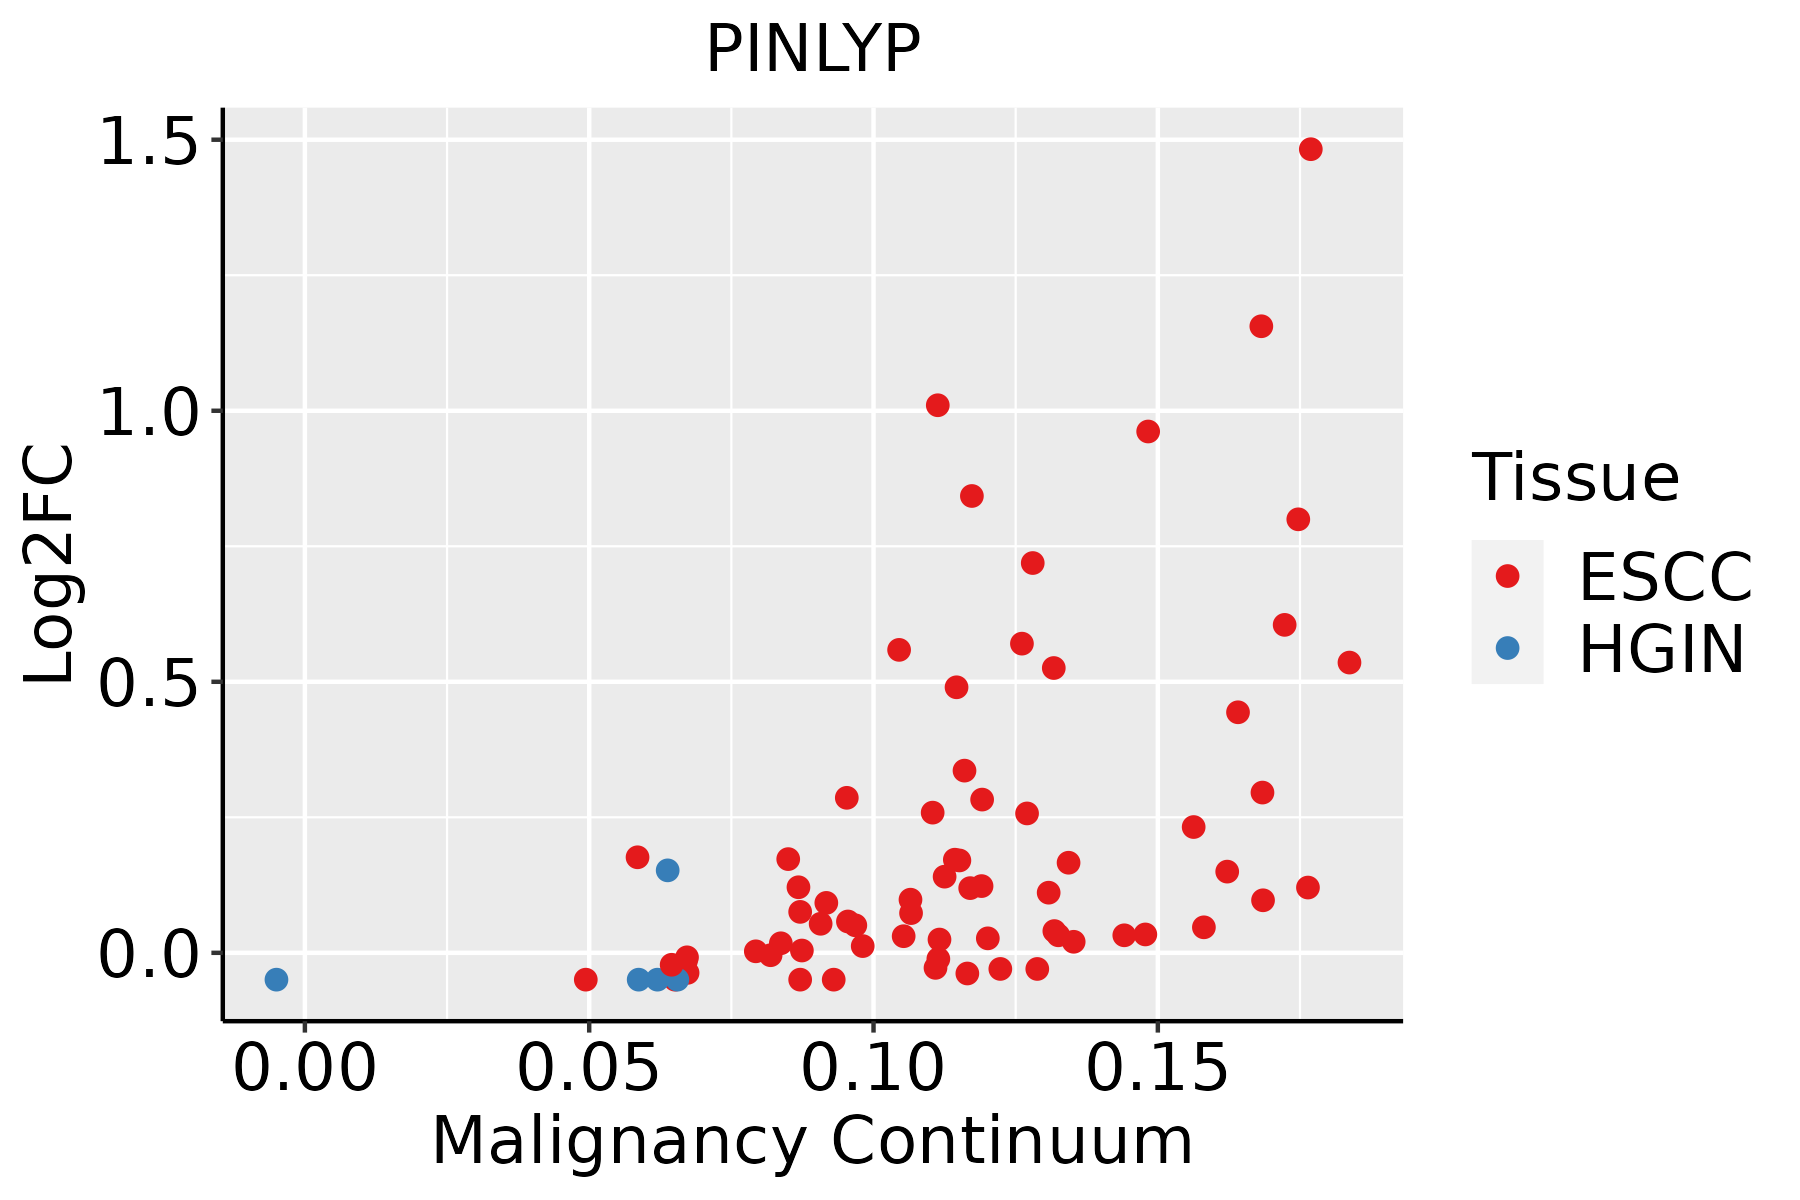 | ESCC: Esophageal squamous cell carcinoma |
| HGIN: High-grade intraepithelial neoplasias | ||
| LGIN: Low-grade intraepithelial neoplasias | ||
| Oral Cavity |  | EOLP: Erosive Oral lichen planus |
| LP: leukoplakia | ||
| NEOLP: Non-erosive oral lichen planus | ||
| OSCC: Oral squamous cell carcinoma |
| ∗log2FC in expression of this searched gene in stem-like cells from each diseased tissue sample relative to stem-like cells in normal samples in each tissue plotted against the malignancy continuum. Samples are colored based on if they are from different disease stage. |
Top |
Malignant transformation related pathway analysis |
| Find out the enriched GO biological processes and KEGG pathways involved in transition from healthy to precancer to cancer |
| Tissue | Disease Stage | Enriched GO biological Processes |
| Colorectum | AD |  |
| Colorectum | SER |  |
| Colorectum | MSS |  |
| Colorectum | MSI-H |  |
| Colorectum | FAP |  |
| ∗Top 15 enriched GO BP terms are showed in the bar plot of each disease state in each tissue. Each row represents a significant GO biological process which is colored according to the -log10(p.adjust). |
| Page: 1 2 3 4 5 6 7 8 9 |
| GO ID | Tissue | Disease Stage | Description | Gene Ratio | Bg Ratio | pvalue | p.adjust | Count |
| Page: 1 |
| Pathway ID | Tissue | Disease Stage | Description | Gene Ratio | Bg Ratio | pvalue | p.adjust | qvalue | Count |
| Page: 1 |
Top |
Cell-cell communication analysis |
| Identification of potential cell-cell interactions between two cell types and their ligand-receptor pairs for different disease states |
| Ligand | Receptor | LRpair | Pathway | Tissue | Disease Stage |
| Page: 1 |
Top |
Single-cell gene regulatory network inference analysis |
| Find out the significant the regulons (TFs) and the target genes of each regulon across cell types for different disease states |
| TF | Cell Type | Tissue | Disease Stage | Target Gene | RSS | Regulon Activity |
| ∗The dot plots of a searched regulon are shown for all cell subpopulations in each disease state of each tissue based on the regulon specific score inferred using pySCENIC and by calculating the average expression. |
| Page: 1 |
Top |
Somatic mutation of malignant transformation related genes |
| Annotation of somatic variants for genes involved in malignant transformation |
| Hugo Symbol | Variant Class | Variant Classification | dbSNP RS | HGVSc | HGVSp | HGVSp Short | SWISSPROT | BIOTYPE | SIFT | PolyPhen | Tumor Sample Barcode | Tissue | Histology | Sex | Age | Stage | Therapy Types | Drugs | Outcome |
| PINLYP | SNV | Missense_Mutation | novel | c.149C>T | p.Pro50Leu | p.P50L | A6NC86 | protein_coding | deleterious(0.01) | probably_damaging(0.966) | TCGA-AP-A1DK-01 | Endometrium | uterine corpus endometrioid carcinoma | Female | <65 | I/II | Unknown | Unknown | SD |
| PINLYP | SNV | Missense_Mutation | novel | c.603N>A | p.Met201Ile | p.M201I | A6NC86 | protein_coding | deleterious(0.02) | benign(0.003) | TCGA-D1-A2G0-01 | Endometrium | uterine corpus endometrioid carcinoma | Female | >=65 | I/II | Unknown | Unknown | SD |
| PINLYP | deletion | Frame_Shift_Del | novel | c.339delN | p.Gly114AlafsTer7 | p.G114Afs*7 | A6NC86 | protein_coding | TCGA-B5-A5OC-01 | Endometrium | uterine corpus endometrioid carcinoma | Female | >=65 | III/IV | Chemotherapy | cisplatin | SD |
| Page: 1 |
Top |
Related drugs of malignant transformation related genes |
| Identification of chemicals and drugs interact with genes involved in malignant transfromation |
| (DGIdb 4.0) |
| Entrez ID | Symbol | Category | Interaction Types | Drug Claim Name | Drug Name | PMIDs |
| Page: 1 |

Copyright 2023-Present -The University of Texas Health Science Center at Houston |