
|
|||||
|
 | |
| |
| |
| |
| |
| |
|
Gene: PIN1 |
Gene summary for PIN1 |
| Gene information | Species | Human | Gene symbol | PIN1 | Gene ID | 5300 |
| Gene name | peptidylprolyl cis/trans isomerase, NIMA-interacting 1 | |
| Gene Alias | DOD | |
| Cytomap | 19p13.2 | |
| Gene Type | protein-coding | GO ID | GO:0000165 | UniProtAcc | Q13526 |
Top |
Malignant transformation analysis |
| Identification of the aberrant gene expression in precancerous and cancerous lesions by comparing the gene expression of stem-like cells in diseased tissues with normal stem cells |
| Entrez ID | Symbol | Replicates | Species | Organ | Tissue | Adj P-value | Log2FC | Malignancy |
| 5300 | PIN1 | GSM4909291 | Human | Breast | IDC | 5.51e-08 | 3.86e-01 | 0.1753 |
| 5300 | PIN1 | GSM4909296 | Human | Breast | IDC | 2.77e-04 | 2.06e-01 | 0.1524 |
| 5300 | PIN1 | GSM4909297 | Human | Breast | IDC | 6.16e-08 | 2.86e-02 | 0.1517 |
| 5300 | PIN1 | GSM4909298 | Human | Breast | IDC | 1.16e-04 | 2.52e-01 | 0.1551 |
| 5300 | PIN1 | GSM4909301 | Human | Breast | IDC | 3.46e-02 | 2.54e-01 | 0.1577 |
| 5300 | PIN1 | GSM4909304 | Human | Breast | IDC | 1.57e-02 | 2.59e-01 | 0.1636 |
| 5300 | PIN1 | GSM4909308 | Human | Breast | IDC | 3.01e-24 | 5.25e-01 | 0.158 |
| 5300 | PIN1 | GSM4909311 | Human | Breast | IDC | 9.29e-17 | -7.79e-02 | 0.1534 |
| 5300 | PIN1 | GSM4909316 | Human | Breast | IDC | 2.73e-04 | 3.72e-01 | 0.21 |
| 5300 | PIN1 | GSM4909319 | Human | Breast | IDC | 5.25e-23 | 5.47e-02 | 0.1563 |
| 5300 | PIN1 | GSM4909320 | Human | Breast | IDC | 7.17e-03 | 1.20e-01 | 0.1575 |
| 5300 | PIN1 | GSM4909321 | Human | Breast | IDC | 7.44e-09 | 9.75e-02 | 0.1559 |
| 5300 | PIN1 | NCCBC5 | Human | Breast | DCIS | 9.36e-07 | 2.57e-01 | 0.2046 |
| 5300 | PIN1 | P1 | Human | Breast | IDC | 2.79e-02 | -1.64e-01 | 0.1527 |
| 5300 | PIN1 | DCIS2 | Human | Breast | DCIS | 9.03e-46 | 1.28e-01 | 0.0085 |
| 5300 | PIN1 | LZE4T | Human | Esophagus | ESCC | 2.73e-21 | 4.72e-01 | 0.0811 |
| 5300 | PIN1 | LZE5T | Human | Esophagus | ESCC | 1.24e-04 | 3.70e-01 | 0.0514 |
| 5300 | PIN1 | LZE7T | Human | Esophagus | ESCC | 1.44e-24 | 1.27e+00 | 0.0667 |
| 5300 | PIN1 | LZE8T | Human | Esophagus | ESCC | 1.11e-15 | 4.13e-01 | 0.067 |
| 5300 | PIN1 | LZE20T | Human | Esophagus | ESCC | 4.31e-08 | 3.26e-01 | 0.0662 |
| Page: 1 2 3 4 5 6 7 8 |
| Tissue | Expression Dynamics | Abbreviation |
| Breast | 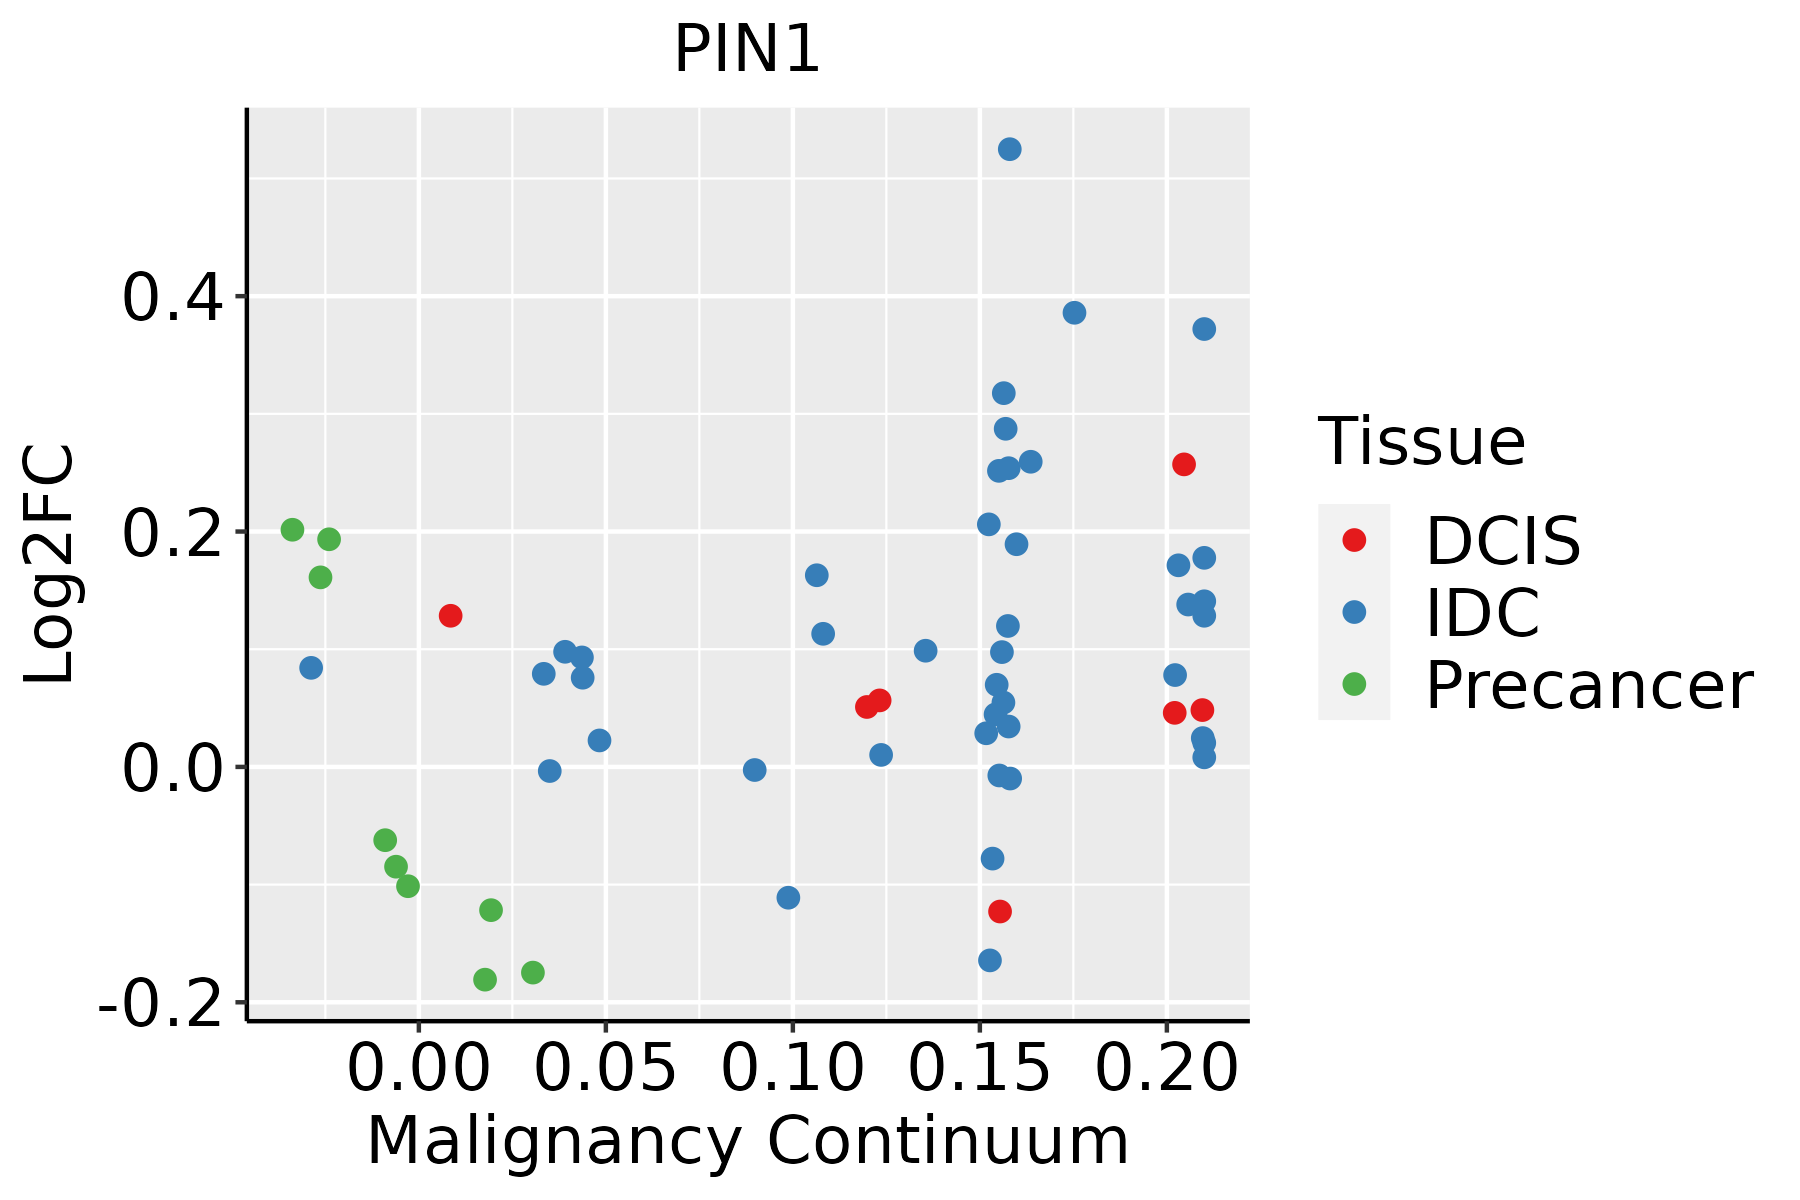 | IDC: Invasive ductal carcinoma |
| DCIS: Ductal carcinoma in situ | ||
| Precancer(BRCA1-mut): Precancerous lesion from BRCA1 mutation carriers | ||
| Esophagus |  | ESCC: Esophageal squamous cell carcinoma |
| HGIN: High-grade intraepithelial neoplasias | ||
| LGIN: Low-grade intraepithelial neoplasias | ||
| Liver | 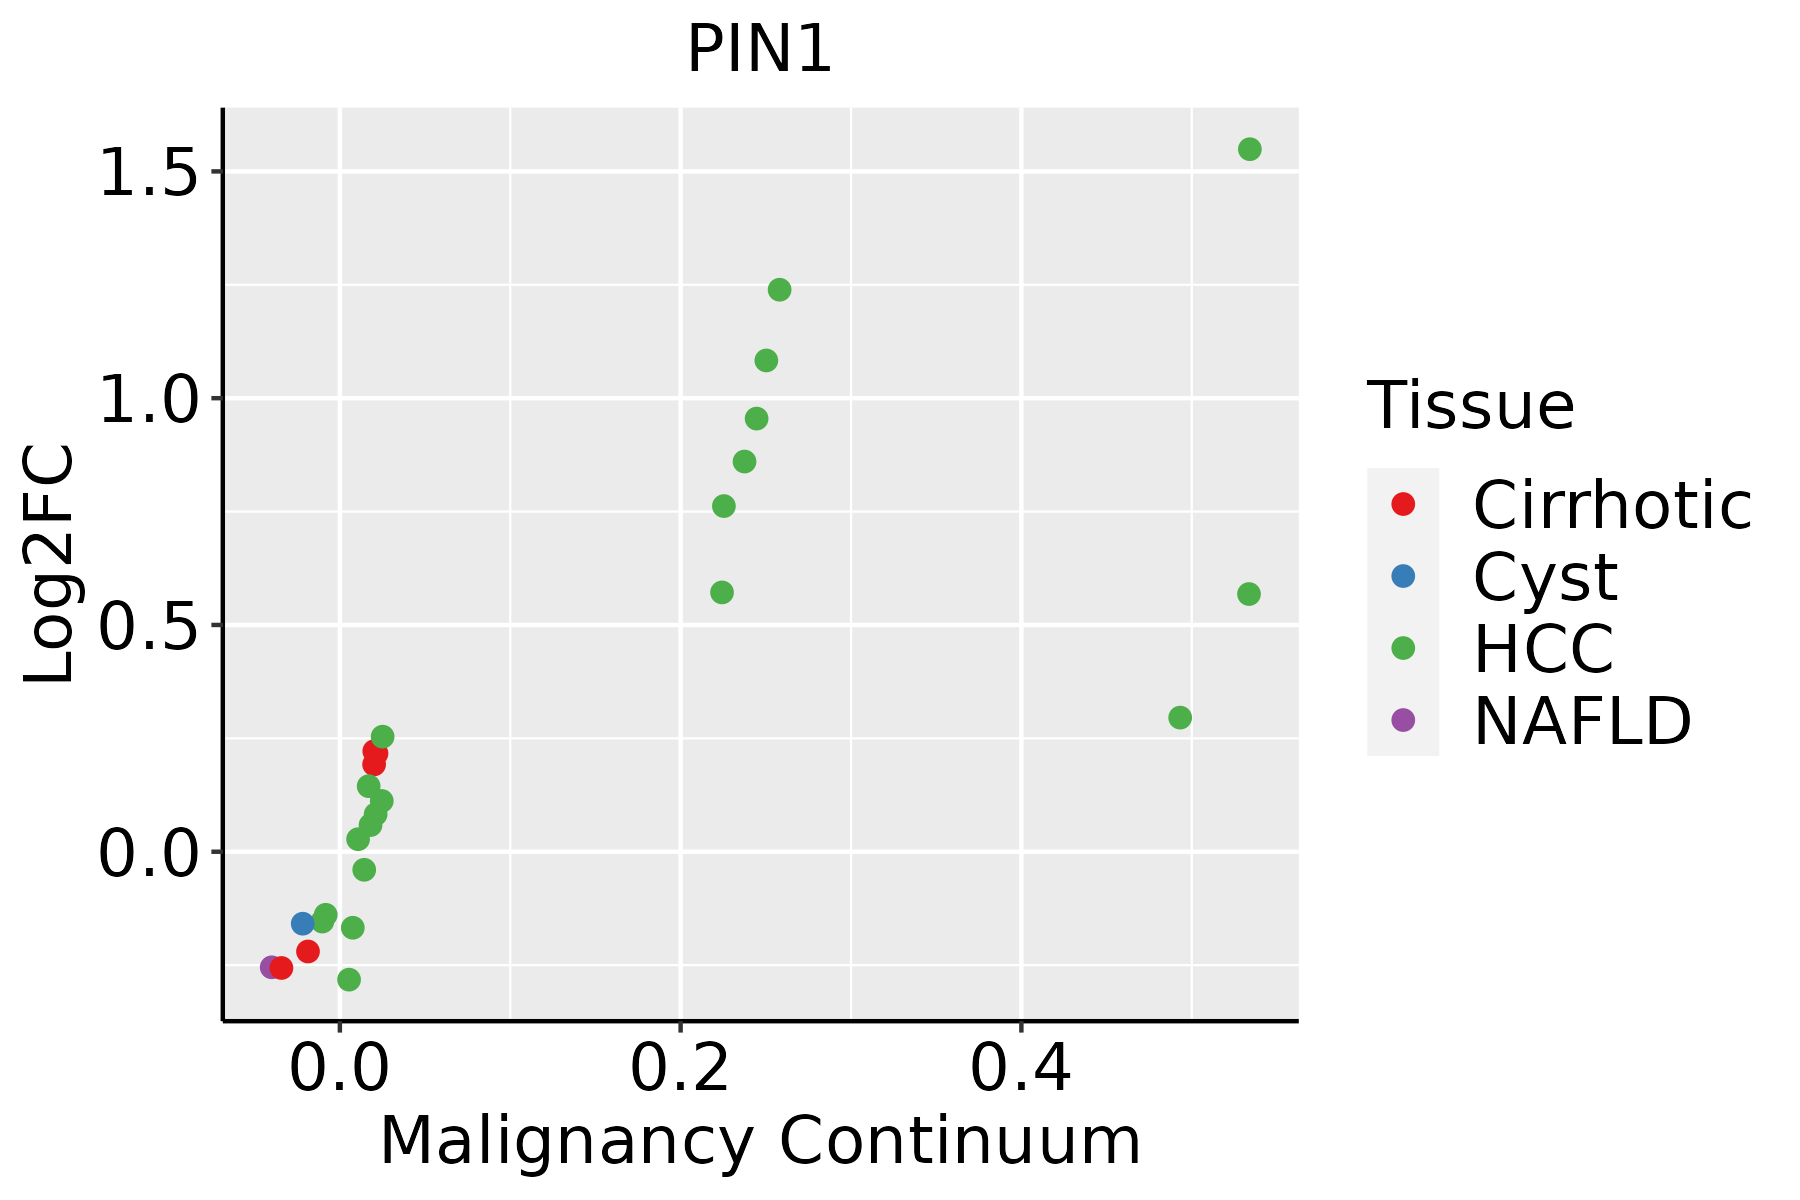 | HCC: Hepatocellular carcinoma |
| NAFLD: Non-alcoholic fatty liver disease | ||
| Oral Cavity | 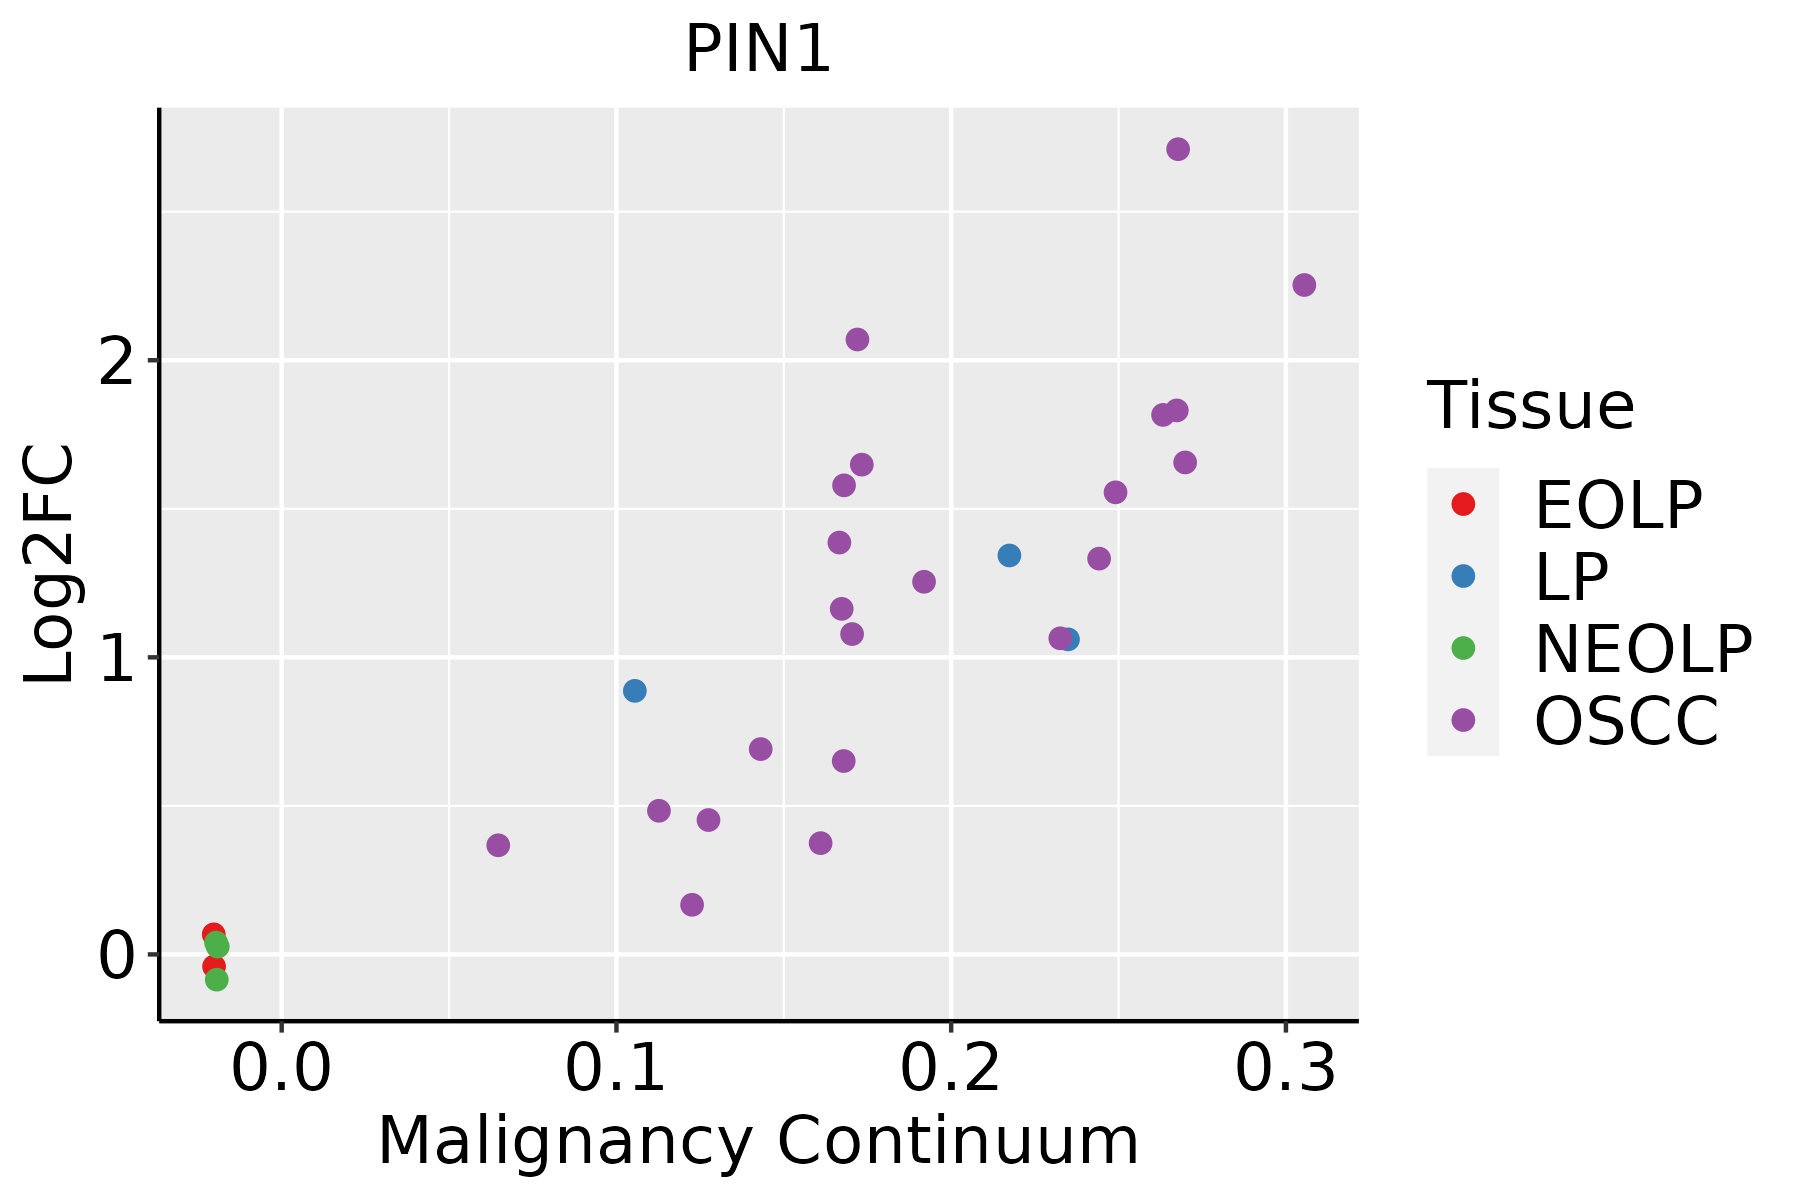 | EOLP: Erosive Oral lichen planus |
| LP: leukoplakia | ||
| NEOLP: Non-erosive oral lichen planus | ||
| OSCC: Oral squamous cell carcinoma | ||
| Prostate | 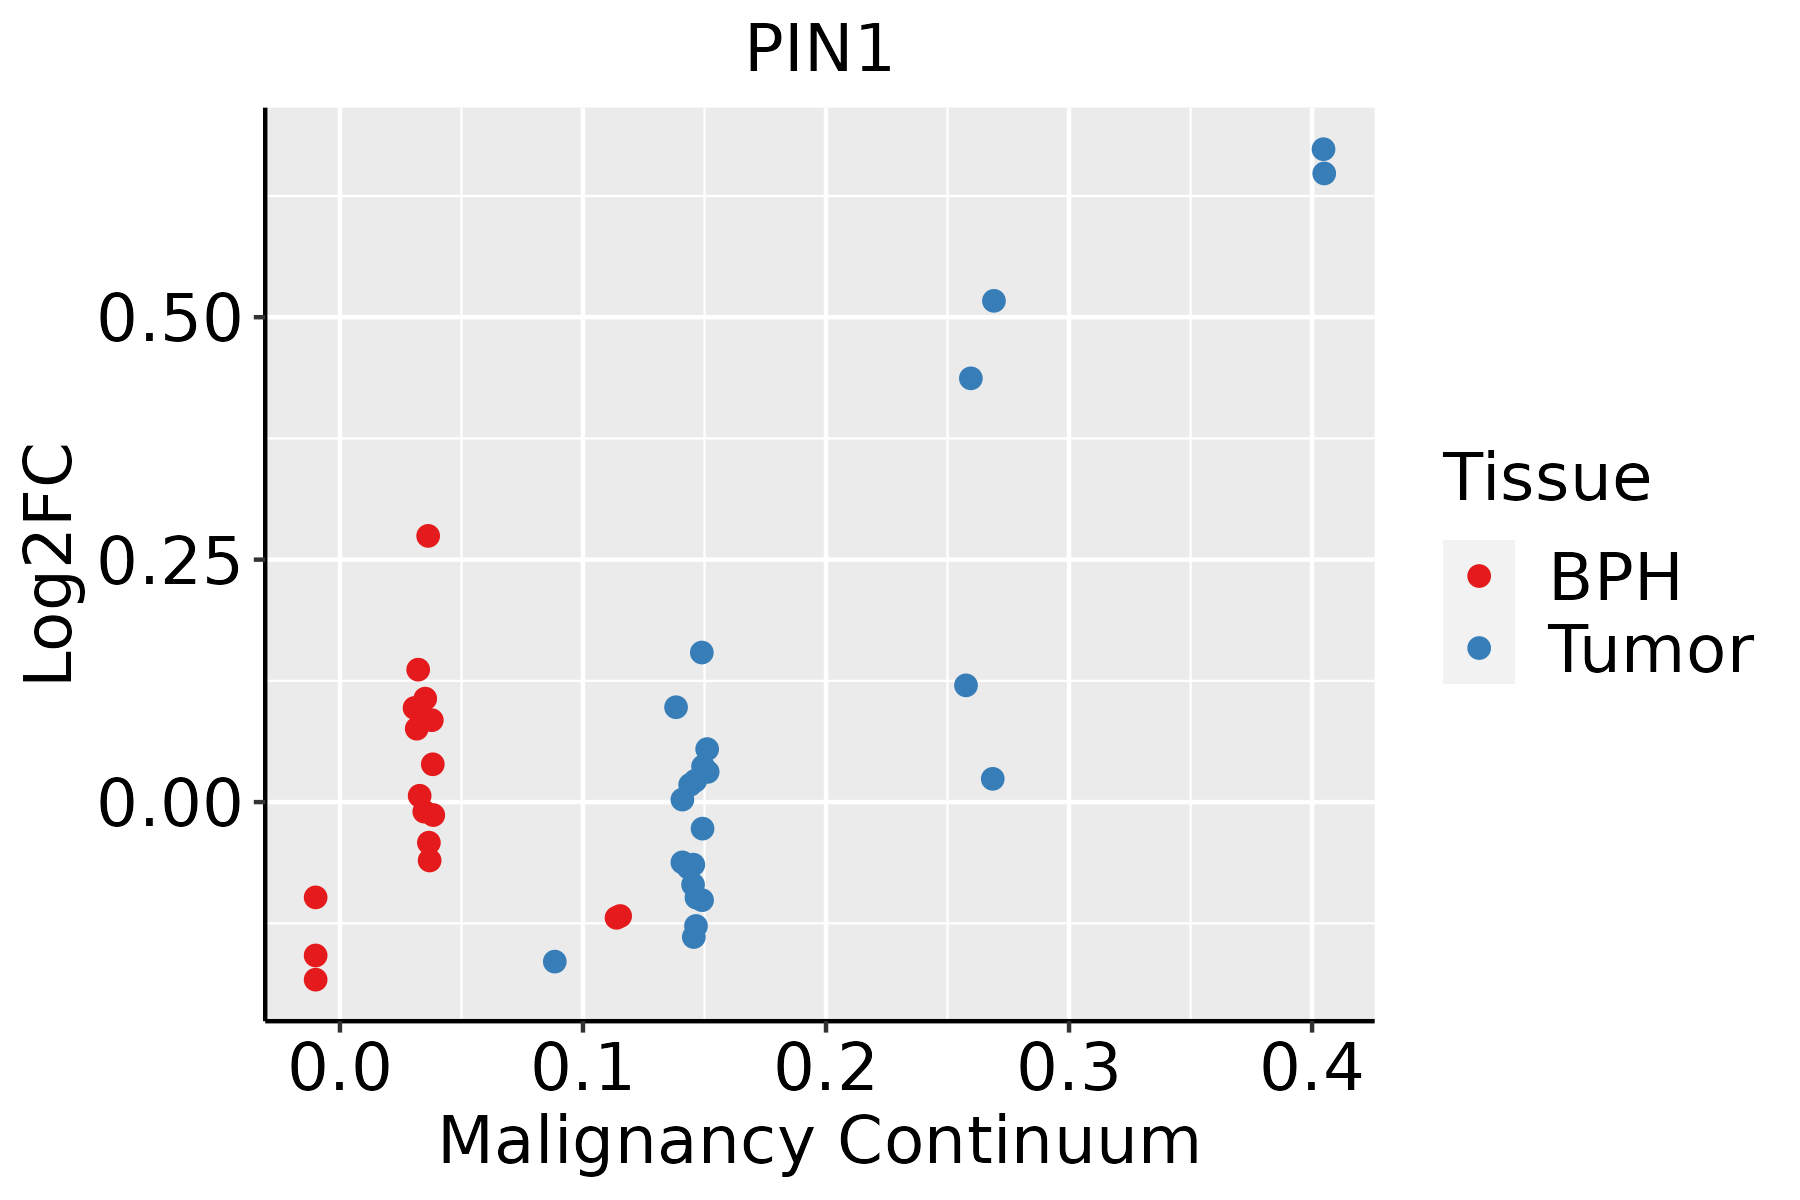 | BPH: Benign Prostatic Hyperplasia |
| Skin |  | AK: Actinic keratosis |
| cSCC: Cutaneous squamous cell carcinoma | ||
| SCCIS:squamous cell carcinoma in situ | ||
| Thyroid | 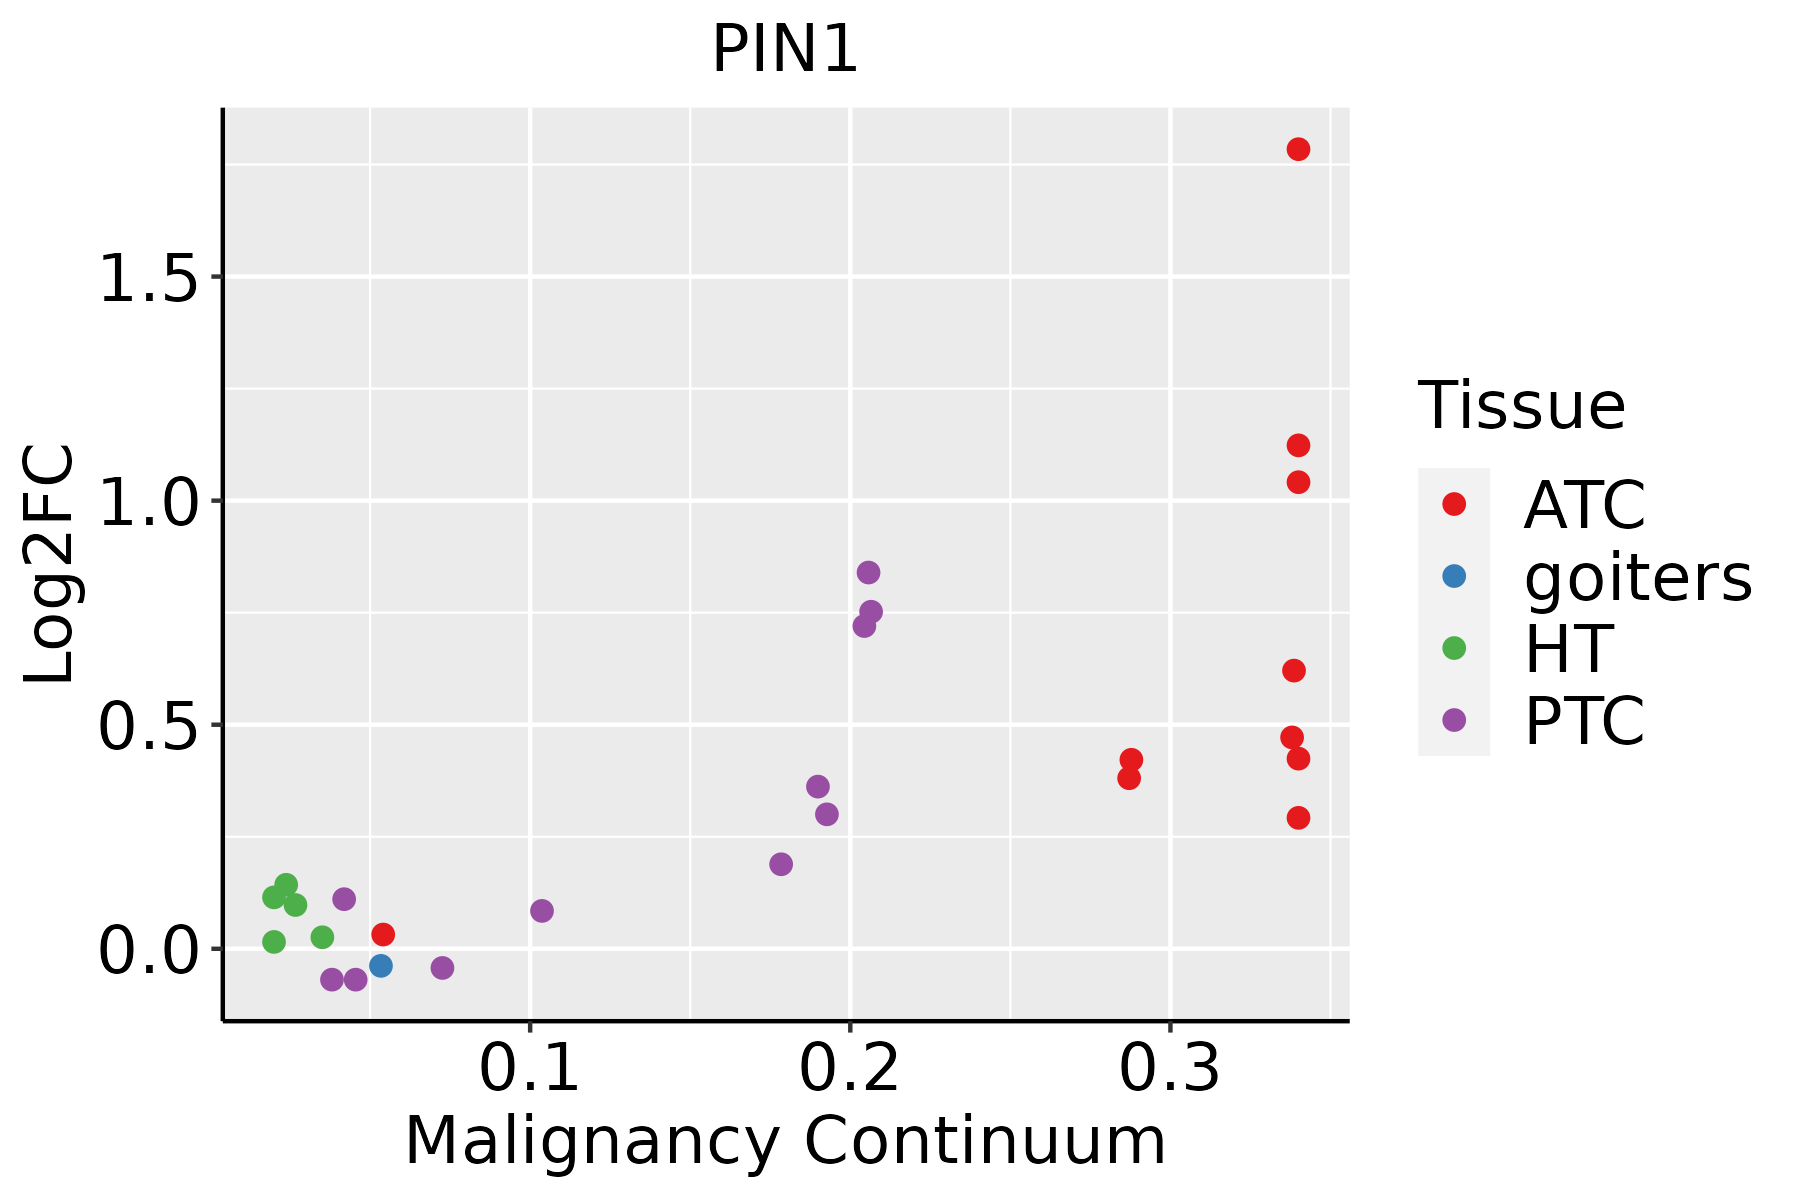 | ATC: Anaplastic thyroid cancer |
| HT: Hashimoto's thyroiditis | ||
| PTC: Papillary thyroid cancer |
| ∗log2FC in expression of this searched gene in stem-like cells from each diseased tissue sample relative to stem-like cells in normal samples in each tissue plotted against the malignancy continuum. Samples are colored based on if they are from different disease stage. |
Top |
Malignant transformation related pathway analysis |
| Find out the enriched GO biological processes and KEGG pathways involved in transition from healthy to precancer to cancer |
| Tissue | Disease Stage | Enriched GO biological Processes |
| Colorectum | AD |  |
| Colorectum | SER |  |
| Colorectum | MSS |  |
| Colorectum | MSI-H |  |
| Colorectum | FAP |  |
| ∗Top 15 enriched GO BP terms are showed in the bar plot of each disease state in each tissue. Each row represents a significant GO biological process which is colored according to the -log10(p.adjust). |
| Page: 1 2 3 4 5 6 7 8 9 |
| GO ID | Tissue | Disease Stage | Description | Gene Ratio | Bg Ratio | pvalue | p.adjust | Count |
| GO:007048214 | Breast | IDC | response to oxygen levels | 64/1434 | 347/18723 | 3.45e-11 | 5.57e-09 | 64 |
| GO:003629314 | Breast | IDC | response to decreased oxygen levels | 60/1434 | 322/18723 | 9.26e-11 | 1.25e-08 | 60 |
| GO:000166614 | Breast | IDC | response to hypoxia | 58/1434 | 307/18723 | 1.09e-10 | 1.38e-08 | 58 |
| GO:004217614 | Breast | IDC | regulation of protein catabolic process | 63/1434 | 391/18723 | 1.32e-08 | 9.61e-07 | 63 |
| GO:003164714 | Breast | IDC | regulation of protein stability | 50/1434 | 298/18723 | 1.14e-07 | 6.57e-06 | 50 |
| GO:007099714 | Breast | IDC | neuron death | 57/1434 | 361/18723 | 1.31e-07 | 7.38e-06 | 57 |
| GO:005109814 | Breast | IDC | regulation of binding | 57/1434 | 363/18723 | 1.59e-07 | 8.76e-06 | 57 |
| GO:190332014 | Breast | IDC | regulation of protein modification by small protein conjugation or removal | 43/1434 | 242/18723 | 1.71e-07 | 9.16e-06 | 43 |
| GO:005140213 | Breast | IDC | neuron apoptotic process | 42/1434 | 246/18723 | 7.21e-07 | 3.35e-05 | 42 |
| GO:005082114 | Breast | IDC | protein stabilization | 35/1434 | 191/18723 | 1.12e-06 | 5.04e-05 | 35 |
| GO:003139614 | Breast | IDC | regulation of protein ubiquitination | 37/1434 | 210/18723 | 1.50e-06 | 6.36e-05 | 37 |
| GO:190121414 | Breast | IDC | regulation of neuron death | 48/1434 | 319/18723 | 5.01e-06 | 1.69e-04 | 48 |
| GO:004352313 | Breast | IDC | regulation of neuron apoptotic process | 35/1434 | 212/18723 | 1.26e-05 | 3.29e-04 | 35 |
| GO:005109914 | Breast | IDC | positive regulation of binding | 30/1434 | 173/18723 | 1.96e-05 | 4.86e-04 | 30 |
| GO:190121614 | Breast | IDC | positive regulation of neuron death | 19/1434 | 97/18723 | 1.22e-04 | 2.25e-03 | 19 |
| GO:003530414 | Breast | IDC | regulation of protein dephosphorylation | 18/1434 | 90/18723 | 1.39e-04 | 2.48e-03 | 18 |
| GO:00512712 | Breast | IDC | negative regulation of cellular component movement | 48/1434 | 367/18723 | 1.88e-04 | 3.12e-03 | 48 |
| GO:001820812 | Breast | IDC | peptidyl-proline modification | 13/1434 | 58/18723 | 3.59e-04 | 5.18e-03 | 13 |
| GO:20001462 | Breast | IDC | negative regulation of cell motility | 46/1434 | 359/18723 | 4.01e-04 | 5.60e-03 | 46 |
| GO:00703713 | Breast | IDC | ERK1 and ERK2 cascade | 43/1434 | 330/18723 | 4.28e-04 | 5.84e-03 | 43 |
| Page: 1 2 3 4 5 6 7 8 9 10 11 12 13 14 15 16 17 18 19 20 21 22 23 24 25 26 27 28 29 30 31 32 33 34 35 36 37 38 39 40 41 42 43 44 45 46 47 48 49 50 51 52 53 54 55 56 57 |
| Pathway ID | Tissue | Disease Stage | Description | Gene Ratio | Bg Ratio | pvalue | p.adjust | qvalue | Count |
| hsa032509 | Esophagus | ESCC | Viral life cycle - HIV-1 | 54/4205 | 63/8465 | 2.01e-09 | 2.17e-08 | 1.11e-08 | 54 |
| hsa0325014 | Esophagus | ESCC | Viral life cycle - HIV-1 | 54/4205 | 63/8465 | 2.01e-09 | 2.17e-08 | 1.11e-08 | 54 |
| hsa032502 | Liver | HCC | Viral life cycle - HIV-1 | 46/4020 | 63/8465 | 3.25e-05 | 1.88e-04 | 1.04e-04 | 46 |
| hsa0325011 | Liver | HCC | Viral life cycle - HIV-1 | 46/4020 | 63/8465 | 3.25e-05 | 1.88e-04 | 1.04e-04 | 46 |
| hsa032508 | Oral cavity | OSCC | Viral life cycle - HIV-1 | 45/3704 | 63/8465 | 7.62e-06 | 3.59e-05 | 1.83e-05 | 45 |
| hsa04622 | Oral cavity | OSCC | RIG-I-like receptor signaling pathway | 41/3704 | 71/8465 | 1.20e-02 | 2.63e-02 | 1.34e-02 | 41 |
| hsa0325013 | Oral cavity | OSCC | Viral life cycle - HIV-1 | 45/3704 | 63/8465 | 7.62e-06 | 3.59e-05 | 1.83e-05 | 45 |
| hsa046221 | Oral cavity | OSCC | RIG-I-like receptor signaling pathway | 41/3704 | 71/8465 | 1.20e-02 | 2.63e-02 | 1.34e-02 | 41 |
| hsa0325022 | Oral cavity | LP | Viral life cycle - HIV-1 | 32/2418 | 63/8465 | 1.55e-04 | 9.08e-04 | 5.86e-04 | 32 |
| hsa046222 | Oral cavity | LP | RIG-I-like receptor signaling pathway | 30/2418 | 71/8465 | 9.09e-03 | 3.33e-02 | 2.14e-02 | 30 |
| hsa0325031 | Oral cavity | LP | Viral life cycle - HIV-1 | 32/2418 | 63/8465 | 1.55e-04 | 9.08e-04 | 5.86e-04 | 32 |
| hsa046223 | Oral cavity | LP | RIG-I-like receptor signaling pathway | 30/2418 | 71/8465 | 9.09e-03 | 3.33e-02 | 2.14e-02 | 30 |
| hsa032504 | Prostate | BPH | Viral life cycle - HIV-1 | 24/1718 | 63/8465 | 8.32e-04 | 3.98e-03 | 2.46e-03 | 24 |
| hsa0325012 | Prostate | BPH | Viral life cycle - HIV-1 | 24/1718 | 63/8465 | 8.32e-04 | 3.98e-03 | 2.46e-03 | 24 |
| hsa0325021 | Prostate | Tumor | Viral life cycle - HIV-1 | 25/1791 | 63/8465 | 6.13e-04 | 3.07e-03 | 1.91e-03 | 25 |
| hsa032503 | Prostate | Tumor | Viral life cycle - HIV-1 | 25/1791 | 63/8465 | 6.13e-04 | 3.07e-03 | 1.91e-03 | 25 |
| Page: 1 |
Top |
Cell-cell communication analysis |
| Identification of potential cell-cell interactions between two cell types and their ligand-receptor pairs for different disease states |
| Ligand | Receptor | LRpair | Pathway | Tissue | Disease Stage |
| Page: 1 |
Top |
Single-cell gene regulatory network inference analysis |
| Find out the significant the regulons (TFs) and the target genes of each regulon across cell types for different disease states |
| TF | Cell Type | Tissue | Disease Stage | Target Gene | RSS | Regulon Activity |
| ∗The dot plots of a searched regulon are shown for all cell subpopulations in each disease state of each tissue based on the regulon specific score inferred using pySCENIC and by calculating the average expression. |
| Page: 1 |
Top |
Somatic mutation of malignant transformation related genes |
| Annotation of somatic variants for genes involved in malignant transformation |
| Hugo Symbol | Variant Class | Variant Classification | dbSNP RS | HGVSc | HGVSp | HGVSp Short | SWISSPROT | BIOTYPE | SIFT | PolyPhen | Tumor Sample Barcode | Tissue | Histology | Sex | Age | Stage | Therapy Types | Drugs | Outcome |
| PIN1 | SNV | Missense_Mutation | novel | c.256N>A | p.Leu86Met | p.L86M | Q13526 | protein_coding | tolerated(0.25) | benign(0.301) | TCGA-2W-A8YY-01 | Cervix | cervical & endocervical cancer | Female | <65 | I/II | Chemotherapy | cisplatin | CR |
| PIN1 | SNV | Missense_Mutation | c.416T>C | p.Phe139Ser | p.F139S | Q13526 | protein_coding | deleterious(0) | probably_damaging(0.984) | TCGA-Q1-A5R2-01 | Cervix | cervical & endocervical cancer | Female | <65 | I/II | Chemotherapy | cisplatin | PR | |
| PIN1 | SNV | Missense_Mutation | c.107N>C | p.Arg36Pro | p.R36P | Q13526 | protein_coding | tolerated(1) | benign(0.006) | TCGA-CA-6716-01 | Colorectum | colon adenocarcinoma | Male | >=65 | I/II | Chemotherapy | oxaliplatin | CR | |
| PIN1 | SNV | Missense_Mutation | rs374933894 | c.314C>T | p.Ser105Phe | p.S105F | Q13526 | protein_coding | deleterious(0) | benign(0.439) | TCGA-D5-6930-01 | Colorectum | colon adenocarcinoma | Male | >=65 | I/II | Unknown | Unknown | SD |
| PIN1 | SNV | Missense_Mutation | c.334N>A | p.Asp112Asn | p.D112N | Q13526 | protein_coding | deleterious(0) | probably_damaging(0.998) | TCGA-WS-AB45-01 | Colorectum | colon adenocarcinoma | Female | <65 | I/II | Unknown | Unknown | SD | |
| PIN1 | SNV | Missense_Mutation | novel | c.166C>T | p.Arg56Cys | p.R56C | Q13526 | protein_coding | deleterious(0) | possibly_damaging(0.875) | TCGA-A5-A0G1-01 | Endometrium | uterine corpus endometrioid carcinoma | Female | >=65 | I/II | Unknown | Unknown | SD |
| PIN1 | SNV | Missense_Mutation | novel | c.409G>A | p.Ala137Thr | p.A137T | Q13526 | protein_coding | deleterious(0.01) | possibly_damaging(0.759) | TCGA-AX-A1CE-01 | Endometrium | uterine corpus endometrioid carcinoma | Female | <65 | I/II | Unspecific | Paclitaxel | SD |
| PIN1 | SNV | Missense_Mutation | novel | c.326A>G | p.Gln109Arg | p.Q109R | Q13526 | protein_coding | tolerated(0.24) | benign(0.003) | TCGA-B5-A3FC-01 | Endometrium | uterine corpus endometrioid carcinoma | Female | <65 | I/II | Unknown | Unknown | SD |
| PIN1 | SNV | Missense_Mutation | novel | c.478N>A | p.Leu160Ile | p.L160I | Q13526 | protein_coding | tolerated(0.24) | probably_damaging(0.936) | TCGA-DF-A2KU-01 | Endometrium | uterine corpus endometrioid carcinoma | Female | Unknown | I/II | Unknown | Unknown | SD |
| PIN1 | SNV | Missense_Mutation | c.115N>T | p.Gly39Cys | p.G39C | Q13526 | protein_coding | deleterious(0.01) | benign(0.393) | TCGA-G3-A25U-01 | Liver | liver hepatocellular carcinoma | Female | <65 | I/II | Unknown | Unknown | SD |
| Page: 1 2 |
Top |
Related drugs of malignant transformation related genes |
| Identification of chemicals and drugs interact with genes involved in malignant transfromation |
| (DGIdb 4.0) |
| Entrez ID | Symbol | Category | Interaction Types | Drug Claim Name | Drug Name | PMIDs |
| 5300 | PIN1 | ENZYME, KINASE, TUMOR SUPPRESSOR, DRUGGABLE GENOME | PURPURIN | PURPURIN | ||
| 5300 | PIN1 | ENZYME, KINASE, TUMOR SUPPRESSOR, DRUGGABLE GENOME | Avastin+/-Tarceva | |||
| 5300 | PIN1 | ENZYME, KINASE, TUMOR SUPPRESSOR, DRUGGABLE GENOME | TETRADECYLTHIOACETIC ACID | TETRADECYLTHIOACETIC ACID | ||
| 5300 | PIN1 | ENZYME, KINASE, TUMOR SUPPRESSOR, DRUGGABLE GENOME | AG-537 | CHEMBL67535 | ||
| 5300 | PIN1 | ENZYME, KINASE, TUMOR SUPPRESSOR, DRUGGABLE GENOME | LOBARIC ACID | LOBARIC ACID | ||
| 5300 | PIN1 | ENZYME, KINASE, TUMOR SUPPRESSOR, DRUGGABLE GENOME | oxaliplatin | OXALIPLATIN | ||
| 5300 | PIN1 | ENZYME, KINASE, TUMOR SUPPRESSOR, DRUGGABLE GENOME | irinotecan | IRINOTECAN | ||
| 5300 | PIN1 | ENZYME, KINASE, TUMOR SUPPRESSOR, DRUGGABLE GENOME | EMBELIN | EMBELIN | ||
| 5300 | PIN1 | ENZYME, KINASE, TUMOR SUPPRESSOR, DRUGGABLE GENOME | SENNOSIDE B | SENNOSIDE B | ||
| 5300 | PIN1 | ENZYME, KINASE, TUMOR SUPPRESSOR, DRUGGABLE GENOME | SJ000044511 | CHEMBL592124 |
| Page: 1 2 3 |

Copyright 2023-Present -The University of Texas Health Science Center at Houston |