
|
|||||
|
 | |
| |
| |
| |
| |
| |
|
Gene: PIM1 |
Gene summary for PIM1 |
| Gene information | Species | Human | Gene symbol | PIM1 | Gene ID | 5292 |
| Gene name | Pim-1 proto-oncogene, serine/threonine kinase | |
| Gene Alias | PIM | |
| Cytomap | 6p21.2 | |
| Gene Type | protein-coding | GO ID | GO:0002376 | UniProtAcc | P11309 |
Top |
Malignant transformation analysis |
| Identification of the aberrant gene expression in precancerous and cancerous lesions by comparing the gene expression of stem-like cells in diseased tissues with normal stem cells |
| Entrez ID | Symbol | Replicates | Species | Organ | Tissue | Adj P-value | Log2FC | Malignancy |
| 5292 | PIM1 | HTA11_1938_2000001011 | Human | Colorectum | AD | 7.66e-03 | 2.97e-01 | -0.0811 |
| 5292 | PIM1 | HTA11_411_2000001011 | Human | Colorectum | SER | 1.46e-02 | 1.00e+00 | -0.2602 |
| 5292 | PIM1 | HTA11_2112_2000001011 | Human | Colorectum | SER | 6.14e-06 | 7.52e-01 | -0.2196 |
| 5292 | PIM1 | HTA11_1391_2000001011 | Human | Colorectum | AD | 2.10e-02 | 1.47e-01 | -0.059 |
| 5292 | PIM1 | HTA11_99999970781_79442 | Human | Colorectum | MSS | 5.15e-06 | 2.00e-01 | 0.294 |
| 5292 | PIM1 | HTA11_99999971662_82457 | Human | Colorectum | MSS | 2.94e-13 | 3.88e-01 | 0.3859 |
| 5292 | PIM1 | LZE4T | Human | Esophagus | ESCC | 1.58e-15 | 4.34e-01 | 0.0811 |
| 5292 | PIM1 | LZE7T | Human | Esophagus | ESCC | 6.74e-04 | 1.92e-02 | 0.0667 |
| 5292 | PIM1 | LZE20T | Human | Esophagus | ESCC | 2.94e-04 | 5.09e-01 | 0.0662 |
| 5292 | PIM1 | LZE24T | Human | Esophagus | ESCC | 5.40e-06 | 4.07e-01 | 0.0596 |
| 5292 | PIM1 | LZE6T | Human | Esophagus | ESCC | 3.86e-02 | 3.46e-03 | 0.0845 |
| 5292 | PIM1 | P2T-E | Human | Esophagus | ESCC | 9.46e-15 | 4.61e-01 | 0.1177 |
| 5292 | PIM1 | P4T-E | Human | Esophagus | ESCC | 1.01e-18 | 5.90e-01 | 0.1323 |
| 5292 | PIM1 | P5T-E | Human | Esophagus | ESCC | 1.56e-17 | 8.41e-01 | 0.1327 |
| 5292 | PIM1 | P8T-E | Human | Esophagus | ESCC | 6.43e-26 | 8.25e-01 | 0.0889 |
| 5292 | PIM1 | P9T-E | Human | Esophagus | ESCC | 1.74e-13 | 3.05e-01 | 0.1131 |
| 5292 | PIM1 | P10T-E | Human | Esophagus | ESCC | 1.46e-22 | 8.42e-01 | 0.116 |
| 5292 | PIM1 | P11T-E | Human | Esophagus | ESCC | 3.93e-12 | 7.00e-01 | 0.1426 |
| 5292 | PIM1 | P12T-E | Human | Esophagus | ESCC | 1.48e-24 | 8.59e-01 | 0.1122 |
| 5292 | PIM1 | P15T-E | Human | Esophagus | ESCC | 3.39e-12 | 3.90e-01 | 0.1149 |
| Page: 1 2 3 4 5 |
| Tissue | Expression Dynamics | Abbreviation |
| Colorectum (GSE201348) |  | FAP: Familial adenomatous polyposis |
| CRC: Colorectal cancer | ||
| Colorectum (HTA11) | 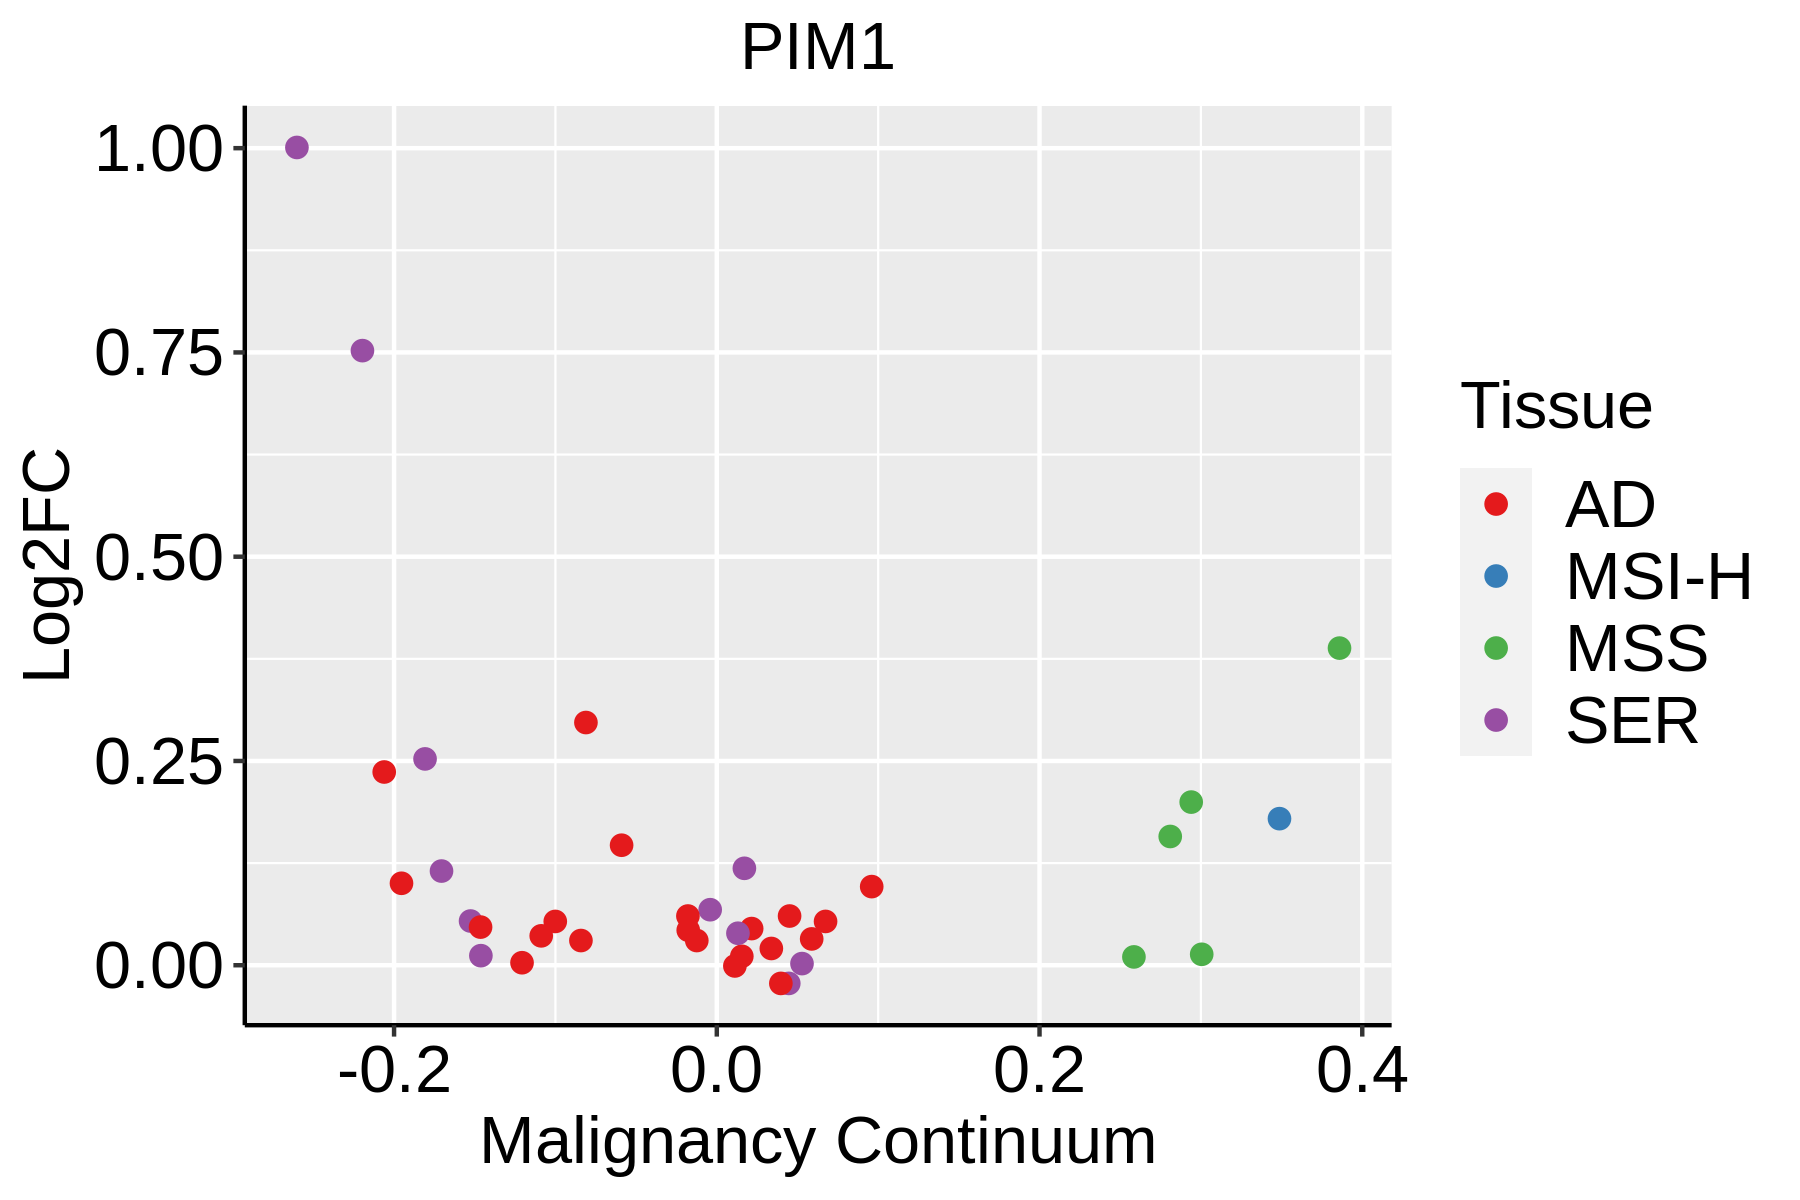 | AD: Adenomas |
| SER: Sessile serrated lesions | ||
| MSI-H: Microsatellite-high colorectal cancer | ||
| MSS: Microsatellite stable colorectal cancer | ||
| Esophagus |  | ESCC: Esophageal squamous cell carcinoma |
| HGIN: High-grade intraepithelial neoplasias | ||
| LGIN: Low-grade intraepithelial neoplasias | ||
| Liver |  | HCC: Hepatocellular carcinoma |
| NAFLD: Non-alcoholic fatty liver disease | ||
| Oral Cavity |  | EOLP: Erosive Oral lichen planus |
| LP: leukoplakia | ||
| NEOLP: Non-erosive oral lichen planus | ||
| OSCC: Oral squamous cell carcinoma | ||
| Thyroid |  | ATC: Anaplastic thyroid cancer |
| HT: Hashimoto's thyroiditis | ||
| PTC: Papillary thyroid cancer |
| ∗log2FC in expression of this searched gene in stem-like cells from each diseased tissue sample relative to stem-like cells in normal samples in each tissue plotted against the malignancy continuum. Samples are colored based on if they are from different disease stage. |
Top |
Malignant transformation related pathway analysis |
| Find out the enriched GO biological processes and KEGG pathways involved in transition from healthy to precancer to cancer |
| Tissue | Disease Stage | Enriched GO biological Processes |
| Colorectum | AD |  |
| Colorectum | SER |  |
| Colorectum | MSS |  |
| Colorectum | MSI-H |  |
| Colorectum | FAP |  |
| ∗Top 15 enriched GO BP terms are showed in the bar plot of each disease state in each tissue. Each row represents a significant GO biological process which is colored according to the -log10(p.adjust). |
| Page: 1 2 3 4 5 6 7 8 9 |
| GO ID | Tissue | Disease Stage | Description | Gene Ratio | Bg Ratio | pvalue | p.adjust | Count |
| GO:0031647 | Colorectum | AD | regulation of protein stability | 108/3918 | 298/18723 | 6.33e-10 | 5.08e-08 | 108 |
| GO:0050821 | Colorectum | AD | protein stabilization | 73/3918 | 191/18723 | 3.02e-08 | 1.64e-06 | 73 |
| GO:0009636 | Colorectum | AD | response to toxic substance | 88/3918 | 262/18723 | 1.12e-06 | 3.72e-05 | 88 |
| GO:0030522 | Colorectum | AD | intracellular receptor signaling pathway | 87/3918 | 265/18723 | 3.69e-06 | 1.03e-04 | 87 |
| GO:0031667 | Colorectum | AD | response to nutrient levels | 138/3918 | 474/18723 | 1.22e-05 | 2.68e-04 | 138 |
| GO:0046777 | Colorectum | AD | protein autophosphorylation | 74/3918 | 227/18723 | 2.48e-05 | 4.76e-04 | 74 |
| GO:0098754 | Colorectum | AD | detoxification | 53/3918 | 152/18723 | 4.63e-05 | 7.98e-04 | 53 |
| GO:0097237 | Colorectum | AD | cellular response to toxic substance | 44/3918 | 124/18723 | 1.24e-04 | 1.80e-03 | 44 |
| GO:0071496 | Colorectum | AD | cellular response to external stimulus | 94/3918 | 320/18723 | 1.98e-04 | 2.64e-03 | 94 |
| GO:1990748 | Colorectum | AD | cellular detoxification | 41/3918 | 116/18723 | 2.29e-04 | 2.97e-03 | 41 |
| GO:0045927 | Colorectum | AD | positive regulation of growth | 77/3918 | 259/18723 | 4.82e-04 | 5.27e-03 | 77 |
| GO:0048638 | Colorectum | AD | regulation of developmental growth | 92/3918 | 330/18723 | 1.48e-03 | 1.25e-02 | 92 |
| GO:0031668 | Colorectum | AD | cellular response to extracellular stimulus | 71/3918 | 246/18723 | 1.86e-03 | 1.52e-02 | 71 |
| GO:0031669 | Colorectum | AD | cellular response to nutrient levels | 63/3918 | 215/18723 | 2.19e-03 | 1.73e-02 | 63 |
| GO:0048639 | Colorectum | AD | positive regulation of developmental growth | 52/3918 | 174/18723 | 3.24e-03 | 2.38e-02 | 52 |
| GO:00316471 | Colorectum | SER | regulation of protein stability | 86/2897 | 298/18723 | 2.56e-09 | 2.42e-07 | 86 |
| GO:00508211 | Colorectum | SER | protein stabilization | 58/2897 | 191/18723 | 1.46e-07 | 8.59e-06 | 58 |
| GO:00096361 | Colorectum | SER | response to toxic substance | 71/2897 | 262/18723 | 8.63e-07 | 4.07e-05 | 71 |
| GO:00972371 | Colorectum | SER | cellular response to toxic substance | 40/2897 | 124/18723 | 2.28e-06 | 9.43e-05 | 40 |
| GO:00987541 | Colorectum | SER | detoxification | 46/2897 | 152/18723 | 3.02e-06 | 1.20e-04 | 46 |
| Page: 1 2 3 4 5 6 7 8 9 10 11 |
| Pathway ID | Tissue | Disease Stage | Description | Gene Ratio | Bg Ratio | pvalue | p.adjust | qvalue | Count |
| hsa0493310 | Esophagus | ESCC | AGE-RAGE signaling pathway in diabetic complications | 72/4205 | 100/8465 | 4.15e-06 | 2.28e-05 | 1.17e-05 | 72 |
| hsa052215 | Esophagus | ESCC | Acute myeloid leukemia | 49/4205 | 67/8465 | 7.43e-05 | 3.07e-04 | 1.57e-04 | 49 |
| hsa0493317 | Esophagus | ESCC | AGE-RAGE signaling pathway in diabetic complications | 72/4205 | 100/8465 | 4.15e-06 | 2.28e-05 | 1.17e-05 | 72 |
| hsa0522113 | Esophagus | ESCC | Acute myeloid leukemia | 49/4205 | 67/8465 | 7.43e-05 | 3.07e-04 | 1.57e-04 | 49 |
| hsa049334 | Liver | HCC | AGE-RAGE signaling pathway in diabetic complications | 62/4020 | 100/8465 | 2.35e-03 | 7.95e-03 | 4.42e-03 | 62 |
| hsa05221 | Liver | HCC | Acute myeloid leukemia | 41/4020 | 67/8465 | 1.64e-02 | 3.90e-02 | 2.17e-02 | 41 |
| hsa0493311 | Liver | HCC | AGE-RAGE signaling pathway in diabetic complications | 62/4020 | 100/8465 | 2.35e-03 | 7.95e-03 | 4.42e-03 | 62 |
| hsa052211 | Liver | HCC | Acute myeloid leukemia | 41/4020 | 67/8465 | 1.64e-02 | 3.90e-02 | 2.17e-02 | 41 |
| hsa049339 | Oral cavity | OSCC | AGE-RAGE signaling pathway in diabetic complications | 69/3704 | 100/8465 | 2.61e-07 | 1.65e-06 | 8.41e-07 | 69 |
| hsa052214 | Oral cavity | OSCC | Acute myeloid leukemia | 42/3704 | 67/8465 | 1.34e-03 | 3.75e-03 | 1.91e-03 | 42 |
| hsa0493316 | Oral cavity | OSCC | AGE-RAGE signaling pathway in diabetic complications | 69/3704 | 100/8465 | 2.61e-07 | 1.65e-06 | 8.41e-07 | 69 |
| hsa0522112 | Oral cavity | OSCC | Acute myeloid leukemia | 42/3704 | 67/8465 | 1.34e-03 | 3.75e-03 | 1.91e-03 | 42 |
| hsa0493323 | Oral cavity | LP | AGE-RAGE signaling pathway in diabetic complications | 39/2418 | 100/8465 | 1.53e-02 | 4.75e-02 | 3.06e-02 | 39 |
| hsa0493333 | Oral cavity | LP | AGE-RAGE signaling pathway in diabetic complications | 39/2418 | 100/8465 | 1.53e-02 | 4.75e-02 | 3.06e-02 | 39 |
| hsa0493361 | Oral cavity | NEOLP | AGE-RAGE signaling pathway in diabetic complications | 32/1112 | 100/8465 | 7.36e-07 | 9.10e-06 | 5.72e-06 | 32 |
| hsa0493371 | Oral cavity | NEOLP | AGE-RAGE signaling pathway in diabetic complications | 32/1112 | 100/8465 | 7.36e-07 | 9.10e-06 | 5.72e-06 | 32 |
| Page: 1 |
Top |
Cell-cell communication analysis |
| Identification of potential cell-cell interactions between two cell types and their ligand-receptor pairs for different disease states |
| Ligand | Receptor | LRpair | Pathway | Tissue | Disease Stage |
| Page: 1 |
Top |
Single-cell gene regulatory network inference analysis |
| Find out the significant the regulons (TFs) and the target genes of each regulon across cell types for different disease states |
| TF | Cell Type | Tissue | Disease Stage | Target Gene | RSS | Regulon Activity |
| ∗The dot plots of a searched regulon are shown for all cell subpopulations in each disease state of each tissue based on the regulon specific score inferred using pySCENIC and by calculating the average expression. |
| Page: 1 |
Top |
Somatic mutation of malignant transformation related genes |
| Annotation of somatic variants for genes involved in malignant transformation |
| Hugo Symbol | Variant Class | Variant Classification | dbSNP RS | HGVSc | HGVSp | HGVSp Short | SWISSPROT | BIOTYPE | SIFT | PolyPhen | Tumor Sample Barcode | Tissue | Histology | Sex | Age | Stage | Therapy Types | Drugs | Outcome |
| PIM1 | SNV | Missense_Mutation | c.438N>A | p.Ser146Arg | p.S146R | P11309 | protein_coding | tolerated(0.78) | benign(0.013) | TCGA-A8-A06X-01 | Breast | breast invasive carcinoma | Female | >=65 | I/II | Unknown | Unknown | SD | |
| PIM1 | insertion | Nonsense_Mutation | novel | c.747_748insCAGTTAGTTCCAGGCTTTCCCGATGAATAAG | p.Arg250GlnfsTer10 | p.R250Qfs*10 | P11309 | protein_coding | TCGA-B6-A0IM-01 | Breast | breast invasive carcinoma | Female | >=65 | I/II | Unknown | Unknown | SD | ||
| PIM1 | SNV | Missense_Mutation | c.614G>A | p.Arg205Gln | p.R205Q | P11309 | protein_coding | deleterious(0.02) | probably_damaging(0.955) | TCGA-2W-A8YY-01 | Cervix | cervical & endocervical cancer | Female | <65 | I/II | Chemotherapy | cisplatin | CR | |
| PIM1 | SNV | Missense_Mutation | rs551680157 | c.152C>G | p.Ser51Trp | p.S51W | P11309 | protein_coding | deleterious(0) | probably_damaging(0.983) | TCGA-IR-A3LA-01 | Cervix | cervical & endocervical cancer | Female | <65 | I/II | Chemotherapy | cisplatin | CR |
| PIM1 | SNV | Missense_Mutation | rs752976281 | c.640N>T | p.Arg214Cys | p.R214C | P11309 | protein_coding | tolerated(0.13) | probably_damaging(0.929) | TCGA-AA-3864-01 | Colorectum | colon adenocarcinoma | Male | >=65 | I/II | Unknown | Unknown | SD |
| PIM1 | SNV | Missense_Mutation | c.614N>A | p.Arg205Gln | p.R205Q | P11309 | protein_coding | deleterious(0.02) | probably_damaging(0.955) | TCGA-AD-6889-01 | Colorectum | colon adenocarcinoma | Male | >=65 | I/II | Chemotherapy | xeloda | PD | |
| PIM1 | SNV | Missense_Mutation | rs773910971 | c.736N>A | p.Glu246Lys | p.E246K | P11309 | protein_coding | tolerated(0.06) | benign(0.079) | TCGA-CA-6717-01 | Colorectum | colon adenocarcinoma | Male | <65 | I/II | Chemotherapy | oxaliplatin | CR |
| PIM1 | SNV | Missense_Mutation | c.870N>A | p.Met290Ile | p.M290I | P11309 | protein_coding | tolerated(0.07) | benign(0.247) | TCGA-WS-AB45-01 | Colorectum | colon adenocarcinoma | Female | <65 | I/II | Unknown | Unknown | SD | |
| PIM1 | SNV | Missense_Mutation | novel | c.335N>T | p.Arg112Met | p.R112M | P11309 | protein_coding | tolerated(0.11) | benign(0.267) | TCGA-A5-A0G2-01 | Endometrium | uterine corpus endometrioid carcinoma | Female | <65 | III/IV | Unknown | Unknown | SD |
| PIM1 | SNV | Missense_Mutation | novel | c.650N>A | p.Arg217His | p.R217H | P11309 | protein_coding | tolerated(0.08) | benign(0.361) | TCGA-A5-A1OF-01 | Endometrium | uterine corpus endometrioid carcinoma | Female | <65 | I/II | Unknown | Unknown | SD |
| Page: 1 2 3 |
Top |
Related drugs of malignant transformation related genes |
| Identification of chemicals and drugs interact with genes involved in malignant transfromation |
| (DGIdb 4.0) |
| Entrez ID | Symbol | Category | Interaction Types | Drug Claim Name | Drug Name | PMIDs |
| 5292 | PIM1 | TRANSCRIPTION FACTOR BINDING, SERINE THREONINE KINASE, KINASE, DRUGGABLE GENOME, CLINICALLY ACTIONABLE, ENZYME | INCB53914 | |||
| 5292 | PIM1 | TRANSCRIPTION FACTOR BINDING, SERINE THREONINE KINASE, KINASE, DRUGGABLE GENOME, CLINICALLY ACTIONABLE, ENZYME | inhibitor | CHEMBL3545194 | LGH-447 | |
| 5292 | PIM1 | TRANSCRIPTION FACTOR BINDING, SERINE THREONINE KINASE, KINASE, DRUGGABLE GENOME, CLINICALLY ACTIONABLE, ENZYME | inhibitor | 249565836 | ||
| 5292 | PIM1 | TRANSCRIPTION FACTOR BINDING, SERINE THREONINE KINASE, KINASE, DRUGGABLE GENOME, CLINICALLY ACTIONABLE, ENZYME | CXR-1002 | |||
| 5292 | PIM1 | TRANSCRIPTION FACTOR BINDING, SERINE THREONINE KINASE, KINASE, DRUGGABLE GENOME, CLINICALLY ACTIONABLE, ENZYME | BAS-8770957 | CHEMBL500812 | 19179076 | |
| 5292 | PIM1 | TRANSCRIPTION FACTOR BINDING, SERINE THREONINE KINASE, KINASE, DRUGGABLE GENOME, CLINICALLY ACTIONABLE, ENZYME | TCMDC-125758 | CHEMBL546797 | ||
| 5292 | PIM1 | TRANSCRIPTION FACTOR BINDING, SERINE THREONINE KINASE, KINASE, DRUGGABLE GENOME, CLINICALLY ACTIONABLE, ENZYME | inhibitor | CHEMBL1952329 | SGI-1776 | |
| 5292 | PIM1 | TRANSCRIPTION FACTOR BINDING, SERINE THREONINE KINASE, KINASE, DRUGGABLE GENOME, CLINICALLY ACTIONABLE, ENZYME | BAS-8770951 | CHEMBL478323 | 19179076 | |
| 5292 | PIM1 | TRANSCRIPTION FACTOR BINDING, SERINE THREONINE KINASE, KINASE, DRUGGABLE GENOME, CLINICALLY ACTIONABLE, ENZYME | inhibitor | 249565793 | ||
| 5292 | PIM1 | TRANSCRIPTION FACTOR BINDING, SERINE THREONINE KINASE, KINASE, DRUGGABLE GENOME, CLINICALLY ACTIONABLE, ENZYME | AZAKENPAULLONE | AZAKENPAULLONE |
| Page: 1 2 3 4 5 6 |

Copyright 2023-Present -The University of Texas Health Science Center at Houston |