
|
|||||
|
 | |
| |
| |
| |
| |
| |
|
Gene: PILRB |
Gene summary for PILRB |
| Gene information | Species | Human | Gene symbol | PILRB | Gene ID | 29990 |
| Gene name | paired immunoglobin like type 2 receptor beta | |
| Gene Alias | FDFACT1 | |
| Cytomap | 7q22.1 | |
| Gene Type | protein-coding | GO ID | GO:0001932 | UniProtAcc | Q9UKJ0 |
Top |
Malignant transformation analysis |
| Identification of the aberrant gene expression in precancerous and cancerous lesions by comparing the gene expression of stem-like cells in diseased tissues with normal stem cells |
| Entrez ID | Symbol | Replicates | Species | Organ | Tissue | Adj P-value | Log2FC | Malignancy |
| 29990 | PILRB | LZE4T | Human | Esophagus | ESCC | 2.37e-02 | 1.35e-01 | 0.0811 |
| 29990 | PILRB | LZE7T | Human | Esophagus | ESCC | 3.42e-17 | 4.84e-01 | 0.0667 |
| 29990 | PILRB | LZE8T | Human | Esophagus | ESCC | 2.72e-03 | 1.26e-01 | 0.067 |
| 29990 | PILRB | LZE20T | Human | Esophagus | ESCC | 7.18e-07 | 2.33e-01 | 0.0662 |
| 29990 | PILRB | LZE22D1 | Human | Esophagus | HGIN | 4.30e-07 | 2.85e-01 | 0.0595 |
| 29990 | PILRB | LZE22T | Human | Esophagus | ESCC | 1.48e-05 | 3.29e-01 | 0.068 |
| 29990 | PILRB | LZE24T | Human | Esophagus | ESCC | 5.64e-10 | 2.65e-01 | 0.0596 |
| 29990 | PILRB | LZE21T | Human | Esophagus | ESCC | 1.78e-08 | 4.22e-01 | 0.0655 |
| 29990 | PILRB | P1T-E | Human | Esophagus | ESCC | 1.59e-20 | 7.69e-01 | 0.0875 |
| 29990 | PILRB | P2T-E | Human | Esophagus | ESCC | 9.52e-26 | 5.71e-01 | 0.1177 |
| 29990 | PILRB | P4T-E | Human | Esophagus | ESCC | 1.22e-08 | 2.09e-01 | 0.1323 |
| 29990 | PILRB | P5T-E | Human | Esophagus | ESCC | 6.10e-07 | 1.07e-01 | 0.1327 |
| 29990 | PILRB | P8T-E | Human | Esophagus | ESCC | 5.70e-24 | 4.57e-01 | 0.0889 |
| 29990 | PILRB | P9T-E | Human | Esophagus | ESCC | 5.58e-22 | 4.45e-01 | 0.1131 |
| 29990 | PILRB | P10T-E | Human | Esophagus | ESCC | 6.45e-20 | 3.39e-01 | 0.116 |
| 29990 | PILRB | P11T-E | Human | Esophagus | ESCC | 1.20e-09 | 3.01e-01 | 0.1426 |
| 29990 | PILRB | P12T-E | Human | Esophagus | ESCC | 1.58e-10 | 2.66e-01 | 0.1122 |
| 29990 | PILRB | P15T-E | Human | Esophagus | ESCC | 7.88e-24 | 4.92e-01 | 0.1149 |
| 29990 | PILRB | P16T-E | Human | Esophagus | ESCC | 1.27e-13 | 2.93e-01 | 0.1153 |
| 29990 | PILRB | P17T-E | Human | Esophagus | ESCC | 1.49e-05 | 2.31e-01 | 0.1278 |
| Page: 1 2 3 4 5 |
| Tissue | Expression Dynamics | Abbreviation |
| Esophagus |  | ESCC: Esophageal squamous cell carcinoma |
| HGIN: High-grade intraepithelial neoplasias | ||
| LGIN: Low-grade intraepithelial neoplasias | ||
| Liver |  | HCC: Hepatocellular carcinoma |
| NAFLD: Non-alcoholic fatty liver disease | ||
| Oral Cavity | 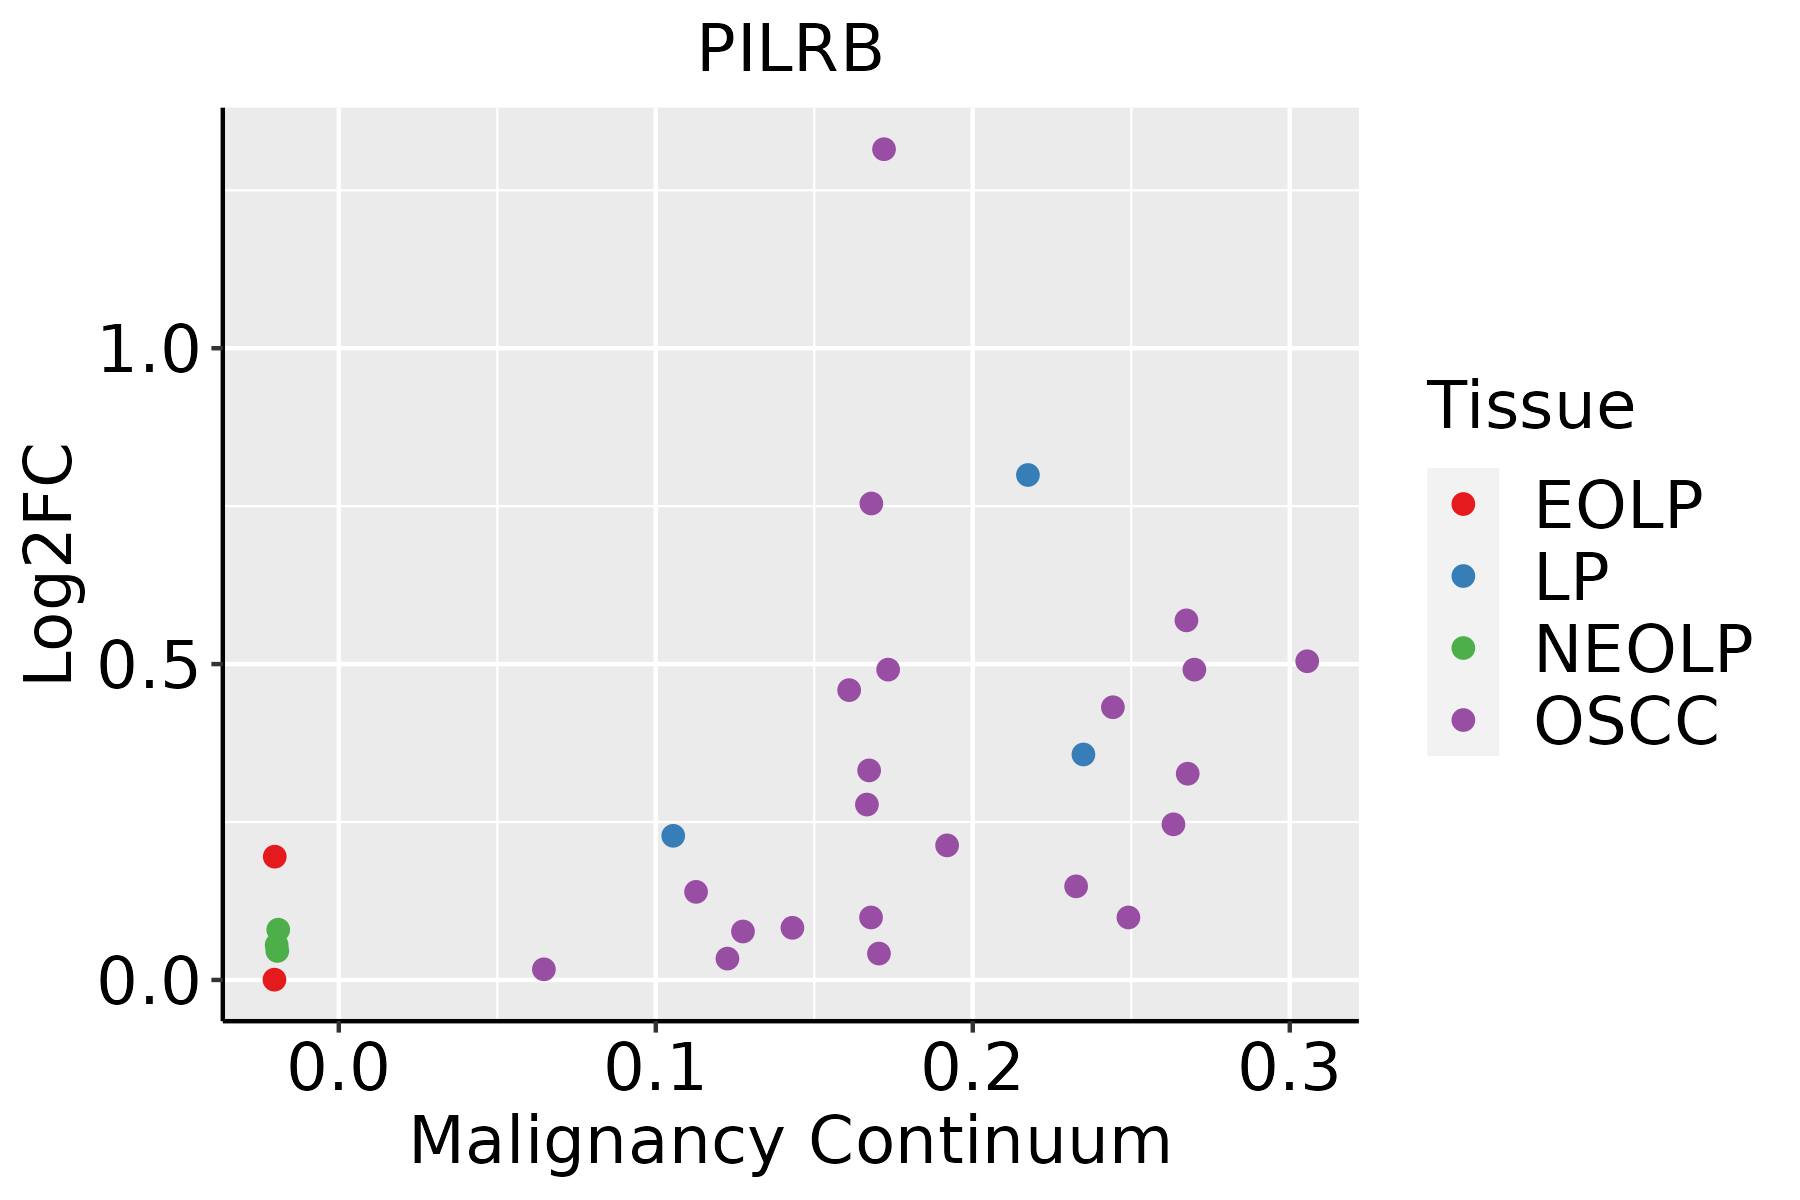 | EOLP: Erosive Oral lichen planus |
| LP: leukoplakia | ||
| NEOLP: Non-erosive oral lichen planus | ||
| OSCC: Oral squamous cell carcinoma | ||
| Thyroid | 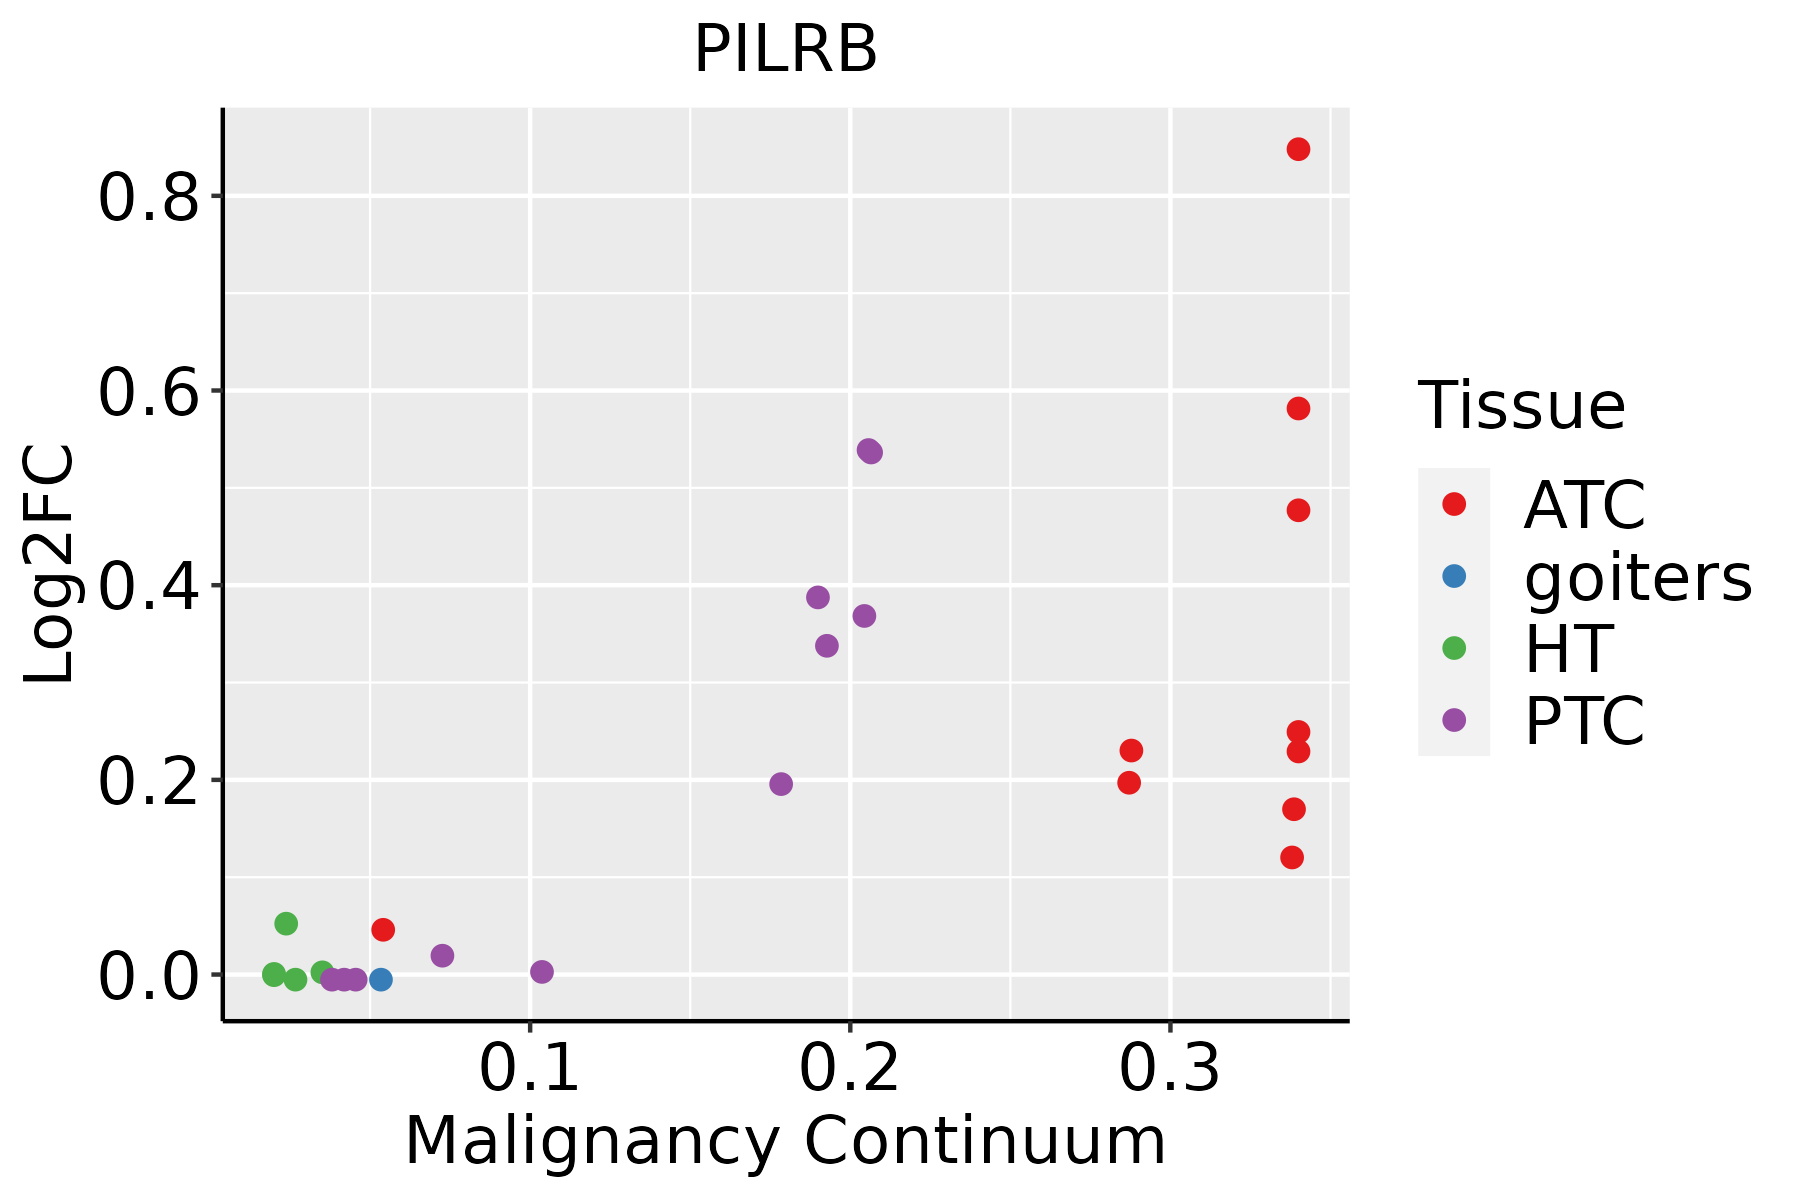 | ATC: Anaplastic thyroid cancer |
| HT: Hashimoto's thyroiditis | ||
| PTC: Papillary thyroid cancer |
| ∗log2FC in expression of this searched gene in stem-like cells from each diseased tissue sample relative to stem-like cells in normal samples in each tissue plotted against the malignancy continuum. Samples are colored based on if they are from different disease stage. |
Top |
Malignant transformation related pathway analysis |
| Find out the enriched GO biological processes and KEGG pathways involved in transition from healthy to precancer to cancer |
| Tissue | Disease Stage | Enriched GO biological Processes |
| Colorectum | AD |  |
| Colorectum | SER |  |
| Colorectum | MSS |  |
| Colorectum | MSI-H |  |
| Colorectum | FAP |  |
| ∗Top 15 enriched GO BP terms are showed in the bar plot of each disease state in each tissue. Each row represents a significant GO biological process which is colored according to the -log10(p.adjust). |
| Page: 1 2 3 4 5 6 7 8 9 |
| GO ID | Tissue | Disease Stage | Description | Gene Ratio | Bg Ratio | pvalue | p.adjust | Count |
| GO:004586018 | Esophagus | ESCC | positive regulation of protein kinase activity | 219/8552 | 386/18723 | 6.91e-06 | 6.97e-05 | 219 |
| GO:003367420 | Esophagus | ESCC | positive regulation of kinase activity | 260/8552 | 467/18723 | 7.26e-06 | 7.22e-05 | 260 |
| GO:004586011 | Liver | Cirrhotic | positive regulation of protein kinase activity | 117/4634 | 386/18723 | 7.07e-03 | 3.41e-02 | 117 |
| GO:004586021 | Liver | HCC | positive regulation of protein kinase activity | 194/7958 | 386/18723 | 1.16e-03 | 6.54e-03 | 194 |
| GO:003367411 | Liver | HCC | positive regulation of kinase activity | 230/7958 | 467/18723 | 1.72e-03 | 8.95e-03 | 230 |
| GO:00321471 | Liver | HCC | activation of protein kinase activity | 72/7958 | 134/18723 | 5.61e-03 | 2.33e-02 | 72 |
| GO:004586016 | Oral cavity | OSCC | positive regulation of protein kinase activity | 194/7305 | 386/18723 | 3.90e-06 | 4.59e-05 | 194 |
| GO:003367418 | Oral cavity | OSCC | positive regulation of kinase activity | 228/7305 | 467/18723 | 8.31e-06 | 8.90e-05 | 228 |
| GO:004586017 | Oral cavity | EOLP | positive regulation of protein kinase activity | 74/2218 | 386/18723 | 1.78e-05 | 2.89e-04 | 74 |
| GO:003367419 | Oral cavity | EOLP | positive regulation of kinase activity | 82/2218 | 467/18723 | 1.58e-04 | 1.68e-03 | 82 |
| GO:0045860111 | Thyroid | PTC | positive regulation of protein kinase activity | 176/5968 | 386/18723 | 8.89e-09 | 2.17e-07 | 176 |
| GO:0033674111 | Thyroid | PTC | positive regulation of kinase activity | 201/5968 | 467/18723 | 1.95e-07 | 3.54e-06 | 201 |
| GO:00321472 | Thyroid | PTC | activation of protein kinase activity | 60/5968 | 134/18723 | 1.15e-03 | 6.71e-03 | 60 |
| GO:004586026 | Thyroid | ATC | positive regulation of protein kinase activity | 185/6293 | 386/18723 | 3.00e-09 | 7.02e-08 | 185 |
| GO:003367427 | Thyroid | ATC | positive regulation of kinase activity | 212/6293 | 467/18723 | 5.89e-08 | 1.05e-06 | 212 |
| GO:003214711 | Thyroid | ATC | activation of protein kinase activity | 65/6293 | 134/18723 | 2.44e-04 | 1.57e-03 | 65 |
| Page: 1 |
| Pathway ID | Tissue | Disease Stage | Description | Gene Ratio | Bg Ratio | pvalue | p.adjust | qvalue | Count |
| Page: 1 |
Top |
Cell-cell communication analysis |
| Identification of potential cell-cell interactions between two cell types and their ligand-receptor pairs for different disease states |
| Ligand | Receptor | LRpair | Pathway | Tissue | Disease Stage |
| Page: 1 |
Top |
Single-cell gene regulatory network inference analysis |
| Find out the significant the regulons (TFs) and the target genes of each regulon across cell types for different disease states |
| TF | Cell Type | Tissue | Disease Stage | Target Gene | RSS | Regulon Activity |
| ∗The dot plots of a searched regulon are shown for all cell subpopulations in each disease state of each tissue based on the regulon specific score inferred using pySCENIC and by calculating the average expression. |
| Page: 1 |
Top |
Somatic mutation of malignant transformation related genes |
| Annotation of somatic variants for genes involved in malignant transformation |
| Hugo Symbol | Variant Class | Variant Classification | dbSNP RS | HGVSc | HGVSp | HGVSp Short | SWISSPROT | BIOTYPE | SIFT | PolyPhen | Tumor Sample Barcode | Tissue | Histology | Sex | Age | Stage | Therapy Types | Drugs | Outcome |
| PILRB | SNV | Missense_Mutation | rs747302326 | c.187N>G | p.Ile63Val | p.I63V | Q9UKJ0 | protein_coding | deleterious(0.04) | benign(0.001) | TCGA-AN-A0FW-01 | Breast | breast invasive carcinoma | Female | >=65 | III/IV | Unknown | Unknown | SD |
| PILRB | SNV | Missense_Mutation | rs762349237 | c.257N>T | p.Pro86Leu | p.P86L | Q9UKJ0 | protein_coding | tolerated(0.2) | probably_damaging(0.972) | TCGA-AA-3864-01 | Colorectum | colon adenocarcinoma | Male | >=65 | I/II | Unknown | Unknown | SD |
| PILRB | SNV | Missense_Mutation | novel | c.238T>C | p.Ser80Pro | p.S80P | Q9UKJ0 | protein_coding | deleterious(0.03) | possibly_damaging(0.461) | TCGA-AY-4070-01 | Colorectum | colon adenocarcinoma | Female | <65 | III/IV | Chemotherapy | 5-fu | PD |
| PILRB | SNV | Missense_Mutation | rs750745714 | c.382N>A | p.Glu128Lys | p.E128K | Q9UKJ0 | protein_coding | tolerated(0.21) | benign(0.387) | TCGA-AG-4015-01 | Colorectum | rectum adenocarcinoma | Female | >=65 | I/II | Unknown | Unknown | SD |
| PILRB | SNV | Missense_Mutation | c.145G>A | p.Val49Met | p.V49M | Q9UKJ0 | protein_coding | deleterious(0) | probably_damaging(0.989) | TCGA-EI-6881-01 | Colorectum | rectum adenocarcinoma | Male | <65 | III/IV | Chemotherapy | 5 | SD | |
| PILRB | SNV | Missense_Mutation | c.455N>A | p.Ala152Asp | p.A152D | Q9UKJ0 | protein_coding | deleterious(0.04) | benign(0.427) | TCGA-AP-A059-01 | Endometrium | uterine corpus endometrioid carcinoma | Female | >=65 | I/II | Unknown | Unknown | SD | |
| PILRB | SNV | Missense_Mutation | novel | c.671N>T | p.Ser224Ile | p.S224I | Q9UKJ0 | protein_coding | deleterious(0.05) | benign(0.438) | TCGA-AP-A1DV-01 | Endometrium | uterine corpus endometrioid carcinoma | Female | <65 | I/II | Unknown | Unknown | SD |
| PILRB | SNV | Missense_Mutation | rs375039008 | c.589N>A | p.Ala197Thr | p.A197T | Q9UKJ0 | protein_coding | tolerated(0.25) | benign(0.009) | TCGA-AX-A2H7-01 | Endometrium | uterine corpus endometrioid carcinoma | Female | >=65 | I/II | Unknown | Unknown | PD |
| PILRB | SNV | Missense_Mutation | rs371931442 | c.505G>A | p.Gly169Ser | p.G169S | Q9UKJ0 | protein_coding | deleterious(0.04) | benign(0.389) | TCGA-B5-A11E-01 | Endometrium | uterine corpus endometrioid carcinoma | Female | <65 | I/II | Unknown | Unknown | SD |
| PILRB | SNV | Missense_Mutation | novel | c.384N>T | p.Glu128Asp | p.E128D | Q9UKJ0 | protein_coding | tolerated(0.12) | benign(0.026) | TCGA-B5-A3FA-01 | Endometrium | uterine corpus endometrioid carcinoma | Female | >=65 | I/II | Unknown | Unknown | SD |
| Page: 1 2 |
Top |
Related drugs of malignant transformation related genes |
| Identification of chemicals and drugs interact with genes involved in malignant transfromation |
| (DGIdb 4.0) |
| Entrez ID | Symbol | Category | Interaction Types | Drug Claim Name | Drug Name | PMIDs |
| Page: 1 |

Copyright 2023-Present -The University of Texas Health Science Center at Houston |