
|
|||||
|
 | |
| |
| |
| |
| |
| |
|
Gene: PIKFYVE |
Gene summary for PIKFYVE |
| Gene information | Species | Human | Gene symbol | PIKFYVE | Gene ID | 200576 |
| Gene name | phosphoinositide kinase, FYVE-type zinc finger containing | |
| Gene Alias | CFD | |
| Cytomap | 2q34 | |
| Gene Type | protein-coding | GO ID | GO:0000045 | UniProtAcc | Q9Y2I7 |
Top |
Malignant transformation analysis |
| Identification of the aberrant gene expression in precancerous and cancerous lesions by comparing the gene expression of stem-like cells in diseased tissues with normal stem cells |
| Entrez ID | Symbol | Replicates | Species | Organ | Tissue | Adj P-value | Log2FC | Malignancy |
| 200576 | PIKFYVE | LZE4T | Human | Esophagus | ESCC | 1.08e-05 | 1.39e-01 | 0.0811 |
| 200576 | PIKFYVE | LZE7T | Human | Esophagus | ESCC | 1.90e-02 | 1.52e-01 | 0.0667 |
| 200576 | PIKFYVE | LZE24T | Human | Esophagus | ESCC | 6.92e-10 | 1.82e-01 | 0.0596 |
| 200576 | PIKFYVE | P1T-E | Human | Esophagus | ESCC | 1.31e-03 | 1.41e-01 | 0.0875 |
| 200576 | PIKFYVE | P2T-E | Human | Esophagus | ESCC | 1.27e-20 | 3.62e-01 | 0.1177 |
| 200576 | PIKFYVE | P4T-E | Human | Esophagus | ESCC | 1.29e-12 | 2.79e-01 | 0.1323 |
| 200576 | PIKFYVE | P5T-E | Human | Esophagus | ESCC | 4.33e-03 | 4.68e-02 | 0.1327 |
| 200576 | PIKFYVE | P8T-E | Human | Esophagus | ESCC | 2.42e-14 | 1.89e-01 | 0.0889 |
| 200576 | PIKFYVE | P9T-E | Human | Esophagus | ESCC | 1.68e-04 | 7.84e-02 | 0.1131 |
| 200576 | PIKFYVE | P10T-E | Human | Esophagus | ESCC | 3.47e-16 | 2.41e-01 | 0.116 |
| 200576 | PIKFYVE | P11T-E | Human | Esophagus | ESCC | 1.38e-04 | 2.79e-01 | 0.1426 |
| 200576 | PIKFYVE | P12T-E | Human | Esophagus | ESCC | 5.50e-20 | 3.38e-01 | 0.1122 |
| 200576 | PIKFYVE | P15T-E | Human | Esophagus | ESCC | 2.19e-11 | 2.67e-01 | 0.1149 |
| 200576 | PIKFYVE | P16T-E | Human | Esophagus | ESCC | 5.75e-11 | 2.25e-01 | 0.1153 |
| 200576 | PIKFYVE | P17T-E | Human | Esophagus | ESCC | 1.51e-04 | 2.56e-01 | 0.1278 |
| 200576 | PIKFYVE | P19T-E | Human | Esophagus | ESCC | 2.91e-03 | 2.07e-01 | 0.1662 |
| 200576 | PIKFYVE | P20T-E | Human | Esophagus | ESCC | 5.97e-10 | 2.07e-01 | 0.1124 |
| 200576 | PIKFYVE | P21T-E | Human | Esophagus | ESCC | 1.78e-12 | 1.97e-01 | 0.1617 |
| 200576 | PIKFYVE | P22T-E | Human | Esophagus | ESCC | 3.92e-15 | 2.52e-01 | 0.1236 |
| 200576 | PIKFYVE | P23T-E | Human | Esophagus | ESCC | 9.05e-09 | 2.13e-01 | 0.108 |
| Page: 1 2 3 4 |
| Tissue | Expression Dynamics | Abbreviation |
| Esophagus | 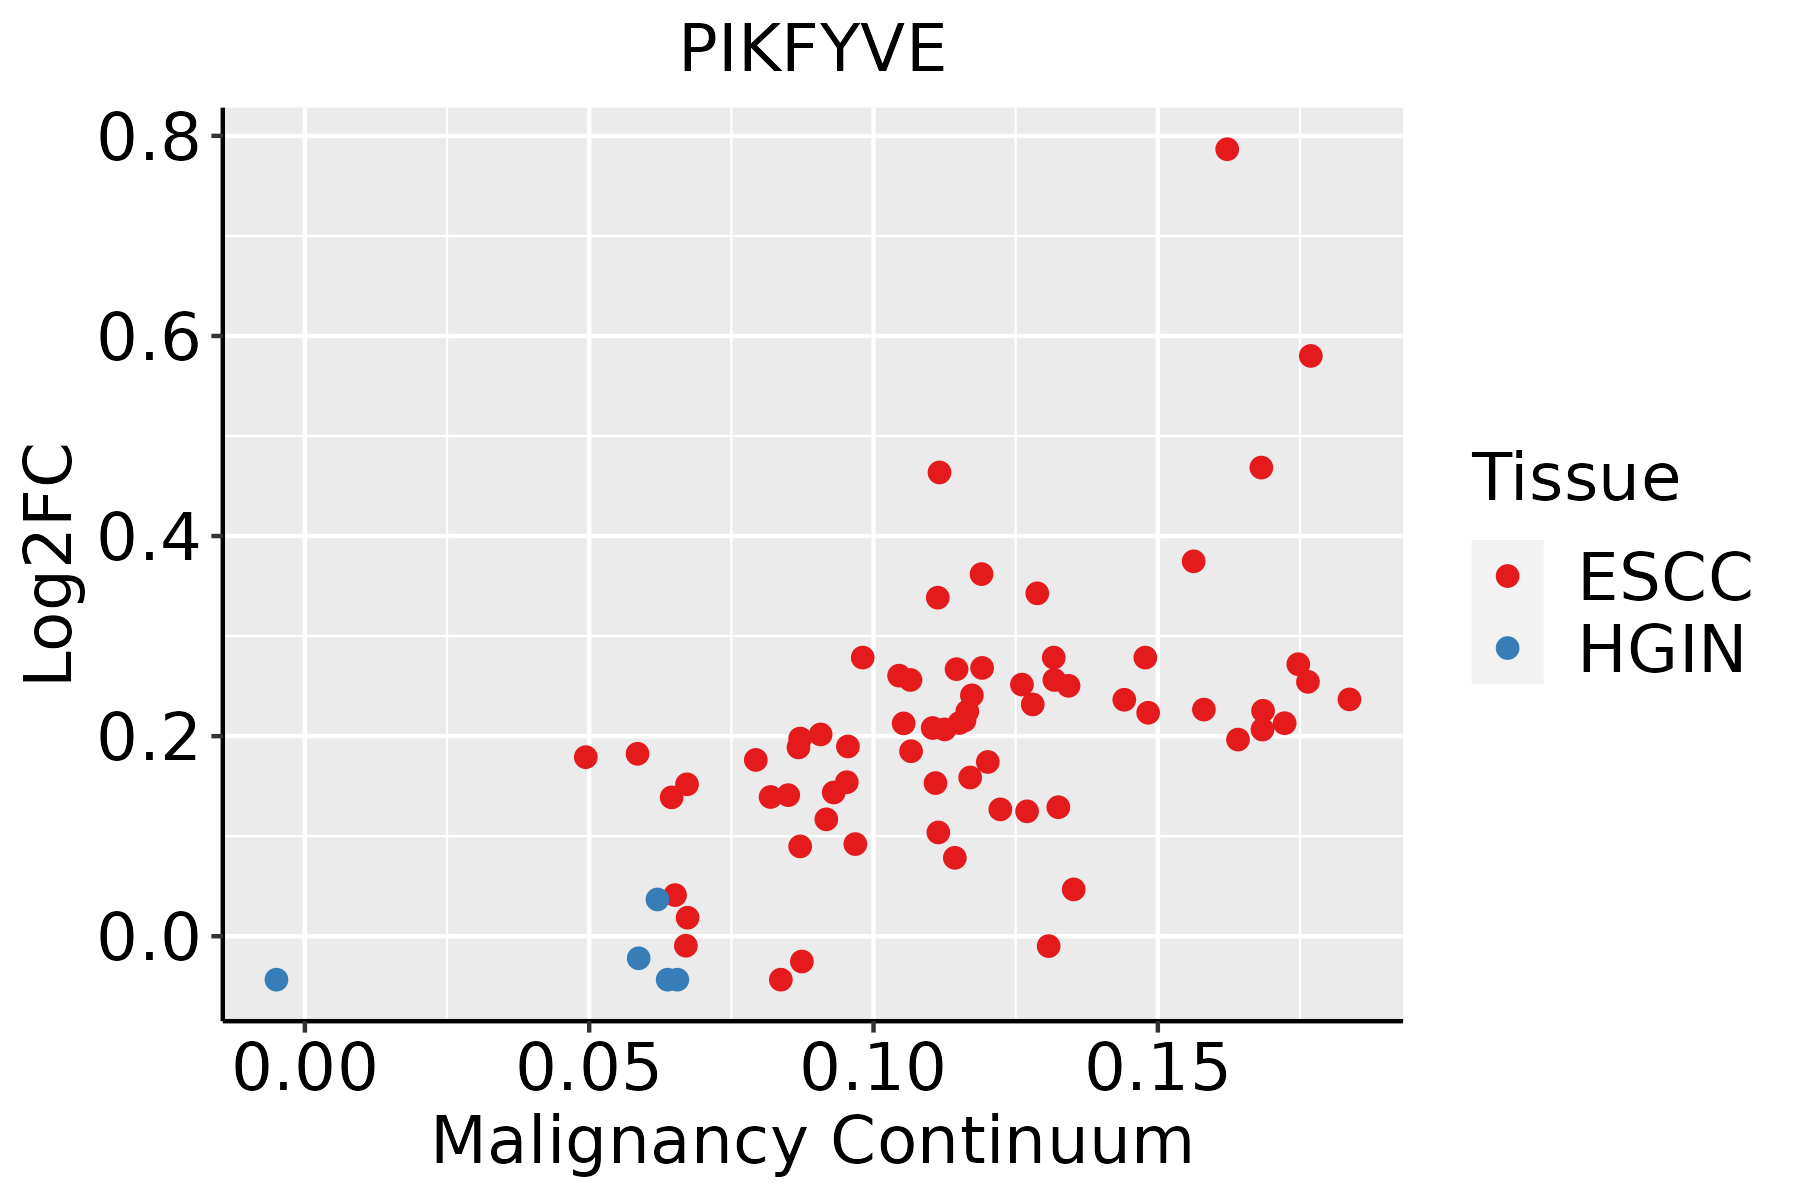 | ESCC: Esophageal squamous cell carcinoma |
| HGIN: High-grade intraepithelial neoplasias | ||
| LGIN: Low-grade intraepithelial neoplasias | ||
| Liver | 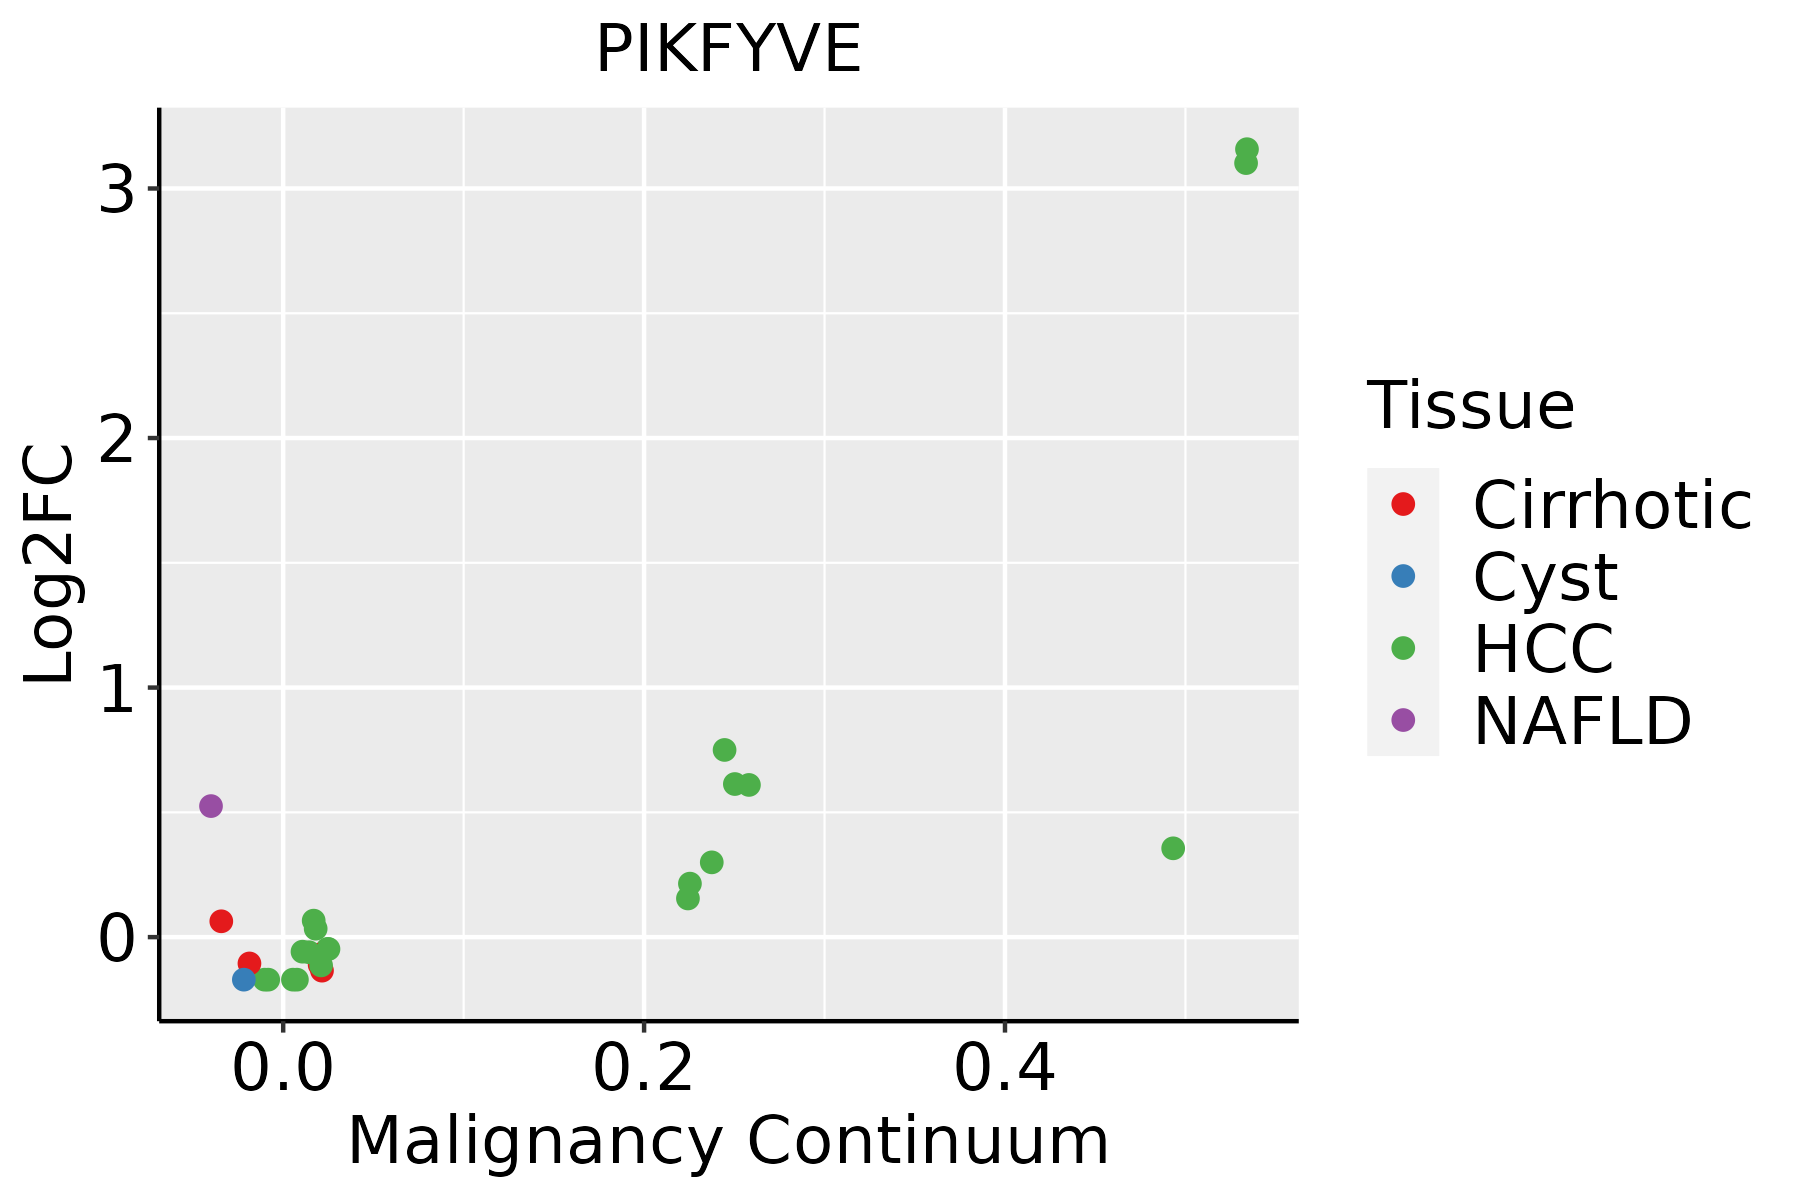 | HCC: Hepatocellular carcinoma |
| NAFLD: Non-alcoholic fatty liver disease |
| ∗log2FC in expression of this searched gene in stem-like cells from each diseased tissue sample relative to stem-like cells in normal samples in each tissue plotted against the malignancy continuum. Samples are colored based on if they are from different disease stage. |
Top |
Malignant transformation related pathway analysis |
| Find out the enriched GO biological processes and KEGG pathways involved in transition from healthy to precancer to cancer |
| Tissue | Disease Stage | Enriched GO biological Processes |
| Colorectum | AD |  |
| Colorectum | SER |  |
| Colorectum | MSS |  |
| Colorectum | MSI-H |  |
| Colorectum | FAP |  |
| ∗Top 15 enriched GO BP terms are showed in the bar plot of each disease state in each tissue. Each row represents a significant GO biological process which is colored according to the -log10(p.adjust). |
| Page: 1 2 3 4 5 6 7 8 9 |
| GO ID | Tissue | Disease Stage | Description | Gene Ratio | Bg Ratio | pvalue | p.adjust | Count |
| GO:0016032111 | Esophagus | ESCC | viral process | 301/8552 | 415/18723 | 3.34e-29 | 1.32e-26 | 301 |
| GO:001623617 | Esophagus | ESCC | macroautophagy | 216/8552 | 291/18723 | 1.94e-23 | 4.57e-21 | 216 |
| GO:0006605111 | Esophagus | ESCC | protein targeting | 229/8552 | 314/18723 | 4.93e-23 | 1.01e-20 | 229 |
| GO:003450418 | Esophagus | ESCC | protein localization to nucleus | 211/8552 | 290/18723 | 4.06e-21 | 6.60e-19 | 211 |
| GO:0019058111 | Esophagus | ESCC | viral life cycle | 226/8552 | 317/18723 | 1.17e-20 | 1.76e-18 | 226 |
| GO:001605014 | Esophagus | ESCC | vesicle organization | 211/8552 | 300/18723 | 2.85e-18 | 2.87e-16 | 211 |
| GO:001619715 | Esophagus | ESCC | endosomal transport | 168/8552 | 230/18723 | 2.28e-17 | 1.93e-15 | 168 |
| GO:0090150110 | Esophagus | ESCC | establishment of protein localization to membrane | 182/8552 | 260/18723 | 1.27e-15 | 8.19e-14 | 182 |
| GO:001648210 | Esophagus | ESCC | cytosolic transport | 124/8552 | 168/18723 | 9.69e-14 | 4.69e-12 | 124 |
| GO:000703314 | Esophagus | ESCC | vacuole organization | 127/8552 | 180/18723 | 1.04e-11 | 3.85e-10 | 127 |
| GO:0044403111 | Esophagus | ESCC | biological process involved in symbiotic interaction | 186/8552 | 290/18723 | 1.43e-10 | 4.16e-09 | 186 |
| GO:0051701111 | Esophagus | ESCC | biological process involved in interaction with host | 135/8552 | 203/18723 | 1.49e-09 | 3.49e-08 | 135 |
| GO:00086544 | Esophagus | ESCC | phospholipid biosynthetic process | 162/8552 | 253/18723 | 2.59e-09 | 5.73e-08 | 162 |
| GO:0052126111 | Esophagus | ESCC | movement in host environment | 117/8552 | 175/18723 | 1.14e-08 | 2.26e-07 | 117 |
| GO:00464744 | Esophagus | ESCC | glycerophospholipid biosynthetic process | 135/8552 | 211/18723 | 5.75e-08 | 1.02e-06 | 135 |
| GO:190503712 | Esophagus | ESCC | autophagosome organization | 73/8552 | 103/18723 | 1.88e-07 | 2.93e-06 | 73 |
| GO:00482844 | Esophagus | ESCC | organelle fusion | 94/8552 | 141/18723 | 3.72e-07 | 5.16e-06 | 94 |
| GO:00450175 | Esophagus | ESCC | glycerolipid biosynthetic process | 154/8552 | 252/18723 | 5.20e-07 | 6.96e-06 | 154 |
| GO:000004513 | Esophagus | ESCC | autophagosome assembly | 69/8552 | 99/18723 | 1.10e-06 | 1.38e-05 | 69 |
| GO:004677710 | Esophagus | ESCC | protein autophosphorylation | 138/8552 | 227/18723 | 2.98e-06 | 3.38e-05 | 138 |
| Page: 1 2 3 4 5 6 7 |
| Pathway ID | Tissue | Disease Stage | Description | Gene Ratio | Bg Ratio | pvalue | p.adjust | qvalue | Count |
| hsa0414530 | Esophagus | ESCC | Phagosome | 100/4205 | 152/8465 | 3.81e-05 | 1.72e-04 | 8.82e-05 | 100 |
| hsa0481028 | Esophagus | ESCC | Regulation of actin cytoskeleton | 133/4205 | 229/8465 | 5.94e-03 | 1.48e-02 | 7.56e-03 | 133 |
| hsa04145114 | Esophagus | ESCC | Phagosome | 100/4205 | 152/8465 | 3.81e-05 | 1.72e-04 | 8.82e-05 | 100 |
| hsa04810112 | Esophagus | ESCC | Regulation of actin cytoskeleton | 133/4205 | 229/8465 | 5.94e-03 | 1.48e-02 | 7.56e-03 | 133 |
| hsa0481010 | Liver | NAFLD | Regulation of actin cytoskeleton | 50/1043 | 229/8465 | 3.01e-05 | 7.59e-04 | 6.11e-04 | 50 |
| hsa0481011 | Liver | NAFLD | Regulation of actin cytoskeleton | 50/1043 | 229/8465 | 3.01e-05 | 7.59e-04 | 6.11e-04 | 50 |
| hsa0414521 | Liver | HCC | Phagosome | 93/4020 | 152/8465 | 4.27e-04 | 1.88e-03 | 1.05e-03 | 93 |
| hsa0481041 | Liver | HCC | Regulation of actin cytoskeleton | 134/4020 | 229/8465 | 4.48e-04 | 1.94e-03 | 1.08e-03 | 134 |
| hsa0414531 | Liver | HCC | Phagosome | 93/4020 | 152/8465 | 4.27e-04 | 1.88e-03 | 1.05e-03 | 93 |
| hsa0481051 | Liver | HCC | Regulation of actin cytoskeleton | 134/4020 | 229/8465 | 4.48e-04 | 1.94e-03 | 1.08e-03 | 134 |
| Page: 1 |
Top |
Cell-cell communication analysis |
| Identification of potential cell-cell interactions between two cell types and their ligand-receptor pairs for different disease states |
| Ligand | Receptor | LRpair | Pathway | Tissue | Disease Stage |
| Page: 1 |
Top |
Single-cell gene regulatory network inference analysis |
| Find out the significant the regulons (TFs) and the target genes of each regulon across cell types for different disease states |
| TF | Cell Type | Tissue | Disease Stage | Target Gene | RSS | Regulon Activity |
| ∗The dot plots of a searched regulon are shown for all cell subpopulations in each disease state of each tissue based on the regulon specific score inferred using pySCENIC and by calculating the average expression. |
| Page: 1 |
Top |
Somatic mutation of malignant transformation related genes |
| Annotation of somatic variants for genes involved in malignant transformation |
| Hugo Symbol | Variant Class | Variant Classification | dbSNP RS | HGVSc | HGVSp | HGVSp Short | SWISSPROT | BIOTYPE | SIFT | PolyPhen | Tumor Sample Barcode | Tissue | Histology | Sex | Age | Stage | Therapy Types | Drugs | Outcome |
| PIKFYVE | SNV | Missense_Mutation | novel | c.3530N>T | p.Ser1177Leu | p.S1177L | Q9Y2I7 | protein_coding | tolerated(0.61) | benign(0) | TCGA-A2-A0CX-01 | Breast | breast invasive carcinoma | Female | <65 | I/II | Chemotherapy | adriamycin | SD |
| PIKFYVE | SNV | Missense_Mutation | c.3199N>G | p.Leu1067Val | p.L1067V | Q9Y2I7 | protein_coding | deleterious(0) | probably_damaging(0.978) | TCGA-A2-A0D2-01 | Breast | breast invasive carcinoma | Female | <65 | I/II | Chemotherapy | adriamycin | SD | |
| PIKFYVE | SNV | Missense_Mutation | novel | c.1320N>T | p.Gln440His | p.Q440H | Q9Y2I7 | protein_coding | deleterious(0.03) | probably_damaging(0.986) | TCGA-A2-A25A-01 | Breast | breast invasive carcinoma | Female | <65 | I/II | Unspecific | Cytoxan | SD |
| PIKFYVE | SNV | Missense_Mutation | novel | c.3793N>A | p.Pro1265Thr | p.P1265T | Q9Y2I7 | protein_coding | deleterious(0.01) | benign(0.045) | TCGA-A2-A25C-01 | Breast | breast invasive carcinoma | Female | <65 | I/II | Chemotherapy | taxotere | SD |
| PIKFYVE | SNV | Missense_Mutation | c.1045C>G | p.Leu349Val | p.L349V | Q9Y2I7 | protein_coding | deleterious(0.03) | probably_damaging(0.978) | TCGA-A8-A093-01 | Breast | breast invasive carcinoma | Female | <65 | I/II | Hormone Therapy | tamoxiphen | SD | |
| PIKFYVE | SNV | Missense_Mutation | c.914N>T | p.Ser305Leu | p.S305L | Q9Y2I7 | protein_coding | deleterious(0.01) | probably_damaging(0.977) | TCGA-AC-A23H-01 | Breast | breast invasive carcinoma | Female | >=65 | I/II | Unknown | Unknown | PD | |
| PIKFYVE | SNV | Missense_Mutation | novel | c.1985N>T | p.Arg662Leu | p.R662L | Q9Y2I7 | protein_coding | deleterious(0) | probably_damaging(0.997) | TCGA-AC-A3W5-01 | Breast | breast invasive carcinoma | Female | >=65 | I/II | Chemotherapy | docetaxel | CR |
| PIKFYVE | SNV | Missense_Mutation | novel | c.623N>A | p.Arg208Gln | p.R208Q | Q9Y2I7 | protein_coding | deleterious(0) | benign(0.427) | TCGA-AN-A046-01 | Breast | breast invasive carcinoma | Female | >=65 | I/II | Unknown | Unknown | SD |
| PIKFYVE | SNV | Missense_Mutation | novel | c.5222N>A | p.Ser1741Tyr | p.S1741Y | Q9Y2I7 | protein_coding | tolerated(0.12) | benign(0.001) | TCGA-AN-A046-01 | Breast | breast invasive carcinoma | Female | >=65 | I/II | Unknown | Unknown | SD |
| PIKFYVE | SNV | Missense_Mutation | c.41C>G | p.Ala14Gly | p.A14G | Q9Y2I7 | protein_coding | tolerated_low_confidence(0.28) | benign(0.024) | TCGA-AO-A1KT-01 | Breast | breast invasive carcinoma | Female | >=65 | I/II | Chemotherapy | fluorouracil | SD |
| Page: 1 2 3 4 5 6 7 8 9 10 11 12 13 14 15 16 17 18 19 20 21 22 |
Top |
Related drugs of malignant transformation related genes |
| Identification of chemicals and drugs interact with genes involved in malignant transfromation |
| (DGIdb 4.0) |
| Entrez ID | Symbol | Category | Interaction Types | Drug Claim Name | Drug Name | PMIDs |
| 200576 | PIKFYVE | SERINE THREONINE KINASE, ENZYME, KINASE | LAM-002 | |||
| 200576 | PIKFYVE | SERINE THREONINE KINASE, ENZYME, KINASE | Apilimod dimesylate | |||
| 200576 | PIKFYVE | SERINE THREONINE KINASE, ENZYME, KINASE | inhibitor | 363894153 | APILIMOD |
| Page: 1 |

Copyright 2023-Present -The University of Texas Health Science Center at Houston |